Introduction
Cognition is dependent on cortical reorganization, which is a dynamic process driven by connections between intact cortical regions (Hogstrom et al., Reference Hogstrom, Westlye, Walhovd and Fjell2013). Following vision injury, the visual, auditory, and sensory motor regions undergo structural and functional reconfiguration, and is different in early blind (EB) and late blind (LB) children (Voss et al., Reference Voss, Gougoux, Zatorre, Lassonde and Lepore2008; Merabet & Pascual-Leone, Reference Merabet and Pascual-Leone2010). When visual stimulus is processed, the dorsal and ventral visual pathways utilize the visual cortex as part of a compensatory strategy (Anurova et al., Reference Anurova, Renier, De Volder, Carlson and Rauschecker2015). Neuroimaging techniques have shown that the occipital brain of vision-impaired children respond to diverse perception-based cognitive tasks (Striem-Amit et al., Reference Striem-Amit, Cohen, Dehaene and Amedi2012).
In both the EB and LB groups, the pathways associated with perceptual processing and the tracts of white matter (WM) integrity have been reported to be distinct (Leporé et al., Reference Leporé, Voss, Lepore, Chou, Fortin, Gougoux, Lee, Brun, Lassonde, Madsen and Toga2010; Hogstrom et al., Reference Hogstrom, Westlye, Walhovd and Fjell2013). In EB and LB children, a reduction in gray matter (GM) in the primary visual cortex (V1), as well as networking differences has been reported (White et al., Reference White, Su, Schmidt, Kao and Sapiro2010; Striem-Amit et al., Reference Striem-Amit, Cohen, Dehaene and Amedi2012). Absence of vision alters the thickness of the primary visual region (Anurova et al., Reference Anurova, Renier, De Volder, Carlson and Rauschecker2015). Increased cortical thickness (CT) of the visual cortex and its correlation with the age at onset has been reported in EB compared to LB children, but the cut-off of onset of blindness was varied in the reported studies; 0–4 years for EB (Jiang et al., Reference Jiang, Zhu, Shi, Liu, Li, Qin, Li, Yu and Jiang2009; Voss & Zatorre, Reference Voss and Zatorre2012; Anurova et al., Reference Anurova, Renier, De Volder, Carlson and Rauschecker2015), while for LB, a broad range between 0 to 34 years is seen (Jiang et al., Reference Jiang, Zhu, Shi, Liu, Li, Qin, Li, Yu and Jiang2009; Voss & Zatorre, Reference Voss and Zatorre2012; Anurova et al., Reference Anurova, Renier, De Volder, Carlson and Rauschecker2015). Decreased WM integrity in the optic radiation (OR) and an increase in corticospinal tract (CST) has been demonstrated by probalistic tractography in EB children, but no significant changes were reported in LB children (Leporé et al., Reference Leporé, Voss, Lepore, Chou, Fortin, Gougoux, Lee, Brun, Lassonde, Madsen and Toga2010).
Mapping of the CT relies upon the separation among the surface area of GM and WM from the pial surface. Gyrification index (GI), the folding of gyrus and sulcus in the surface of the brain, facilitates functional and structural connectivity (White et al., Reference White, Su, Schmidt, Kao and Sapiro2010). The inner-outer sulcal, cortical folding, the gyrification-based surface approach, and the surface estimates are inferred from GI (Yotter et al., Reference Yotter, Dahnke, Thompson and Gaser2011a,Reference Yotter, Nenadic, Ziegler, Thompson and Gaserb; Lamballais et al., Reference Lamballais, Vinke, Vernooij, Ikram and Muetzel2020). GI change is affected by age, cognitive load in children and adolescents (Lamballais et al., Reference Lamballais, Vinke, Vernooij, Ikram and Muetzel2020). Therefore, the persistence of effects of these changes with respect to their blindness onset and duration of Braille reading need to be explored in visually deprived children is required (Yotter et al., Reference Yotter, Nenadic, Ziegler, Thompson and Gaser2011b; Lamballais et al., Reference Lamballais, Vinke, Vernooij, Ikram and Muetzel2020).
Previous studies have also shown cross modal functional plasticity in the visual cortex after visual deprivation and structural reorganization (Jiang et al., Reference Jiang, Zhu, Shi, Liu, Li, Qin, Li, Yu and Jiang2009). The restructuring of cortical and subcortical areas subsequent to sensory loss and the role of influencing factors like age, age of onset, and the duration of education skills on neuro-anatomical alteration in the EB and LB children would help in understanding the cognition relative to education and training. The objective of the present study was to evaluate the whole brain surface estimates (cortical depth, GI, GM volume, and WM integrity) to understand the structural differences that may exist in EB and LB children.
Materials and methods
Participants
The EB children in our study had vision loss throughout their first years of life (up to 6 months), while the LB children had vision loss after 4 years of age. To eliminate allocentric and egocentric reference frame overlap, no children with vision loss between the ages of 6 months and 4 years were enrolled (Volcic & Kappers, Reference Volcic and Kappers2008).
Consent from children and their parents/legally authorized representative was obtained after the institutional ethics committee approved the study. The neuro-ophthalmologist tested both eyes for visual acuity (central vision) and visual field (peripheral vision) to make the clinical diagnosis of absolute blindness (Supplementary Table S1). Controls were volunteers in good mental and physical state, without any history of neurological/psychiatric disorders. A total of 45 EB children, 49 LB children, and 35 controls were screened. Montreal cognitive assessment test (MoCA) was used for global cognition assessments in blind, and Edinburgh handedness test for handedness testing (Oldfield, Reference Oldfield1971; Wittich et al., Reference Wittich, Phillips, Nasreddine and Chertkow2010).
Data acquisition
A 3T MR scanner (Achieva 3.0T TX, Philips Medical Systems, Eindhoven, The Netherlands) with a 32-channel head coil was used for the imaging. Diffusion tensor imaging (DTI) data were acquired in 75 slices having 3 mm thickness (with no gap) in transverse orientation with parameters: 16 directions, 2b-values (0 and 800); field of view (FOV)-230mm; repetition time (TR)/echo time (TE): 8200/100 ms; and Flip angle: 90°. T1-weighted structural imaging with following parameters: 160 slices of 1 mm thickness in sagittal orientation; TR/TE: 1900/3.37 ms; and 256 mm FOV was acquired.
Structural analysis
Structural (T1WI) data were processed with the CAT12 toolbox (version CAT12.6; 1445 SPM12, 6225) using MATLAB (ver 2019a) to extract surface based CT and GI estimates. Datasets were reoriented to AC-PC line and subjected to local adaptive segmentation for CT and other surface estimates (Dahnke et al., Reference Dahnke, Ziegler and Gaser2012), by performing the topological correction for repairing of topological defects (Yotter et al., Reference Yotter, Dahnke, Thompson and Gaser2011a), globular mapping for inter subject estimation and then spherical registration (Yotter et al., Reference Yotter, Dahnke, Thompson and Gaser2011a; Yotter et al., Reference Yotter, Thompson and Gaser2011c). GI assessment was based on complete average curvature (Lamballais et al., Reference Lamballais, Vinke, Vernooij, Ikram and Muetzel2020). CT and GI surface parameters were smoothened using 15 and 20 mm Gaussian kernel, respectively (Luders et al., Reference Luders, Thompson, Narr, Toga, Jancke and Gaser2006). Age at onset and duration of Braille reading were used as covariates for the CT and GI analysis, and total intracranial volume (TIV) was used as an additional covariate for the GI analysis (Malone et al., Reference Malone, Leung, Clegg, Barnes, Whitwell, Ashburner, Fox and Ridgway2015). Region of interest (ROI)-based analysis was used to assess intergroup variations in surface measurements, based on the Desikan–Killiany (DK40) cortex atlas (Desikan et al., Reference Desikan, Ségonne, Fischl, Quinn, Dickerson, Blacker, Buckner, Dale, Maguire, Hyman and Albert2006). The correlation analysis between the surface measurements, global cognition, language domain specific identification, and reaction time was done using multiple linear regressions. The average CT and GI for the defined region of interest was considered significant for the analysis by avoiding false positive when P < 0.001.
The DTI data were processed using the probabilistic tractography of FSL (Woolrich et al., Reference Woolrich, Jbabdi, Patenaude, Chappell, Makni, Behrens, Beckmann, Jenkinson and Smith2009; Jenkinson et al., Reference Jenkinson, Beckmann, Behrens, Woolrich and Smith2012). After eddy current correction of the DTI datasets, the brain extraction was performed using brain extraction tool and then FA maps along with the Eigen vectors and apparent diffusion coefficient (ADC) maps were generated using DTIFIT. Tractography-based spatial statistics (TBSS) was performed using the using standard pipeline. ANOVA (P < 0.05) was used for intergroup comparison. Probabilistic tractography were estimated between left and right primary visual cortex as seed areas and thalamo-cortical and cortico-spinal tracts as target regions from the FA maps. Resulting image representing the differences in EB and LB groups in comparison to control group was superimposed onto the T1_MNI152_1 mm template and ADC and FA were calculated (Desikan et al., Reference Desikan, Ségonne, Fischl, Quinn, Dickerson, Blacker, Buckner, Dale, Maguire, Hyman and Albert2006).
Statistical analysis
Wilcoxon rank-sum (Mann–Whitney) tests Kruskal–Walli’s tests and analysis of variance (ANOVA) were used for intergroup comparisons between EB, LB, and SC groups. Correlation of the structural data estimates (GI and CT) with age of onset at blindness, interval of education, and MoCA-blind rating scales, and correlation of the MOCA-blind rating scale with age of onset at blindness and interval of education were estimated in EB and LB groups using STATA (version 12.1, StataCorp LLC, College Station, Texas, USA).
Results
Behavioral data and structural estimates (CT and GI) were assessed in 40 EB (19 male/21 female, mean age ± s.d.): 12.17 ± 3.23 years), 40 LB (15 male/25 female, mean age ± s.d.: 12.75 ± 3.26 years), and 30 sighted controls (SCs; 21 male/9 female, mean age ± s.d.: 13.23 ± 3.73 years), all right-handed.
Behavioral data
Behavioral data were assessed for fluency of Braille reading, auditory cue identification and MoCA rating score. Precision of Braille reading did not differ between groups (P = 0.37) or tasks (P = 0.35). EB and LB children performed semantic word identification and perception tasks at increased identification levels (EB, 89 ± 1% [mean ± s.e.m.] and LB, 88 ± 2%, respectively). Performance on auditory word detection task for the response time was similar in both the groups (95 ± 2% in EB and 94 ± 1% in LB; P = 0.38).
The EB and LB groups differed significantly on cognition rating scores (MoCA-blind). Significantly reduced cognitive abilities for language, delayed recall and attention components were evident in LB children compared to EB group, while other cognitive domains were not significantly different (Supplementary Table S2).
A correlation analysis between MoCA-blind total score with age of onset and education was evaluated in the both the EB and LB groups, to evaluate the impact of the onset age on blindness and the period of education in terms of cognition (Table 1). With correction for age, both EB (ρ = 0.45, P = 0.003) and LB (ρ = 0.63, P = 0.03) groups correlated positively with MoCA-blind score.
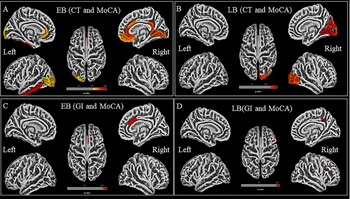
Correlation analysis between surface measures (cortical thickness and gyrification index) and MoCA measures using whole brain region of interest (ROI) approach with Desikan–Killiany (DK-40) atlas in early blind

Surface based analysis
Total volume of GM, cerebrospinal fluid volume, and TIV did not reveal any significant difference between LBs and SCs. Although total WM volume differed across the groups, post-hoc analysis with Bonferroni correction revealed no significant differences between the LB and SC groups (Supplemental Material Fig. S1).
At Holm-Bonferroni corrected (P < 0.05 false discovery rate [FDR] corrected), there was a widespread change in CT in the EB group compared to the LB and SC groups. There was a difference on CT and GI between EB and LB groups. Increased CT was observed in frontal, temporal, parietal, and occipital regions in EBs in comparison to both LB and SC groups (Supplementary Material Fig. S2 and Table S3).
In comparison to the SC group, GI examination revealed a significant difference in EB and LB children (P = 0.05, FDR adjusted). In the left occipital and frontal regions, there was a reduction in gyrification between the LB and SC groups (Fig. 1 and Supplementary Table S4).
The gyrification index has been superimposed on the brain using the Desikan–Killiany (DK-40) cortical atlas for ROI estimation. (A) Early blind in comparison to sighted controls (EB > SC). (B) LB > SC (Holm–Bonferroni correction followed by FDR correction, ROI statistics are provided in Supplementary Table S3).

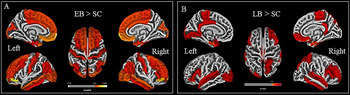
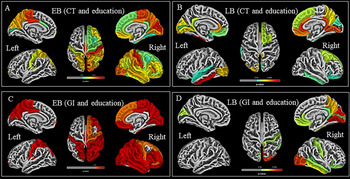
The duration of education and age at onset revealed a positive correlation with CT and a negative correlation with GI in EB group (corrected for Holm–Bonferroni [P < 0.05], on whole brain analysis; Table 1 and Fig. 2). CT and GI exhibited a correlation with MoCA-blind rating score in EB (corrected Holm–Bonferroni, P < 0.05; Fig. 3 and Supplementary Table S5).
Correlation between cortical thickness and Braille education was estimated in (A) early blind participants (positive correlation); (B) late blind group (positive correlation) Correlation between gyrification index and education was also estimated in (C) early blind (positive correlation); and (D) late blind (positive correlation with visual cortex and negative correlation with fronto-parietal areas) at a significance level of P < 0.05, Holm–Bonferroni corrected.

Correlation between cortical thickness and MoCA were calculated in (A) early blind group (positive correlation); (B) late blind group (positive correlation); and the correlation between gyrification index and MoCA for global cognition was estimated in (C) early blind (positive correlation) and in late blind (D) positive correlation with parietal and negative correlation with visual area at the significance level of P < 0.05, Holm–Bonferroni corrected.

Group-by-group correlation of regional mean GI and mean CT
Mean CT and GI revealed a positive correlation with bilateral entorhinal cortex, visual cortex, primary motor area, superior temporal gyrus somatosensory areas, primary auditory area, inferior frontal gyrus, and hippocampus in EB and LB children (P < 0.05; Fig. 3 and Supplementary Table S4).
Receiver operating curve (ROC) analysis
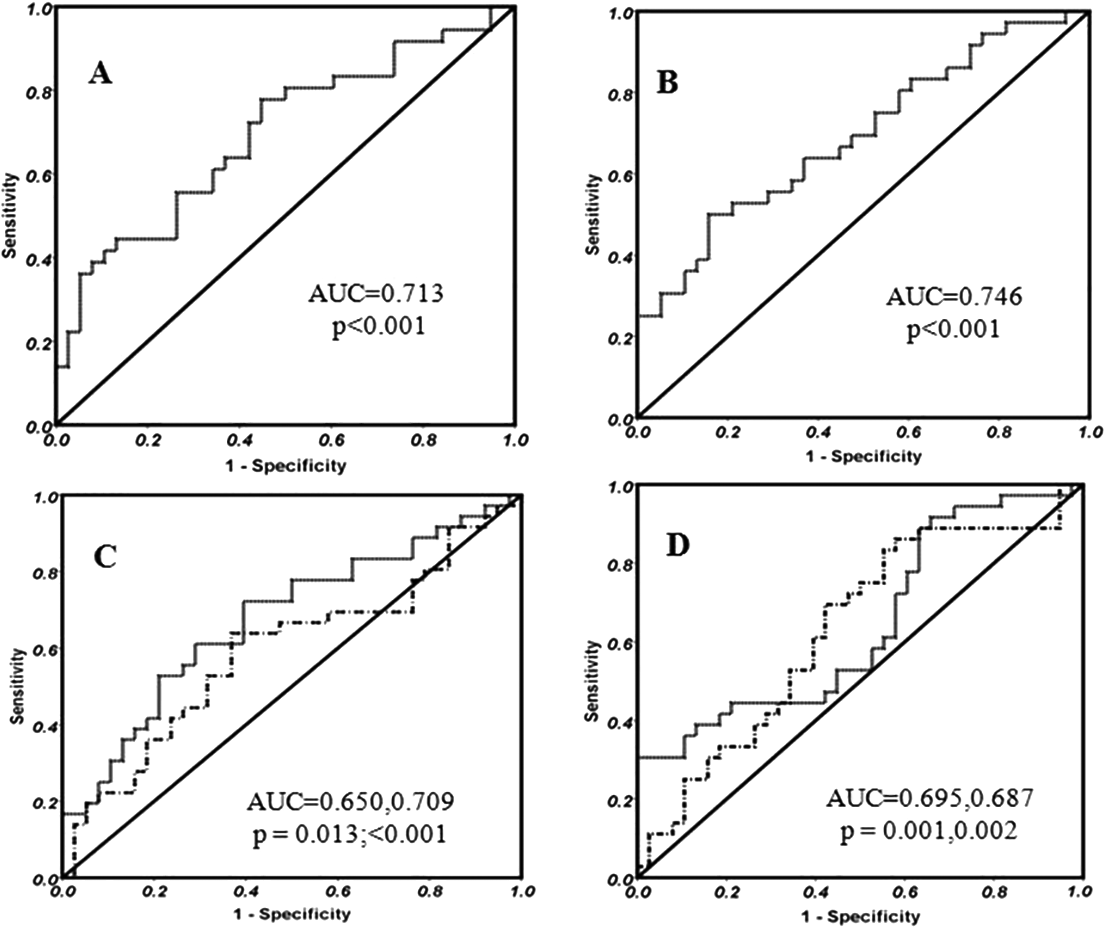
Significant area under the curve (AUC) was observed in various regions on CT and GI, which was different in EB as compared to LB children (Fig. 4 and Supplementary Table S7).
The AUC for the mean cortical thickness of the (A) right caudal anterior cingulate, (B) right lingual fusiform, (C) bilateral precuneus, and (D) bilateral cuneus in differentiating the early blind and late blind is shown in the ROC curve (at a significance level of P < 0.001; detailed statistics in Supplementary Table).

Diffusion tensor imaging
ROI was defined in bilateral primary visual cortex (V1) area, and the thalamo-cortical, fronto-parietal and optic radiation regions were analyzed for voxel-wise comparison evaluation for the assessment of difference among groups, and estimation of FA values. Calcarine sulcus from occipital lobe to the parieto-occipital region (antero-posteriorly) bordering the secondary visual area (V2) besides VI was selected as focal points.
In SCs, the axonal connections between the retina and the occipital cortex are observed to be interconnected. The lateral geniculate nucleus and the length of the connections in the orbito-frontal and pulvinar regions were intact in sighted participants.
In EB group, pathway from the retina to the lateral geniculate body and the occipital cortex revealed atrophy, suggesting disruption of the pathways as compared to SC. Pulvinar, orbito-frontal region along with temporal pole were absent bilaterally, except in right orbito-frontal lobe projections in EB children as compared to the SC children. Primary and secondary visual cortex revealed contralateral dominance in WM.
In LB group, the structural fibers from the retina to the occipital lobe via the lateral geniculate body largely appear to be preserved and connected as compared to EB children. Tracts were absent in temporal pole and a right hemispheric difference were observed for the V1 and V2 areas in this group.
Intergroup analysis
Several areas of visual cortex (especially primary visual cortex) exhibited alterations in WM integrity and reduced FA values in EB children as compared to the SC group (Supplementary Fig. S3). When comparing with the LB group, significant differences in FA were found in WM to V1/V2 regions of left hemisphere in EB, but in LB, changes were seen in the right hemisphere. Increased connections of WM in the contralateral calcarine area involving BA 17 and 18 (P < 0.05, FDR corrected) was also present in EB as compared to LB. Increased WM was seen in frontal and parietal areas in EB children compared to LB group. Increased WM was observed in bilateral cuneus region in EB as compared to LB group. Reduced WM was observed in occipital regions (superior occipital area and occipital fusiform area) in EB and LB groups in comparison to SCs (Supplementary Table S6).
Discussion
This study explored the CT and GI and the impact of education, onset age, and the duration of loss of sight on the GI in the visual cortex, primary motor area, primary auditory area, and somatosensory areas in EB, LB, and SC children. Increased CT and GI of occipital cortex in EB children (compared to LB) correlated with the duration of education skills.
The extent of occipital thickening and the altered GI correlated positively with MoCA scores (Braille reading, auditory cue identification based on the learning memory abilities) (Cohen et al., Reference Cohen, Celnik, Pascual-Leone, Corwell, Faiz, Dambrosia, Honda, Sadato, Gerloff, Catala and Hallett1997; Amedi et al., Reference Amedi, Raz, Pianka, Malach and Zohary2003; Gougoux et al., Reference Gougoux, Zatorre, Lassonde, Voss and Lepore2005; Jenkinson et al., Reference Jenkinson, Beckmann, Behrens, Woolrich and Smith2012; Voss & Zatorre, Reference Voss and Zatorre2012). Cortical thickening of visual cortex was observed in EB and LB compared to SC children. The thickening of visual cortex was positively correlated with global cognition and duration of Braille reading, which has been associated with enhanced performance of the perception of semantic word recognition and auditory perception (Voss & Zatorre, Reference Voss and Zatorre2012). The CT of visual cortical areas was increased in left hemisphere in EB and right hemisphere in LB children, and correlated with the onset of blindness and the duration of education. The hemispheric difference of cortical thickening in the primary visual area suggests difference in processing of the haptic and acoustic information in EB and LB children (Sadato et al., Reference Sadato, Pascual-Leone, Grafman, Ibañez, Deiber, Dold and Hallett1996; Röder et al., Reference Röder, Teder-Sälejärvi, Sterr, Rösler, Hillyard and Neville1999; Sadato et al., Reference Sadato, Okada, Honda and Yonekura2002; Amedi et al., Reference Amedi, Raz, Pianka, Malach and Zohary2003; Li et al., Reference Li, Song, Xu, Qin, Yu and Jiang2017). Cortical thickness was higher in lingual gyrus, cuneus inferior-superior-middle occipital gyrus in EB children with respect to that in LB and SC children. EB showed WM integrity in thalamo-cortical and corticospinal tracts (in comparison with LB children) and was correlated positively with global cognition performance suggesting better compensatory mechanism. This observation may be attributed to decreased synaptic pruning during the ontogeny, with intact thalamo-cortical and cortico-cortical associations (Rauschecker, Reference Rauschecker1995; Kingsbury et al., Reference Kingsbury, Lettman and Finlay2002; Karlen et al., Reference Karlen, Kahn and Krubitzer2006; Jiang et al., Reference Jiang, Zhu, Shi, Liu, Li, Qin, Li, Yu and Jiang2009; Park et al., Reference Park, Lee, Kim, Park, Oh, Lee and Kim2009; Voss & Zatorre, Reference Voss and Zatorre2012).
Increased WM impairment observed in LB group (as compared to the EB) may indicate better compensatory adaptation in the EB children than in the LB (Li et al., Reference Li, Liu, Qin, Jiang, Qiu, Xu, Yu and Jiang2013a; Wang et al., Reference Wang, Qin, Liu, Zhang, Jiang and Yu2013). The reduced FA in bilateral optic radiation in EB group, and the decreased FA in bilateral optic radiation, thalamic-cortical, corpus callosum, including regions of parietal and frontal WM in LB group are positively correlated with CT. The results suggest the processing of visual information by primary visual cortex in LB, in spite of vision loss. WM alterations in LB may be due to diminishing anterior regions of anterior neuronal pathway of visual system (Li et al., Reference Li, Jiang, Guo, Li, Cai and Yin2013b). The alterations in the CT and the WM integrity may be attributed to restructuring of visual pathway following vision loss and interference of synaptic pruning during developmental age (Jiang et al., Reference Jiang, Zhu, Shi, Liu, Li, Qin, Li, Yu and Jiang2009; Park et al., Reference Park, Lee, Kim, Park, Oh, Lee and Kim2009; White et al., Reference White, Su, Schmidt, Kao and Sapiro2010; Petanjek et al., Reference Petanjek, Judaš, Šimić, Rašin, Uylings, Rakic and Kostović2011; Li et al., Reference Li, Jiang, Guo, Li, Cai and Yin2013b; Li et al., Reference Li, Song, Xu, Qin, Yu and Jiang2017). The gyrification changes in precentral and para-central gyrus involving both the motor and the sensorimotor areas (Brodmann areas 1, 2, 3, 4, 6) revealed a strong positive correlation with the duration of education, and suggests reorganization and better performance by EB children than LB children (Li et al., Reference Li, Song, Xu, Qin, Yu and Jiang2017).
EB children showed an increased FA in CST with respect to that in SCs (Yu et al., Reference Yu, Shu, Li, Qin, Jiang and Li2007), indicating experience induced plasticity, associating the visual cortex involvement in various nonvisual tasks (Yu et al., Reference Yu, Shu, Li, Qin, Jiang and Li2007; Li et al., Reference Li, Jiang, Guo, Li, Cai and Yin2013b). Additionally, the visually impaired children have increased acoustic training to perform daily routine activities as compared to sighted children that may modify the myelination of specific axons (Hofstetter et al., Reference Hofstetter, Sabbah, Mohand-Saïd, Sahel, Habas, Safran and Amedi2019). Increased FA value of CST in LB group with intact visual system and with visual imagery experience is indicative of the persistent role of CST plasticity (Veraart et al., Reference Veraart, De Volder, Wanet-Defalque, Bol, Michel and Goffinet1990; Voss et al., Reference Voss, Lassonde, Gougoux, Fortin, Guillemot and Lepore2004).
Increase in the CT in occipital region was correlated with MoCA scores and duration of education skills in LB group as compared to SCs, confirming its role in touch and auditory-based global cognition (Veraart et al., Reference Veraart, De Volder, Wanet-Defalque, Bol, Michel and Goffinet1990; De Volder et al., Reference De Volder, Bol, Blin, Robert, Arno, Grandin, Michel and Veraart1997). Previous studies have revealed reorganizational variations in the brain of LB group, with the plasticity extending to adult and elderly people (Pan et al., Reference Pan, Wu, Li, Lin, Sun and Lei2007; Leporé et al., Reference Leporé, Voss, Lepore, Chou, Fortin, Gougoux, Lee, Brun, Lassonde, Madsen and Toga2010). In Heschl’s gyrus, group variances in CT were detected in bilateral primary auditory gyrus (BA41), where the cortex was thicker in LB children than in SCs. Better synaptic efficiency may have a good impact on its cortical reorganization in EB, as revealed by an increased cortical thickening of the left hemispheric ITG, STG, and anterior BA 41 cortical areas (Amedi et al., Reference Amedi, Raz, Pianka, Malach and Zohary2003). Cortical thickness in the occipital and auditory cortical areas correlated with the duration of blindness and the duration of educational skills in early and LB children. The cognitive regions associated with higher executive functioning (frontal regions) and motor cortices undergoes structural changes in EB group to compensate for visual deprivation in EB (Li et al., Reference Li, Liu, Qin, Jiang, Qiu, Xu, Yu and Jiang2013a; Wang et al., Reference Wang, Qin, Liu, Zhang, Jiang and Yu2013). Thicker visual and auditory cortex suggests training dependent plasticity associated with synaptic reorganization (Voss & Zatorre, Reference Voss and Zatorre2012). Early visual impairment results in changes in surface indices and WM tracts of visual cortex throughout the critical developmental period.
Conclusion
In EB and LB people, CT, GIs, and TBSS estimates for voxel-wise comparison of tracts indicated distinct remodeling of visual areas. These changes were proportional to the duration of education and the age at which blindness began.
Funding statement
This work was supported by Department of Science and Technology, Government of India (vide grants SR/CSI/23/2009 and SR/CSI/176/2012).
Conflicts of interest
No potential competing interest by the authors.
Supplementary Materials
To view supplementary material for this article, please visit http://dx.doi.org/10.1017/S0952523821000080.