
I. INTRODUCTION
Li-ion batteries (LIBs) have become the dominant power source for portable electronics and are also used in electric vehicles (EVs), which are gaining traction due to the environmental concerns caused by conventional fuel-powered vehicles. To facilitate the wide application of EVs, their range anxiety issues must be addressed, which necessitate the search for novel electrode materials that are able to endow LIBs with higher capacity and energy density. Extensive R&D efforts have been devoted to developing new high-capacity anode materials, like tin (993 mA h/g, Li4.4Sn), germanium (1620 mA h/g, Li4.4Ge), and silicon (4200 mA h/g, Li4.4Si), as alternatives to the current graphite anode (372 mA h/g, LiC6). Among them, Si is undoubtedly a promising candidate due to its high capacity and abundance. However, Si suffers from large intrinsic volumetric expansion (∼400%) upon Li insertion and contraction upon Li extraction, which causes electrode pulverization and subsequent loss of electrical contact between the active material and current collector, leading to poor reversibility and cyclability. Reference Szczech and Jin1–Reference Alaboina, Cho and Cho4 In recent years, Si nanowires, Reference Chan, Patel, O’Connell, Korgel and Cui5–Reference Etacheri, Haik, Goffer, Roberts, Stefan, Fasching and Aurbach11 nanotubes, Reference Rong, Fang, Ge, Chen, Xu and Zhou12,Reference Wu, Chan, Choi, Ryu, Yao, McDowell, Lee, Jackson, Yang, Hu and Cui13 and nanoparticles Reference Ge, Rong, Fang, Zhang, Lu and Zhou14–Reference Wang and Kumta24 have been studied to show the potential of nano-Si to achieve better capacity retention and cycle life than bulk Si. Given the high availability, cost effectiveness, and scalability of Si nanoparticles (SiNPs), they are likely candidates for the creation of next-generation high-capacity anodes for rechargeable EV batteries.
Meanwhile, another approach to increasing the energy density of LIBs is to reduce the entire battery weight by eliminating the mass of electrochemically inactive materials, such as binders and metal current collectors involved in the common slurry coating method for electrode fabrication. The use of insulating polymer binders results in increased electrical resistance, reduction of active surface area and maximum achievable specific energy (SE), introduction of contaminants, and thermal/chemical/mechanical degradation leading to device failure. Reference Smithyman, Moench, Liang, Zheng, Wang and Zhang25 The metal current collector, which is usually a 10-μm-thick Cu sheet with an areal density of ∼10 mg/cm2 for the anode side, is comparable in weight with the anode active material and accounts for 10% of the total weight of a Li-ion cell. Reference Cui, Hu, Choi and Cui26 Theoretical calculations done by Landi et al. Reference Landi, Cress and Raffaelle27 showed that metal current collector-free high-capacity anodes can lead to an increase in SE by 80% when paired with conventional lithiated metal oxide cathodes.
The removal of binders and metal current collectors has been implemented through electrically conductive and mechanically strong materials as electrodes or as support for active materials, such as carbon nanotubes (CNTs), Reference Ng, Wang, Guo, Chen, Wang and Liu28–Reference Hu, Wu, Gao, Cao, Li, McDough, Xie, Zhou and Cui37 graphene, Reference Lee, Smith, Hayner and Kung16,Reference Tao, Fan, Mei and Qu38–Reference Zhao, Hayner, Kung and Kung43 carbon nanofibers (CNFs), Reference Choi, Hu, Cui, McDonough and Cui10,Reference Nan, Huang, Lv, Lin, Yang, Yu, Ye, Shen, Sun and Kang44,Reference Wang, Song, Wang and Fan45 and carbon foam. Reference Roy, Zhong, Schwab, Binder, Venkataraman and Tomovic46 The processing of graphene always involved handling of concentrated acid and its mass loading was impractically low or unknown, and the graphene, CNFs, and carbon foam architectures required a delicate design and complicated preparation process. In this regard, CNTs are favored because they can be commercially produced in large scale. However, the previous reports on freestanding Si–CNT film anodes fabricated by chemical vapor deposition (CVD) or pulsed laser deposition (PLD) entailed the use of hazardous silane gas and/or high vacuum and complex, costly equipment. Reference Forney, Ganter, Staub, Ridgley and Landi33–Reference Chou, Zhao, Wang, Chen, Liu and Dou35,Reference Hu, Wu, Gao, Cao, Li, McDough, Xie, Zhou and Cui37 Although Yue et al. adopted a filtration method, their procedure required a high temperature sintering step at 800 °C and they used sodium carboxymethyl cellulose (CMC) binder and only studied the charge–discharge performance up to 30 cycles. Reference Yue, Zhong and Zhang36
The focus in this work is on an inexpensive and scalable method feasible for combining commercial SiNPs, which have been studied as a practically scalable candidate anode material, Reference Zhou, Li, Wang, Zhang, Ning, Xiao, Zhang, Chang and Zhi42 with multi-walled carbon nanotubes (MWNTs), which were reported to possess the best electrochemical cycling performance among different types of CNTs, Reference Chew, Ng, Wang, Novák, Krumeich, Chou, Chen and Liu30 to function as anodes for high-capacity and high-energy LIBs. This is a report on our preparation of a lightweight freestanding flexible Si nanoparticle–multi-walled carbon nanotube (Si–MW) composite paper anode for LIBs using ultrasonication and positive-pressure filtration. The electrochemical performances of the electrode materials at an areal mass loading of 3 mg/cm2 were investigated using half-cell configuration for up to 500 cycles. The binder-free Si–MW composite showed specific capacities much higher than the commercial graphite anodes. The optimal combination of the high capacity of SiNPs and the high electrical conductivity and structural stabilization quality of MWNTs was found in the samples with the Si/CNT ratio of 3:2. These samples demonstrated superior cycle performance and high rate capability due to the well-balanced composite structure.
II. EXPERIMENTAL
A. Materials and electrode preparation
The SiNPs, purchased from Alfa Aesar (Tewksbury, Massachusetts), were crystalline and were of an average particle size ≤50 nm and purity of 98%. The MWNTs were SMW200 from SouthWest NanoTechnologies (Norman, Oklahoma), with a median outer diameter of 10 nm, median inner diameter of 4.5 nm, length of ∼4 μm, and carbon content ≥98%. All materials were used as received.
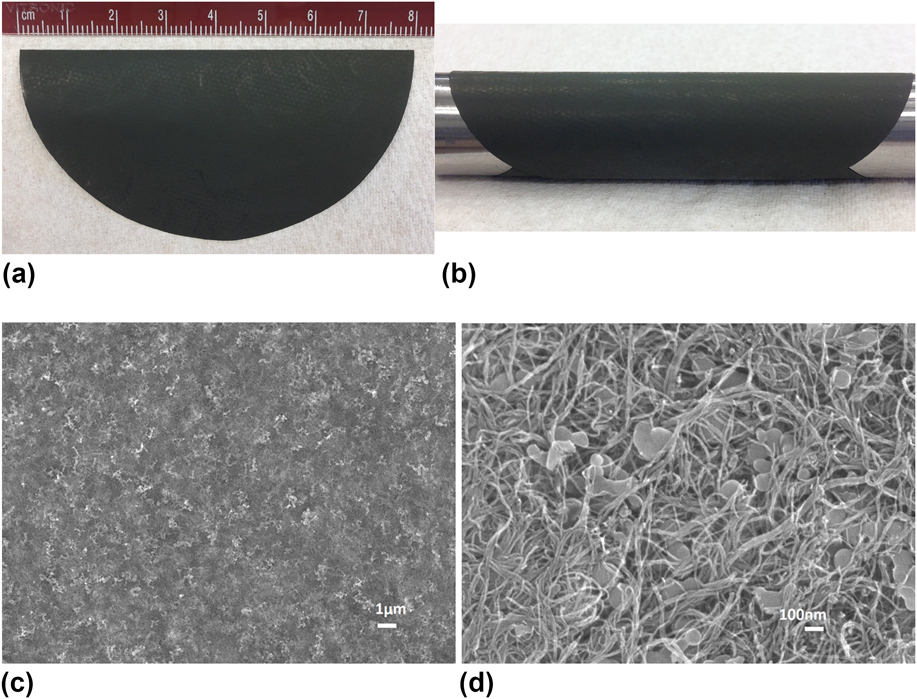
The detailed preparation of the Si–MW composite paper was reported elsewhere. Reference Yao, Liang and Zheng47 Briefly, SiNPs and MWNTs at a given mass ratio were dispersed in 1 vol% deionized (DI) water solution of Triton X-100 surfactant (Alfa Aesar, Tewksbury, Massachusetts) through ultrasonic agitation using a probe sonicator. A filtration process under positive pressure on the resultant dispersion was conducted using a 0.4-μm-pore-size polycarbonate (PC) membrane. During filtration, the MWNTs and SiNPs were deposited onto the membrane surface to generate a dark green composite thin film. Upon natural drying overnight, the thin film could be peeled off from the PC membrane, creating a freestanding Si–MW composite paper. To remove the residual surfactant, the composite paper was washed with DI water, isopropyl alcohol, and DI water sequentially, followed by heat treatment at 500 °C in a nitrogen gas atmosphere for 1 h. Figure 1(a) is a photograph of the as-prepared composite paper with a diameter of 8 cm indicating the scalability of our approach. Figure 1(b) shows the freestanding sheet of paper wrapped around an 18-mm-diameter rod to demonstrate its high flexibility.
(a) Si–MW 1:1 paper with a diameter of 8 cm, (b) the freestanding composite paper wrapped around an 18-mm-diameter rod demonstrating its high flexibility, (c) low- and (d) high-magnification SEM images of the Si–MW 1:1 composite paper.

B. Coin cell fabrication
Prior to coin cell assembly, the freestanding composite paper was cut into circular electrode sheets using half-inch punch and then dried at 120 °C in vacuum overnight to make a working electrode without any additives or Cu current collector. The CR2032-type coin cell was used for the battery performance test. A Li metal foil was used as the reference and counter electrode, and a glass fiber separator (EL-CELL) was placed in between the electrodes. The electrolyte, purchased from BASF Corporation, was 1 M lithium hexafluorophosphate (LiPF6) in ethylene carbonate:diethyl carbonate:fluoroethylene carbonate (EC:DEC:FEC) at a weight ratio of 45:45:10. The construction of the cells was carried out in a glove box filled with argon gas.
C. Characterization
The microstructural image analysis was conducted with a JSM-7401F field emission scanning electron microscope (JEOL, Peabody, Massachusetts). The composite materials were characterized using an X-ray diffractometer (Bruker AXS Inc., Madison, Wisconsin) with Cu Kα radiation (45 kV, 650 μA). Raman spectroscopy was conducted with an inVia Raman microscope with 785-nm laser (Renishaw, West Dundee, Illinois). The elemental composition of the prepared composite was examined quantitatively by energy-dispersive X-ray spectroscopy (EDX) integrated with SEM.
The galvanostatic charge–discharge cycling performance was tested using MTI Battery Analyzer systems in a voltage range of 1–0.005 V versus Li/Li+. Cyclic voltammetry (CV) was conducted from 2 to 0.005 V versus Li/Li+ at a scan rate of 0.1 mV/s using Gamry Instruments (Warminster, Pennsylvania). Electrochemical impedance spectroscopy (EIS) was performed at an AC voltage amplitude of 10 mV in a frequency range of 0.1–106 Hz using Gamry Instruments on the cells before (2.8 V versus Li/Li+) and after cycling (0.5 V versus Li/Li+). All the specific capacity values are based on the total weight of SiNPs and MWNTs in the composite electrodes.
III. RESULTS AND DISCUSSION
A. Structural and compositional analyses
The microstructure and the interactions between constituting materials within the composite were investigated by SEM. The low- and high-magnification SEM images of the as-prepared composite paper with the Si/CNT mass ratio of 1:1 (denoted as Si–MW 1:1) are shown in Fig. 1. In Fig. 1(c), the SiNPs are seen to be distributed uniformly throughout the entire MWNT matrix, which suggests that sonication is an effective method to disperse the CNTs and the SiNPs evenly in an environmentally benign aqueous solution with the aid of a surfactant. The high-magnification SEM image, Fig. 1(d), clearly displays the dense three-dimensional (3D) network formed by curved CNTs. The Si particles, which were less than 100 nm in size, were attached to the surface of CNTs and embedded into the conductive network without signs of agglomeration. With the CNT bundles bridging the particles and holding them together, good electrical contact within the structure can be expected.
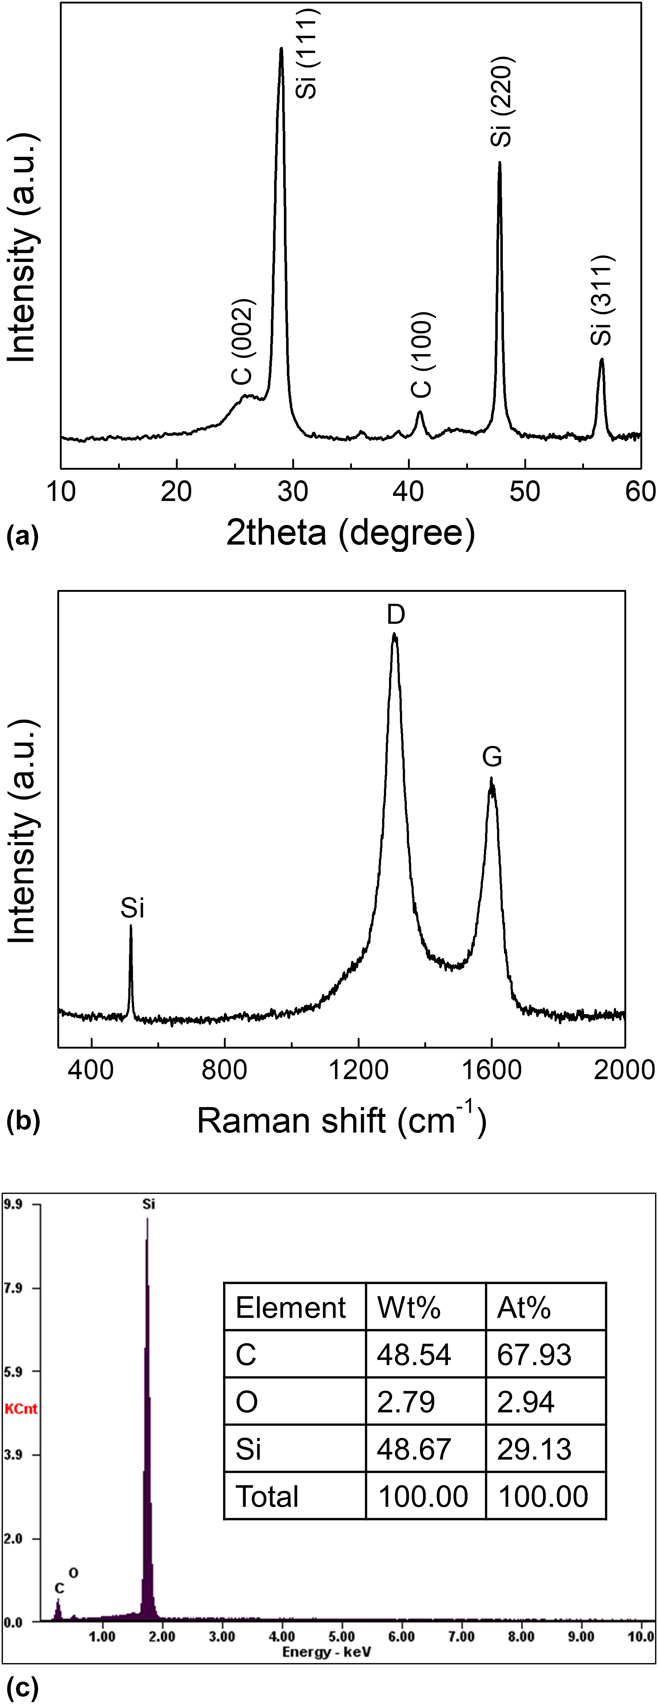
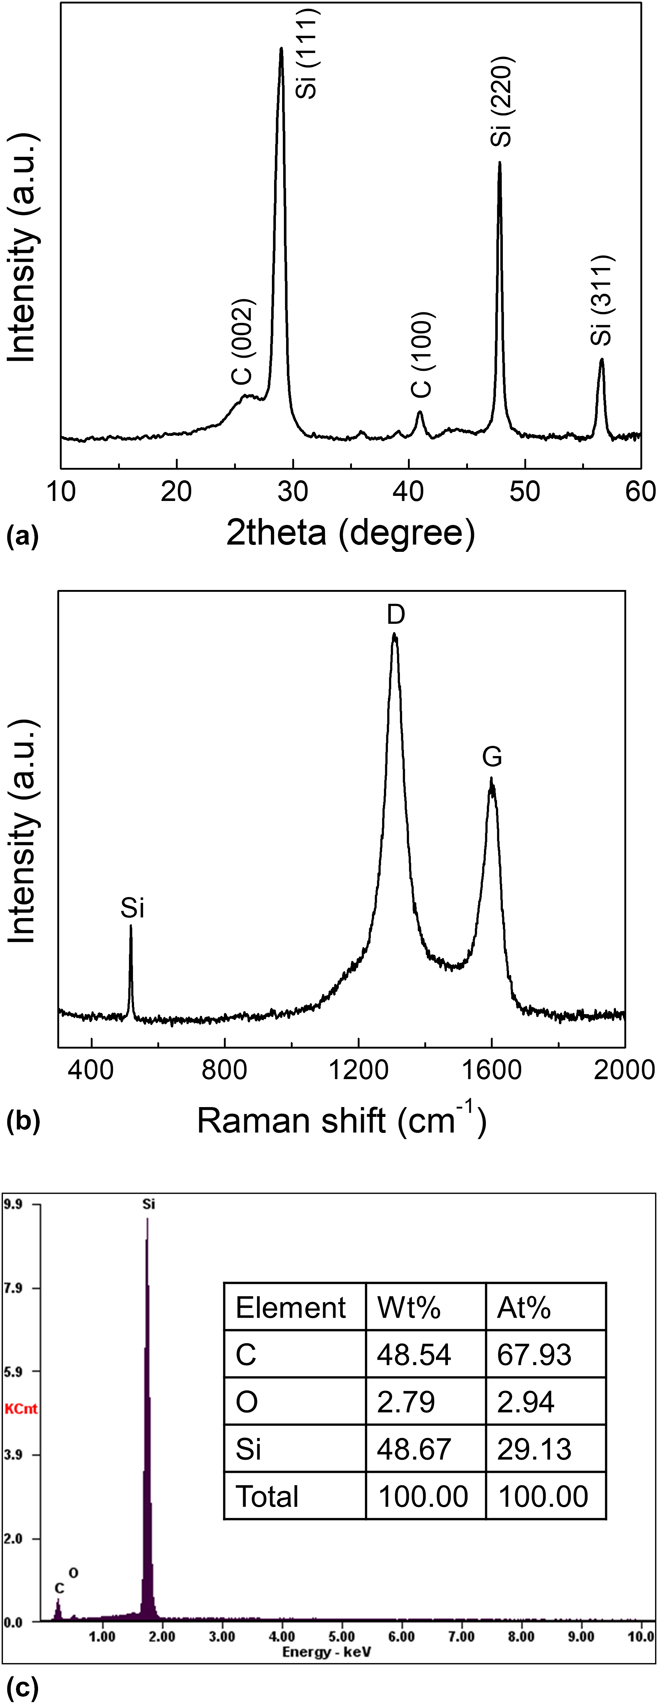
Figure 2(a) illustrates the XRD pattern for the Si–MW 1:1 composite paper. The composite exhibited a crystalline Si structure with characteristic peaks assigned to the (111), (220), and (311) plane reflections of Si in addition to the typical peaks of the (002) and (100) reflections for MWNTs. The Raman spectrum for the Si–MW 1:1 composite in Fig. 2(b) presents features of two broad peaks centered at 1309 cm−1 and 1598 cm−1, which are related to disordered carbon (D band, representing the vibration induced by carbon atoms with dangling bonds at edges and defects of the graphitic lattice) and ordered carbon (G band, originating from the vibration of sp 2-bonded carbon atoms in the hexagonal graphene plane), Reference Chew, Ng, Wang, Novák, Krumeich, Chou, Chen and Liu30 respectively, as well as a sharp peak at 518 cm−1, which corresponds to Si. The composite composition was further verified by EDX elemental analysis, as shown in Fig. 2(c). Two notable peaks of C and Si were observed in the EDX spectrum. Other than the small amount of O, which is attributed to the native layer consisting of silicon oxide (–Si–O–Si–) and silanol group (–Si–OH) Reference Choi, Yew, Lee, Sung, Kim and Kim48,Reference Wu and Bennett49 on the surface of Si material, the Si to C weight ratio was very close to 1, which was in good agreement with the experimental expectation value.
(a) XRD pattern, (b) Raman spectrum, and (c) EDX spectrum with elemental analysis for the Si–MW 1:1 composite paper.
B. Electrochemical properties
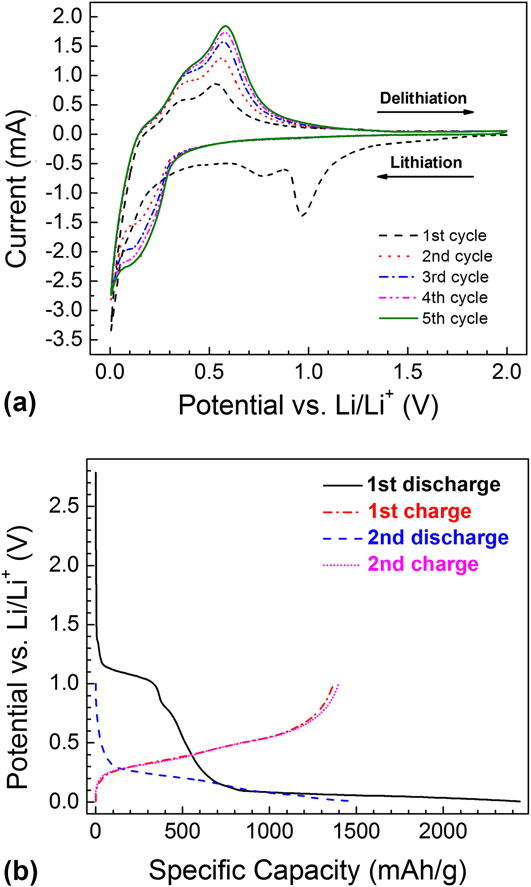
The Si–MW 1:1 composite was assembled into CR2032-type coin cells against Li metal counter and reference electrode. CV was carried out at a scan rate of 0.1 mV/s from 2 to 0.005 V versus Li/Li+, and galvanostatic cycling was performed in a voltage range of 1–0.005 V versus Li/Li+ under a constant current of 1 mA (280 mA/g). Figure 3(a) shows the initial five consecutive CV curves. In the first cycle, the cathodic (lithiation) peak at about 1 V versus Li/Li+ was due to the reduction of FEC additive in the electrolyte, Reference Wang, Xu, Yao, Yao and Yang50 and the broad cathodic peak located around 0.7–0.8 V versus Li/Li+ was related to the decomposition of other electrolyte solvents, contributing to the formation of a solid electrolyte interphase (SEI) layer. Both of these peaks were indiscernible in the subsequent cycles, suggesting that SEI formation takes place mostly during the first cycle, and that these initial reactions are irreversible. Reference Favors, Wang, Bay, George, Ozkan and Ozkan51 The peak at ∼0.1 V versus Li/Li+ in the cathodic branch in the first cycle corresponds to conversion of crystalline Si to amorphous Si, while the cathodic peak in the second to fifth cycles at approximately 0.2 V versus Li/Li+ is attributed to Li insertion into amorphous Si forming amorphous Li x Si (a-Li x Si). This agrees with the previous literature that lithiation of crystalline Si occurs at 0.125 V versus Li/Li+, whereas lithiation of amorphous Si occurs at higher potentials (∼0.22 V versus Li/Li+). Reference Chan, Patel, O’Connell, Korgel and Cui5 All anodic (delithiation) curves showed two broad peaks at 0.3–0.4 and 0.5–0.6 V versus Li/Li+ which are characteristic of Li extraction from a-Li x Si. The formation of the Li15Si4 phase at 50 mV during the first lithiation cycle has been reported. Reference Obrovac and Christensen52–Reference Li and Dahn54 However, this phase was not observed from this CV study, similar to other studies proposing that crystalline Li15Si4 was only observed when dealing with large particles or thick films, whereas nanosized Si or thin-film Si was more likely to be lithiated into amorphous Li x Si alloy. Reference Hatchard and Dahn55,Reference Saint, Morcrette, Larcher, Laffont, Beattie, Pérès, Talaga, Couzi and Tarascon56
(a) Initial five cyclic voltammograms at 0.1 mV/s and (b) first and second cycle voltage profiles of the Si–MW 1:1 composite anode.

The charge–discharge profiles in Fig. 3(b) were in good agreement with the CV curves. The lithiation/delithiation curves had slight stepwise slopes. The absence of very flat plateau supports the previous discussion that the formation of a-Li x Si alloy and its delithiation were dominant rather than those of crystalline Li15Si4. Reference Iwamura, Nishihara and Kyotani15,Reference Obrovac and Christensen52,Reference Obrovac and Krause53 The first discharge (Li insertion) capacity was 2440 mA h/g based on weight of the Si–MW 1:1 composite, while the first charge (Li extraction) capacity was 1368 mA h/g, which yielded a first cycle coulombic efficiency of 56%. Such high irreversible capacity loss and low initial coulombic efficiency are often associated with increased SEI formation on the first cycle of nanostructured materials with the high surface area. The slopes related to SEI layer formation disappeared from the second discharge curve in Fig. 3(b), resulting in considerably improved second cycle coulombic efficiency. The second discharge capacity was 1487 mA h/g, the second charge capacity was 1398 mA h/g, and the coulombic efficiency increased significantly to 94%. The slightly increased second charge capacity compared with first cycle has been reported to be the outcome of the activation of crystalline Si as it becomes amorphous during cycling because higher Li mobility in amorphous Si allows insertion of Li into larger portions of the electrode as cycling progresses. Reference Szczech and Jin1 The Si–MW sample obviously delivered specific capacity much higher than commercial graphite anodes.
C. Control of Si/CNT mass ratio in the composite anodes
To examine the influence of the Si/CNT ratio on the anode performance and to find the optimal combination, the Si/CNT ratio was controlled for comparative study by changing the mass ratio of SiNPs to MWNTs when preparing the dispersion solutions. The Si/CNT ratios in the prepared composites were 2:3, 1:1, 3:2, 2:1, and 3:1. The Si–MW 2:1 sheets lost some flexibility compared with Si–MW 2:3, Si–MW 1:1, and Si–MW 3:2 samples with higher CNT contents, whereas the Si–MW 3:1 sheets were the most difficult to handle when peeled off from the filter membrane. Further increasing the Si content resulted in a filter cake which was brittle and tended to crack during peeling, and an intact freestanding sheet could not be produced. The obtained samples were assembled into CR2032-type coin cells against Li counter and reference electrodes. Galvanostatic cycling was performed between 1 and 0.005 V versus Li/Li+ under a constant current of 1 mA. EIS on the fresh and cycled cells was conducted in a frequency range of 0.1–106 Hz.
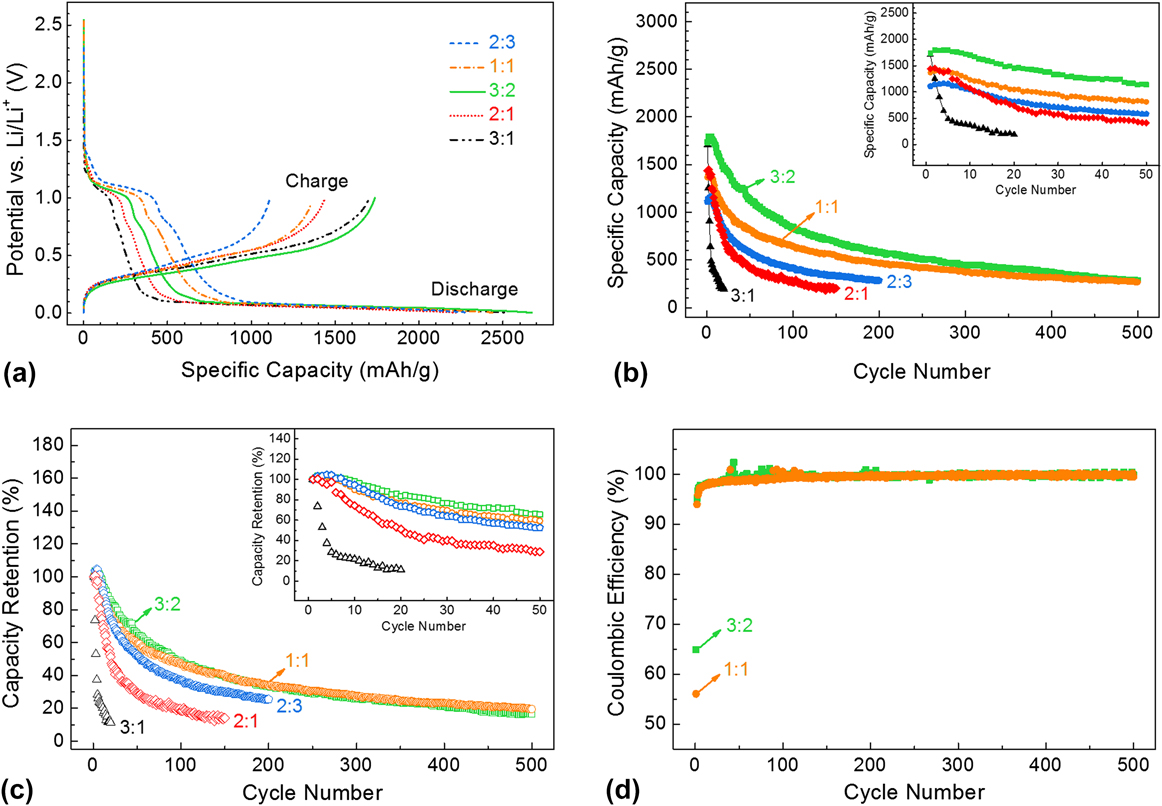
Figure 4(a) plots the initial charge–discharge curves of cells containing Si–MW electrodes with varying Si/CNT ratios, while Table I lists the specific discharge and charge capacities and coulombic efficiency at 1st, 2nd, 10th, and 100th cycles. The initial discharge/charge capacity and the initial coulombic efficiency were 2289/1111 mA h/g and 48.5%, respectively, for the sample with the lowest Si content (Si–MW 2:3). These values all increased as the Si/CNT ratio increased to 1:1 and 3:2 owing to the contribution from the higher content of Si, with the Si–MW 3:2 sample achieving the highest discharge/charge capacity of 2673/1736 mA h/g and coulombic efficiency of 64.9%. However, as the Si/CNT ratio increased to 2:1, the capacities and efficiency ceased increasing but rather began to drop. Theoretically, the higher the Si content, the higher the capacity. Our experimental results appear contradictory to this rule. However, the less satisfying performance of the Si–MW 2:1 electrode is explainable in that the material appears less flexible and more fragile than those having higher CNT contents. The electrode is probably less robust and more prone to fractures upon cycling due to lack of the CNT backbone structure since the amount of CNTs was not sufficient to provide adequate support. In the case of the Si–MW 3:1 samples, the capacities and efficiency gained some strength but only at the very beginning. This is because between the two competing factors, i.e., high capacity which stems from high Si content and poor capacity caused by structural instability due to low CNT content, the former came out on top for the competition for the initial cycle. However, afterward, the latter became dominant due to the very low CNT content and the electrode rapidly decayed, with only 371 mA h/g charge capacity left at 10th cycle. Of all the performance parameters considered for the five samples, the Si–MW 3:2 combination demonstrated maximum overall discharge/charge capacity and coulombic efficiency, while the Si–MW 1:1 was the runner-up. After 100 cycles, relatively high reversible capacities of 849 and 649 mA h/g could still be obtained for Si–MW 3:2 and Si–MW 1:1 composites, respectively, with coulombic efficiencies close to 100%.
(a) Initial charge–discharge curves of Si–MW with varying Si/CNT weight ratios of 3:1, 2:1, 3:2, 1:1, and 2:3; (b) reversible capacity, (c) capacity retention, and (d) coulombic efficiency versus the cycle number of Si–MW cells with varying Si/CNT ratios. Insets in (b) and (c) show first 50 cycles.

Specific capacities and coulombic efficiency of Si–MW electrodes with varying Si/CNT ratios at 1st, 2nd, 10th, and 100th cycles.

Figures 4(b) and 4(c) show the cycle performance for all the five compositions, where the reversible capacity and capacity retention, respectively, are plotted against the cycle number. The corresponding insets are close-ups showing the first 50 cycles, except for the Si/CNT ratio of 3:1. The Si–MW 3:1 and Si–MW 2:1 electrodes were tested for 20 and 150 cycles, respectively, before their capacities dropped to ∼200 mA h/g. The Si–MW 2:3, Si–MW 1:1, and Si–MW 3:2 samples were discharged/charged for 200, 500, and 500 cycles, respectively. The cycle life first improved by increasing the Si/CNT ratio from 2:3 to 1:1 to 3:2, then became worse when the Si/CNT ratio increased to 2:1 and 3:1. The poor cycle performance of Si–MW 3:1 and Si–MW 2:1 samples indicates that the high Si content is not beneficial for long-term cycling due to the large intrinsic volumetric change of Si itself during charge–discharge and that the structural instability stemming from low CNT content is the major factor that determines their cycling stability.
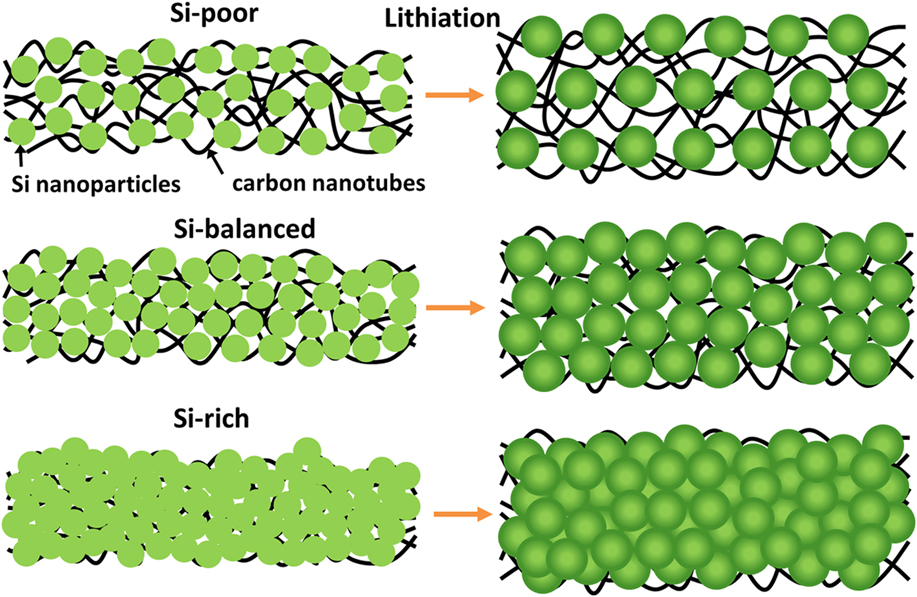
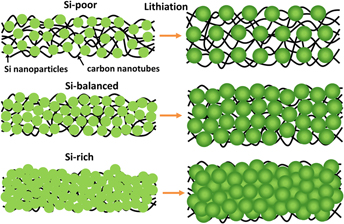
In contrast, Si–MW 3:2 and Si–MW 1:1 samples exhibited much slower capacity fading and much better cycle life performance. A reversible capacity of around 300, 500, and 1000 mA h/g was retained for 450, 180, and 25 cycles, respectively, for the Si–MW 1:1 electrode, and was retained for 480, 270, and 70 cycles, respectively, for the Si–MW 3:2 electrode. The recently reported Si-rich carbon hybrid nanofibers maintained 1076 mA h/g capacity after 50 cycles at 0.1C rate, Reference Kim, Kim, Cho, Hansen, Lee and Joo19 and the nano-Si/graphene nanosheet composite attained a stable reversible capacity of 976 mA h/g after 50 cycles at a current rate of 50 mA/g. Reference Sun, Hu, Liu, Zeng, Yang, Wang and Zhu20 In this regard, our Si–MW 3:2 composite was superior to these Si-incorporated structures even though it was free of binder and current collector and it was cycled at a higher current rate of 280 mA/g. Although the Si–MW 3:2 excelled in overall specific capacity, the Si–MW 1:1 showed comparable capacity retention during the 500-cycle test as shown in Fig. 4(c). Since the Si/CNT ratios of 3:2 and 1:1 are the subjects of interest now, they are compared in Fig. 4(d) in terms of coulombic efficiency. In general, both demonstrated outstanding coulombic efficiencies of around 99–100% throughout the 500 cycles, except for a few cycles at the beginning of the test. Our Si/CNT ratio study suggests that for SiNPs and CNTs both having their strengths and weaknesses as electrode materials, an optimal combination exists that could produce a cooperative or even synergistic effect. This phenomenon is illustrated in the schematic drawing of the composite structures before and after lithiation for three representative Si/CNT ratio scenarios in Fig. 5: Si-poor (such as 2:3), Si-balanced (such as 3:2), and Si-rich (such as 3:1). Only when Si and CNTs were formed into the well-balanced structure can the volumetric expansion of Si particles during alloying be accommodated and the interparticle electrical contact be maintained. (This is inversion after "Only When" and the second "can" is omitted.) As a result, the integrity of the electrode was largely preserved, which resulted in the superior electrochemical cycling performance.
Schematic visualization of the composite structures before and after lithiation for three representative Si/CNT ratio scenarios: Si-poor (2:3), Si-balanced (3:2), and Si-rich (3:1).

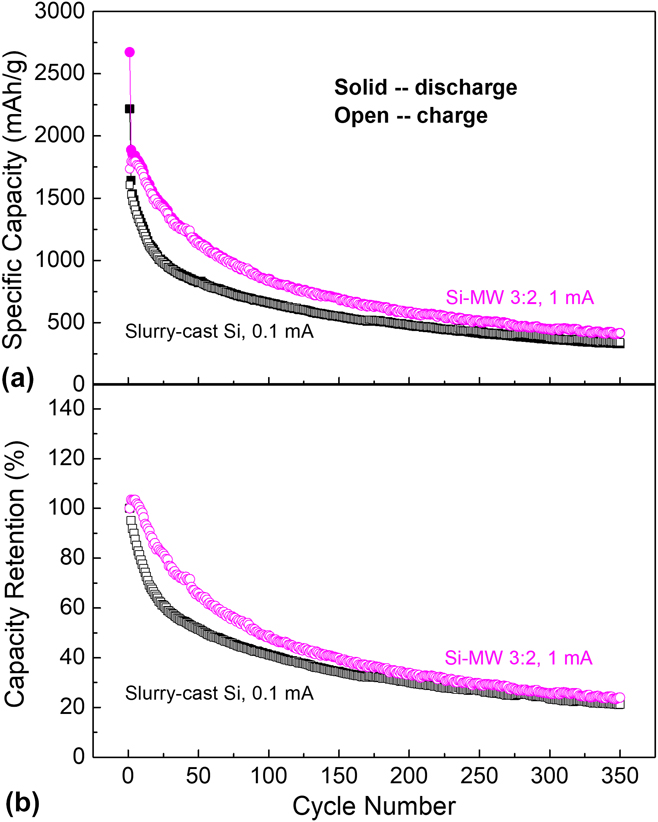
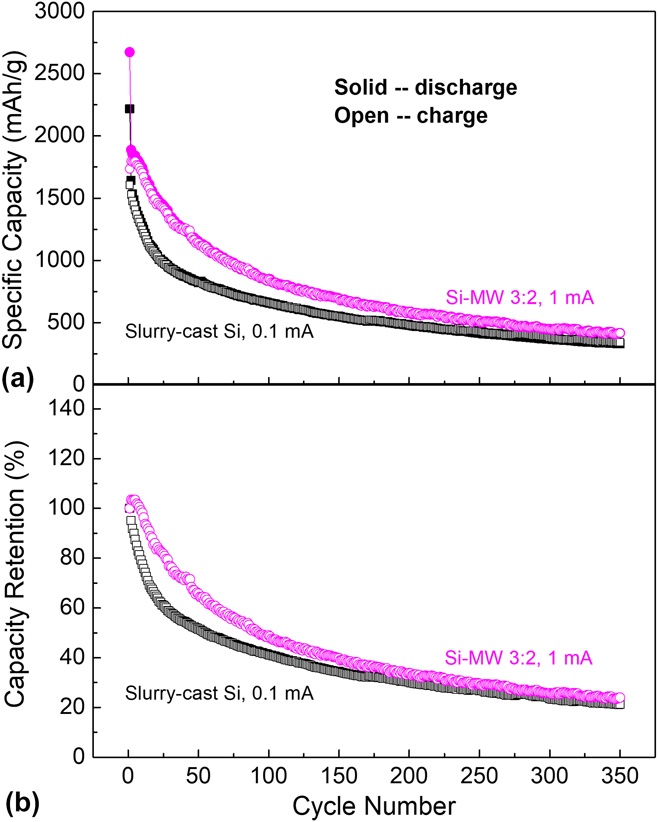
The Si–MW 3:2 electrode was further compared with SiNP-based electrode made by conventional slurry casting method. The electrode slurry was composed of SiNPs, binders, and conductive additives at a weight ratio of 80:10:10 dissolved in water as the solvent. The binder was Dow’s CMC (WALOCEL CRT 2000 PA). The conductive additive consisted of Super C65 carbon black (Imerys Graphite & Carbon) and SFG 6L graphite (Imerys Graphite & Carbon) at a weight ratio of 1:1. The slurry was coated on 15-μm-thick Cu foil using the doctor blade method. The Si-loaded Cu foil was dried at 80 °C overnight and roll-pressed to give an electrode sheet with a total thickness of 18 μm. Half-inch electrodes were then punched from the foil, assembled into CR2032-type coin cells, and galvanostatically cycled in a voltage range of 1–0.005 V versus Li/Li+ under 0.1 mA (170 mA/g). Figure 6 shows the discharge/charge capacities and charge capacity retention versus the cycle number of Si–MW 3:2 and slurry-cast SiNP electrodes. The specific capacity of the slurry-cast electrode was based only on the weight of the coating, excluding the Cu current collector. The Si–MW 3:2 electrode outperformed the slurry-cast SiNP electrode in terms of both specific capacities and reversible capacity retention. The SiNP cell had first discharge and charge capacities of 2218 and 1607 mA h/g, respectively, which were lower than Si–MW 3:2 cell’s 2673 and 1736 mA h/g, respectively, and showed lower capacity and faster capacity fading throughout the whole cycling process, even though it was tested under a lower current rate. The capacity retentions after 10, 50, and 100 cycles were 77%, 51%, and 41%, respectively, for the SiNP cell and 98%, 66%, and 49%, respectively, for the Si–MW 3:2 cell. The poor performance of the pure Si electrode without any supporting matrix was apparently caused by active material destruction upon lithiation and delithiation due to the intrinsic nature of the Si material. This, on the other hand, reflects the positive role that the CNTs play in our composite electrode.
(a) Discharge/charge capacities and (b) charge capacity retention versus the cycle number of Si–MW 3:2 and slurry-cast SiNPs.
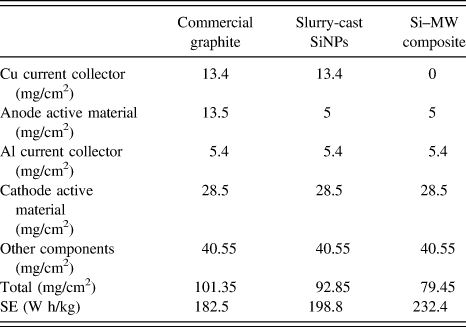
Furthermore, the absence of the metal current collector drastically improved SE in a full-cell configuration. Table II lists detailed information on mass of each component and calculated SE for commercial graphite, slurry-cast SiNPs, and Si–MW composite. The data for commercial graphite were found in the literature. Reference Choi, Hu, Cui, McDonough and Cui10 The SE was calculated according to Eq. (1):
 $${\rm{SE}} = {{{C_{\rm{A}}} \times {C_{\rm{C}}}} \over {{C_{\rm{A}}} + {C_{\rm{C}}}}} \times V \times {{{m_{\rm{A}}} + {m_{\rm{C}}}} \over {{m_{{\rm{all}}}}}}\quad ,$$
where C A is the anode capacity, C C the cathode capacity, V the operation voltage in a full cell, m A the mass of anode material, m C the mass of cathode material, and m all the mass of all cell components (including current collector, separator, packaging, etc.). C A for graphite and Si was set to 370 and 1000 mA h/g, respectively, C C was set to 175 mA h/g, and V was set to 3.7 V. When the mass of other components was assumed to be fixed for a full cell with a typical commercial areal capacity value of 4 mA h/cm2, the calculated SE of SiNP cell was 198.8 W h/kg, which was a 9% improvement compared with 182.5 W h/kg for graphite owing to the high capacity of Si and thus the lower mass loading of the anode active material. In the case of the Si–MW cell, the calculated SE was further increased to 232.4 W h/kg. This 27% improvement compared with graphite resulted from both the high capacity (lower active material loading) and the elimination of heavy current collector on the anode side.
Mass of each component and calculated SE for commercial graphite, slurry-cast SiNPs, and Si–MW composites in full-cell configuration with an areal capacity of 4 mA h/cm2.

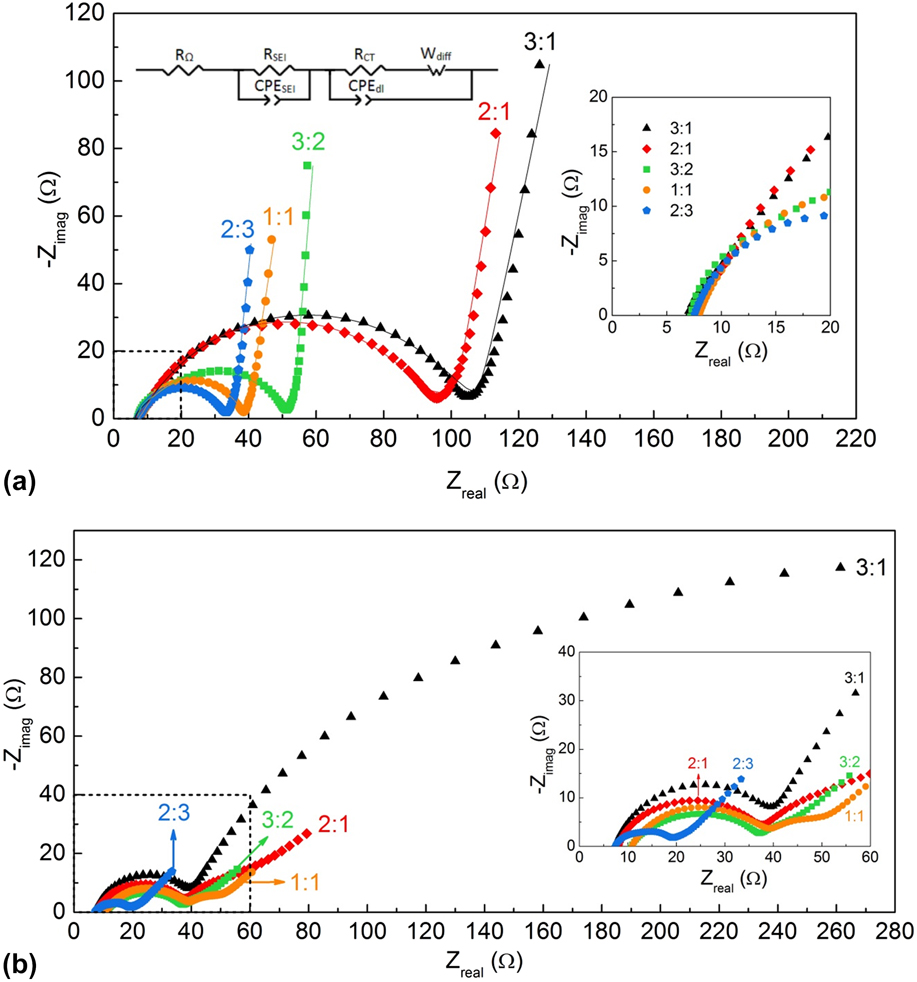
Figure 7 shows the Nyquist plots of fresh and cycled Si–MW cells with varying Si/CNT ratios, together with the equivalent circuit model for EIS spectra fitting. Because the semicircles were depressed, constant phase element (CPE) was used to replace double layer capacitance in the equivalent circuit. The complex impedance of a CPE, Z CPE, is expressed by:
 $${Z_{{\rm{CPE}}}} = {1 \over {T{{\left( {j\omega } \right)}^P}}}\quad ,$$
where T represents the pseudocapacitance that is modified by the electrode geometry, j is an imaginary number, and P is an exponential parameter that expresses the electrode geometry as a number. Finally, ω = 2πf is the angular frequency and f is the frequency of the applied AC signal. Reference Nakahara, Yoon and Nutt57 The equivalent circuit Reference Chen, Wang, Xie and Xie58 comprises an R Ω, representing the sum of the electronic resistance from the electrode material, separator, and contacts and the ionic resistance of the electrolyte; an R SEI-CPESEI parallel circuit where R SEI is the resistance for Li+ conduction in the SEI layer and CPESEI describes the space charge capacitance of the SEI layer; and a parallel circuit of R CT and CPEdl, which represents charge transfer resistance and double layer capacitance at the electrode surface, respectively, with Wdiff (Warburg impedance) connected in series to R CT. The quality of fitting for fresh cells is well demonstrated by the fitted curves (solid lines) in Fig. 7(a). Table SI provides the fitted parameters of Si–MW fresh cells with varying Si/CNT ratios.
Nyquist plots of Si–MW cells with varying Si/CNT ratios (a) before (2.8 V versus Li/Li+) and (b) after cycling (0.5 V versus Li/Li+), along with the equivalent circuit used for fitting (Reprinted from Ref. Reference Chen, Wang, Xie and Xie58 with permission from Elsevier). The Si–MW 3:1 and Si–MW 2:1 electrodes were tested for 20 and 150 cycles, respectively, before their capacities dropped to ∼200 mA h/g. The Si–MW 2:3, Si–MW 1:1, and Si–MW 3:2 samples were discharged/charged for 200, 500, and 500 cycles, respectively. The solid lines in (a) are fitted curves from the equivalent circuit. Insets are zoomed-in views of the square parts in (a) and (b), respectively, before and after cycling.

For the fresh cells, Fig. 7(a) shows that their intercepts at the real axis at high-frequency end of the complex plot were very close, and the diameter of the semicircles decreased gradually as more CNTs were put into the electrode constitution. The decrease of the semicircle diameter was mainly ascribed to the decrease of the interparticle contact resistance, resulting from the integrity preservation of the conductive network. Reference Guo, Zhao, Liu and Dou59,Reference Zhang, Zhang, Zhang, Zhao, Li, Liu and Cheng60 This is further evidenced by the fitted data. R CT was the highest (97.07 Ω) for the Si–MW 3:1 sample, which had the highest Si content. The R CT value was cut by half for Si–MW 3:2 (42.31 Ω) and was quartered when the Si/CNT ratio was 2:3 (24.06 Ω). This is reasonable because of the low conductivity of the Si material. The addition of CNTs undoubtedly benefits the electrical conductivity by the high conductivity of CNTs themselves as well as the improvement of Si–Si particle contacts through CNT bridging. Since low R CT is indicative of the ease of interfacial charge transfer between the electrode and surface film, the EIS data was in good agreement with the previous electrochemical cycling data in that the Si–MW 1:1 and Si–MW 3:2 cells performed much better than the Si–MW 2:1 and Si–MW 3:1 cells for long-term cycling. This further verified that the good conductivity of and the structural preservation by CNTs contributed to the improvement of cyclability.
However, the Si–MW 2:3 cell with the lowest R CT did not show the best performance because of the low content of the Si active material in the composite. The high content of CNTs could also be a reason since the CNTs with a high surface area are prone to irreversible Li insertion and growth of the SEI film, as shown in Fig. 4(a) and Table I, where the Si–MW 2:3 sample was found to have the lowest initial coulombic efficiency. As a result, the Si–MW 2:3 cell demonstrated faster capacity fading than the Si–MW 1:1 and Si–MW 3:2 cells, even though it has the highest amount of CNTs as the supporting structure.
For the cycled cells in Fig. 7(b), the EIS spectra appeared very different and more complicated and could not be modeled through one uniform equivalent circuit. Nevertheless, several points could be drawn from the comparison. First, the diameter of the semicircles at the high-frequency end generally decreased after cycling due to the breakdown of the nonconductive native layer on the surface of Si. Second, the low-frequency features looked quite different than those before cycling. While the steep slope lines in the low-frequency region for fresh cells indicate capacitive behavior which is attributed to both Warburg impedance and insertion capacitance, the low-frequency domain in the case of cycled cells was dominated by the typical characteristics of the Warburg impedance (45°), and the spectral response was similar to the semi-infinite diffusion process of Li ions within the bulk electrode. Reference Dokko, Fujita, Mohamedi, Umeda, Uchida and Selman61 The prolonged tail of the Si–MW 3:1 cell was in agreement with its rapid failure after only 20 cycles as seen in Figs. 4(b) and 4(c). Third, the intercepts at the real axis of cycled Si–MW 1:1 and Si–MW 3:2 cells were larger than those of other cycled cells. This is understandable considering that they were discharged/charged for 500 cycles, which would generate more SEI and lead to an impedance increase. However, their charge transfer resistance remained relatively small, indicating good Li insertion–extraction kinetics, Reference Wu and Bennett49 which may explain their better cycling performance.
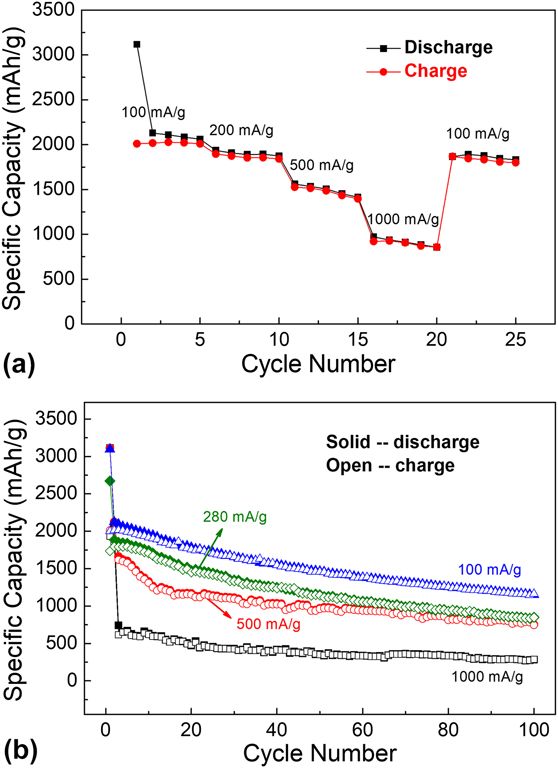
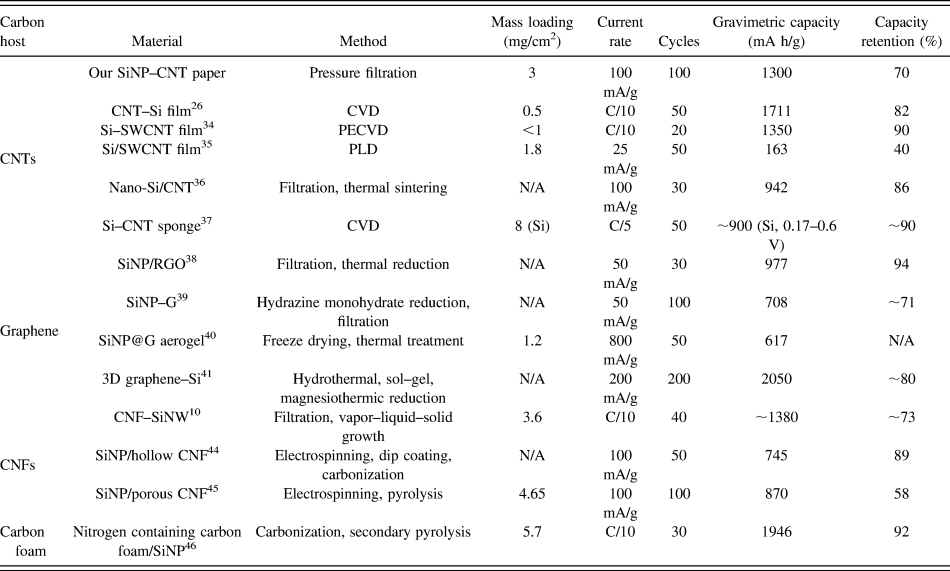
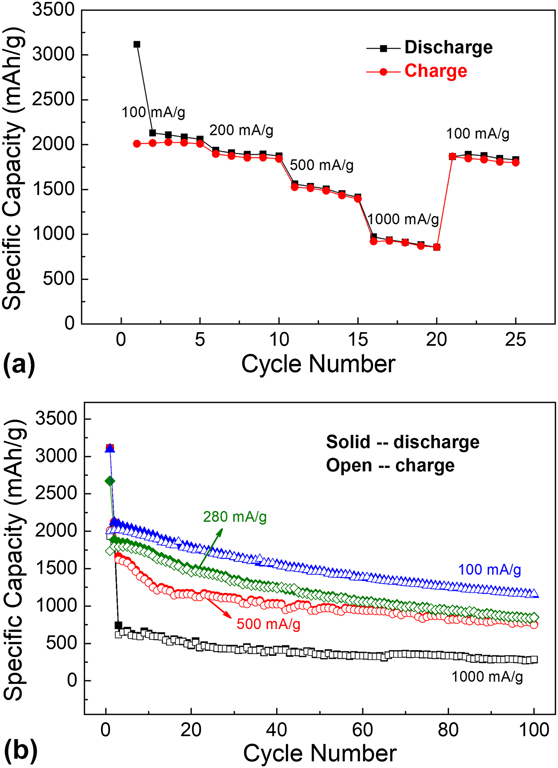
The rate capability of the composite electrode with the optimal Si/CNT ratio of 3:2 was measured from the current rate of 100 mA/g up to 1000 mA/g and is displayed in Fig. 8(a). The average discharge capacities at current rates of 100, 200, 500, and 1000 mA/g were 2299, 1899, 1492, and 912 mA h/g, respectively, and the corresponding average charge capacities were 2017, 1863, 1470, and 896 mA h/g, respectively, all of which were much higher than those of graphite (372 mA h/g) used in current LIBs. The reversible capacity could be recovered to 1866 mA h/g when the current rate returned to 100 mA/g. To further investigate the cycle performance, the Si–MW 3:2 composite anodes were subjected to long-term cycling at low to high current rates (100, 280, 500, and 1000 mA/g). For the high current rates (500 and 1000 mA/g), initial two conditioning cycles at 100 mA/g were performed. Figure 8(b) plots the specific capacities as a function of the cycle number. A significant improvement was seen in cyclability with higher capacity at the lower current rate. The cell tested at a current rate of 100 mA/g exhibited a first discharge/charge capacity of 3096/2001 mA h/g compared with 2673/1736 mA h/g of the cell cycled at 280 mA/g and managed to retain a reversible capacity of 1170 mA h/g after 100 cycles. As the current rate increased to 280 and 500 mA/g, after 100 cycles, the electrode was still able to deliver reversible capacities of 850 and 750 mA h/g, respectively. Moreover, use of a different electrolyte composition enabled a reversible capacity of 1300 mA h/g at 100 mA/g after 100 cycles for Si–MW 3:2, which will be published separately. These were better than the values on Si-based composite anode materials with conventional binder and metal current collector Reference Kim, Kim, Cho, Hansen, Lee and Joo19,Reference Sun, Hu, Liu, Zeng, Yang, Wang and Zhu20 as well as some other freestanding Si/carbon (C) architectures described in the recently published literature. Table III compares the characteristics of SiNP–CNT paper reported in the present work with other freestanding Si/C composite anodes based on CNTs, graphene, CNFs, and carbon foam. Our composite anodes exhibited superior performance in terms of mass loading, specific capacity, cycling stability, and capacity retention, along with the simplicity of fabrication process and good scalability. The high rate capability and good cycling stability of the Si–MW 3:2 composite are attributed to the enhanced conductivity and structural stability of the electrodes because the SiNPs were embedded in the highly conductive and strong CNT matrix. Besides, the freestanding feature of our electrodes eliminates the nonactive mass, which is promising for enhanced energy density of Li-ion cells.
(a) Rate capability and (b) cycle performance of Si–MW 3:2 composite anodes. In (b), initial two conditioning cycles at 100 mA/g were performed for cycling at high current rates (500 and 1000 mA/g).
Comparison of the characteristics of SiNP–CNT paper reported in the present work with other related freestanding Si/C composite anodes based on CNTs, graphene, CNFs, and carbon foam.

IV. CONCLUSIONS
In summary, binder-free freestanding flexible lightweight Si–MW composite paper anodes with easy-to-control composition and a relatively high areal mass loading of 3 mg/cm2 for LIBs were prepared by tip sonication and positive-pressure filtration. We directly use the commercially available raw materials (SiNPs and CNTs), and the process is simple and easily scalable since no complex equipment/procedure or hazardous acid/gas is involved. The 3D network of MWNTs formed a continuous conductive pathway within the composite structure, which ensured sufficient electrical conductivity, held the particles together, and mitigated the volume expansion of Si. By controlling the Si/CNT ratio, an optimal balance between the high capacity of Si and the high conductivity and structural stabilization quality of MWNTs could be found for the Si–MW 3:2 composite. The Si–MW 3:2 electrode presented the highest specific capacity, best capacity retention, and high coulombic efficiency throughout the 500-cycle test. The anode also demonstrated a high rate capability. During cycling under the current rate from 100 to 1000 mA/g, the reversible capacity could be recovered to 1866 mA h/g when the current rate returned to 100 mA/g. After 100 cycles, the electrode retained reversible capacities of 1170, 850, and 750 mA h/g at current rates of 100, 280, and 500 mA/g, respectively. Moreover, the use of a different electrolyte composition enabled a reversible capacity of 1300 mA h/g at 100 mA/g after 100 cycles (will be published separately as an electrolyte study). The Si-based composite anodes free of binder and metal current collector demonstrated a 27% increase in SE compared with graphite anodes based on theoretical calculation in a full-cell configuration. This is promising for future high capacity and high energy LIBs.
Supplementary Material
To view supplementary material for this article, please visit https://doi.org/10.1557/jmr.2017.475.
ACKNOWLEDGMENTS
This work is supported by DOE Batteries for Advanced Transportation Technologies (BATT) Program through Pacific Northwest National Laboratory (PNNL) under contract No. 212964. The authors gratefully acknowledge Dr. Qiang Wu for his assistance and helpful discussions.