INTRODUCTION
Closing-in behavior (CIB) (Mayer Gross, Reference Mayer Gross1935) describes the tendency, during copying tasks, to perform very close to or even on top of the model (Critchley, Reference Critchley1953; De Ajuriaguerra, Muller, & Tissot, Reference De Ajuriaguerra, Muller and Tissot1960; McIntosh, Ambron, & Della Sala, Reference McIntosh, Ambron and Della Sala2008; Trojano, Grossi, & Flash, Reference Trojano, Grossi and Flash2009). It is commonly believed that such “overlap” behaviors differ only in degree from the propensity to perform very near to the model without overlap (Gainotti, Reference Gainotti1972). Both forms of CIB are observed in patients with dementia, being more common with increasing severity of cognitive impairment (De Ajuriaguerra et al., Reference De Ajuriaguerra, Muller and Tissot1960; Gainotti, Reference Gainotti1972; Ober, Jagust, Koss, Delis, & Friedland, Reference Ober, Jagust, Koss, Delis and Friedland1991). Gainotti (Reference Gainotti1972) also found that overlap-CIB becomes more frequent relative to near-CIB with increasing cognitive impairment, supporting the idea that these manifestations lie on a continuum of severity. CIB has been more commonly associated with Alzheimer’s disease (AD) than dementia of vascular etiology (Gainotti, Parlato, Monteleone, & Carlomagno, Reference Gainotti, Parlato, Monteleone and Carlomagno1992; Grossi, Orsini, & De Michele, Reference Grossi, Orsini and De Michele1978; Kwack, Reference Kwak2004; Spinnler & Della Sala, 1988). On the other hand, the phenomenon has been estimated to be equally common in AD and fronto-temporal dementia (Ambron, Allaria, McIntosh, & Della Sala, Reference Ambron, Allaria, McIntosh and Della Sala2009a).
CIB leads to impairments on copying tasks, and has long been classed as a form of constructional apraxia (CA) (Critchley, Reference Critchley1953; Mayer Gross, Reference Mayer Gross1935), implying that its functional basis is impaired visuospatial cognition. It has been proposed that CIB reflects a strategic reduction of the distance between model and copy, which compensates for visuospatial impairments by facilitating a more direct tracing strategy (e.g., Lee et al, Reference Lee, Chin, Kang, Kim, Park and Na2004). A related suggestion is that CIB may compensate for working-memory problems that impede retention of a representation of the model over the interval required to make a remote copy (Lee et al., Reference Lee, Chin, Kang, Kim, Park and Na2004). These ideas may be grouped together as the “compensation” hypothesis, which predicts that CIB should be associated with visuospatial and/or working-memory deficits.
An alternative view is that CIB represents a primitive behavior in which the acting hand is attracted towards the focus of visual attention (Ambron, McIntosh, & Della Sala, Reference Ambron, McIntosh and Della Sala2009b; De Ajuriaguerra et al., Reference De Ajuriaguerra, Muller and Tissot1960; Gainotti, Reference Gainotti1972). This “attraction” hypothesis has recently gained support from small-group and single-case studies of patients with AD (Lee et al., Reference Lee, Chin, Kang, Kim, Park and Na2004; McIntosh et al., Reference McIntosh, Ambron and Della Sala2008) and corticobasal degeneration (Conson, Salzano, Manzo, Grossi, & Trojano, Reference Conson, Salzano, Manzo, Grossi and Trojano2009; Kwon et al., Reference Kwon, Kang, Lee, Chin, Heilman and Na2002). McIntosh et al. (Reference McIntosh, Ambron and Della Sala2008) further posited that the release of this primitive behavior may require a reduction of attentional resources, implying that CIB may be a clinical indicator of attentional deficits in dementia (Conson et al., Reference Conson, Salzano, Manzo, Grossi and Trojano2009; Kwon et al., Reference Kwon, Kang, Lee, Chin, Heilman and Na2002).
The present study represents the largest survey to date of CIB in patients with AD, and incorporates the first longitudinal analysis of this symptom, in a subset of this cohort. Our key data derive from the graphic copying component of an extensive neuropsychological battery. This large dataset allows us to assess the frequency of the different forms of CIB in relation to severity of AD, and to explore the cognitive factors predicting CIB, using both cross-sectional and longitudinal approaches. As outlined earlier, compensation hypothesis predicts that visuospatial and/or working-memory deficits will be specifically related to CIB, whereas the attraction hypothesis places greater emphasis on the role of attentional resources.
METHODS
Patient Cohort
The neuropsychological records of 797 patients with a diagnosis of probable AD (McKhann et al., Reference McKhann, Drachman, Folstein, Katzman, Price and Stadlan1984) were reviewed. The assessment of each patient had been conducted by a neurologist or psychologist of the dementia clinic, Third Neurology Ward, St. Paolo Hospital, Milan, Italy. All records from a period between 1999 and 2007 were reviewed, and patients were included if they had a diagnosis of probable AD and a complete assessment record. The patients (281 male, 516 female) had a median age of 78 (range: 45–98), a median of 5 years’ education (range: 2–20), and a median duration of disease of 36 months (range: 1–192).
Longitudinal data were available for 132 patients (59 male, 73 female), who had undergone a second assessment after an average of 1.3 years (SD = 0.83; range 6 months to 4 years). This subset, at first assessment, had a median age of 76 years (range: 57–92), a median of 5 years of education (range: 2–18), and a median duration of disease of 24 months (range: 4–84). By comparison to the subgroup of patients not retested (n = 665), the longitudinal subgroup was significantly younger (median 76 vs. 79 years; Mann-Whitney U = 25840.0, p < .0005) with a higher proportion of males (44.7% vs. 33.4%; Mann-Whitney U = 38924.5, p < .05), but well-matched for years of education (median of 5 for both subgroups).
Because of the retrospective nature of this study, informed consent from the patients was not required. Ethical approval for the study was obtained from the medical ethics committee responsible of the Neurological ward of St. Paolo Hospital, Milan, guarding the archive.
Neuropsychological Assessment
Each assessment involved completion of the MODA (Milan Overall Dementia Assessment), a neuropsychological battery with 11 subtests. These included interview-based assessments of orientation (score range: 0–35) and autonomy (score range: 0–15), which we weighted equally into a single Behavioral subscale. Verbal intelligence was assessed by questions requiring the detection of semantic differences (e.g., truck vs. coach) and comprehension of common proverbs (e.g., one swallow does not make a Summer) (score range: 0–10). A Digit Cancellation test (score range: 0–10) required patients to search for ten instances of a target (number 5) among 100 distracters (other digits from 0–9) for 45 seconds. A preliminary practice search in a simplified array established that the patient could meet the minimum visuospatial requirements for target recognition. Moreover, because the search target was a single, highly familiar symbol, the memory load was very low for this task. Accordingly, although this task certainly requires multiple cognitive abilities, it has been shown to load heavily on attention relative to other cognitive domains (Spinnler, Reference Spinnler, Boller and Grafman1991), and has been used previously as a specific measure of attention in patients with AD (e.g., Della Sala, Laiacona, Spinnler, & Ubezio, Reference Della Sala, Laiacona, Spinnler and Ubezio1992). Verbal Fluency (score range: 0–5) required the generation of animal names for two minutes. Luria’s Reversal Learning (score range: 0–5) required patients to reverse a learned response pairing (palm vs. fist) in a gesture imitation task. Prose Memory (score range: 0–8) required recall of a meaningful story. Finger Identification (score range: 0–5) required patients to identify unseen touches to their fingers by reference to a model. The Token Test required the comprehension and execution of verbal instructions using colored tokens. Street’s Completion test (score range: 0–3) required the identification of degraded black-and-white pictures. Finally, Figure Copying required graphic reproduction of geometrical shapes; the original score recorded for this test (range: 0–3) contributed to the calculation of the overall MODA score. However, for the purposes of regression analyses, the original score was replaced by a new rating, which scored copy quality independently of proximity to the model (see Scoring Methods).
The MODA has published norms from 217 healthy subjects (age range: 25–85 years; educational range: 3–17 years), allowing each patient’s total score to be adjusted for age and education (Brazzelli, Capitani, Della Sala, Spinnler, & Zuffi, Reference Brazzelli, Capitani, Della Sala, Spinnler and Zuffi1994). The adjusted score is scaled from 0–100, with scores above 89.0 considered normal (inner tolerance limit), and scores below 85.5 pathological (outer tolerance limit). Three levels of AD severity were defined by Brazzelli et al. (Reference Brazzelli, Capitani, Della Sala, Spinnler and Zuffi1994): severe (MODA ≤ 49), moderate (49 < MODA < 85.5), and borderline (85.5 ≥ MODA ≤ 89). The median adjusted MODA score of the total cohort was 70 (range: 10–89). The median adjusted MODA score of the longitudinal sample was 78 (range: 38–89) at the first assessment and 66 (range: 14–88) at the second. The decline in performance between first and second assessments was highly significant (z = –9.61; p < .001).
Scoring Methods
Demographic details and MODA scores were transcribed from the archives. The original sheets for the figure-copying task were rescored according to criteria that attempted to separate CIB (proximity of the copy to the model) from other aspects of copy quality. In the Figure Copying subtest of the MODA, the copy space is clearly defined by a horizontal line printed in the center of the sheet (see Figure 1), and the examiner indicates the copy space while instructing the patient to perform the copy in the lower half of the sheet. For each picture, CIB was categorized according to the following criteria (see Figure 1, top row, for examples):
• Overlap-CIB: at least part of the copy invades the model’s space in the top half of the sheet.
• Near-CIB: the copy comes very close (<10 mm) to the dividing line.
• No CIB: the copy is confined to the lower half of the sheet.
Top row: left-to-right, examples of overlap-CIB, near-CIB, and no CIB. Bottom row: left-to-right, examples of unrecognizable, partially recognizable, and accurate copying.

In addition, copy quality, independent of proximity to the model, was rated on a three-point scale, scoring zero points if unrecognizable, one point if partially recognizable, and two points if accurate (see Figure 1, bottom row, for examples), with the mean copy quality calculated across the figures. This scoring procedure differed from the original Figure Copying task of the MODA, in which each picture was rated as: recognizable (one point), partially recognizable (0.5 point), or not recognizable and/or touching or overlapping the model (zero), and the scores were summed across the three figures.
Our scoring system attempted to evaluate CIB independently from other aspects of copy quality, but these scores nonetheless derived from the same test items, and might therefore be confounded one with another. To assess the seriousness of this problem, we recoded our CIB classification (overlap-CIB, near-CIB, no CIB) as a dichotomous variable coding CIB presence/absence, and evaluated the strength of relation with our Figure Copying score and other MODA subtests. CIB presence correlated only modestly with our Figure Copying score (Spearman’s rho = .23), at a level well within the range of its correlations with other subtests (from rho = .06 for Prose Memory to .27 for Digit Cancellation). This modest relationship provides reassurance that copy quality and copy placement were meaningfully independent within our scoring system. Notably, the original MODA Figure Copying score correlated much more highly with our revised Figure Copying score (rho = .66) than with CIB presence (rho = .36), indicating that the original scores were determined more by the quality than the placement of the copy.
RESULTS
Cross-Sectional Analysis
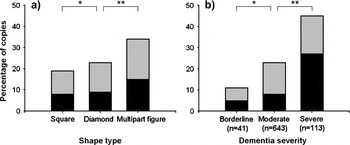
CIB appeared in 588 out of a total of 2339 drawings (25%: 15% near and 10% overlap). Figure 2a shows the percentage of drawings classified as overlap: CIB, near-CIB, and no CIB for each of the three figures. Friedman’s tests on the frequency of CIB (near and overlap combined) confirmed a reliable effect of figure type for the CIB scale (χ2(2) = 90.27; p < .001). CIB became increasingly common as the complexity of the model increased, from square to diamond to multipart figure. The percentage of drawings for each type of CIB at each level of AD severity is shown in Figure 2b. Kruskal-Wallis’ tests on the frequency of CIB (near and overlap combined) confirmed that CIB became increasingly common as AD severity increased (χ2(2) = 36.09; p < .001). Figure 2b also illustrates that the relative frequency of overlap- to near-CIB was increased in cases of severe dementia. Overall, CIB was observed in 343 (43%) patients: the near type was found in 179 patients (22%) and the overlap type in 102 (13%) patients, while 62 (8%) patients showed both types.
(a) Percentage of drawings in each category of CIB by figure type, with figure complexity increasing from left-to-right. (b) Percentage of drawings in each category of CIB by dementia severity. In each plot, the black bar represents overlap-CIB, the grey bar near-CIB, and the white bar no CIB. In both panels: * p < .05; **p < .001.

A regression analysis was conducted to explore the relationships between CIB and the various cognitive subtests of the MODA. The MODA subtests were all intercorrelated (rho > .12, p < .0005 for all coefficients), presumably because of the common factor of disease progression, but multicollinearity was not severe (no coefficient exceeded .53). All ten predictors were thus entered into a backward multinomial logistic regression with CIB as the trinomial dependent variable (overlap-CIB, near-CIB, and no CIB). For this analysis, each patient was classified into a single CIB category according to their most severe manifestation of CIB. For example, a patient showing no CIB, near- and overlap-CIB for the square, diamond, and multipart figure, respectively, was categorized as showing overlap-CIB.
A test of the full model against a constant only model was statistically significant (Model χ2(4) = 98.09, p < .001; Cox & Snell R2 = .116). The distinction between near-CIB and normal performance was best predicted by Digit Cancellation (Wald = 7.91; p < .01). The distinction between overlap-CIB and near-CIB was best predicted by Figure Copying (Wald = 10.35; p < .001) and Digit Cancellation (Wald = 4.02; p < .05). Finally, the distinction between overlap-CIB and normal performance was best predicted by Digit Cancellation (Wald = 24.68; p < .001) and Figure Copying (Wald = 17.10; – < .001). Including age, years of education, and gender as additional predictors in this analysis produced the same outcomes.
Because our Figure Copying score and CIB classification derived from the same test items (see Methods), there was a lingering concern that the strength of relation between these measures might be artifactually inflated. To address this concern, we repeated the first multinomial regression analysis excluding Figure Copying as a predictor. When this was done, the predictive role of Figure Copying was taken over by Street Completion, another measure of visuospatial ability. Thus, the distinction between overlap-CIB and near-CIB was predicted by Digit Cancellation (Wald = 10.35; p < .005) and Street Completion (Wald = 5.79; p < .05), whereas the distinction between overlap-CIB and normal performance was predicted by Digit Cancellation (Wald = 37.3; p < .001) and Street Completion (Wald = 7.41; p < .01). This provides further reassurance that the relationship between overlap-CIB and Figure Copying is a result of the involvement of visuospatial factors, and not any confound in the scoring system.
Longitudinal Analysis
At the first assessment, CIB appeared in 76 of 393 drawings (19%: 15% near, 4% overlap), increasing to 125 of 388 drawings (32%: 17 % near, 15% overlap) at the second assessment. The relative frequency of overlap- to near-CIB, as well as the overall frequency of CIB, thus increased between assessments.
A regression analysis was conducted to investigate the cognitive predictors of deterioration on the CIB scale between assessments. The changes in scores from the first to the second assessment, calculated as the score at first test minus the score at retest, for each of the MODA subtests were used as the ten predictor variables. CIB deterioration was coded as a dichotomous variable, with patients classified as deteriorating if, at the second assessment, they showed a more severe category of CIB, or more instances of CIB at the same category. One patient was excluded because he showed overlap-CIB on all figures at the first assessment, and therefore had no possibility for deterioration. A backward binary logistic regression was run with CIB deterioration as the binary dependent variable. The final regression model was statistically significant (χ2(2) = 14.00, p < .005; Cox & Snell R2 = .102). CIB deterioration was predicted only by change in Digit Cancellation performance (Wald = 7.89; p < .01). Including age, years of education, and gender as additional predictors in this analysis produced the same outcomes.
DISCUSSION
CIB became more frequent with increasing severity of AD (cf. De Ajuriaguerra et al., Reference De Ajuriaguerra, Muller and Tissot1960; Gainotti, Reference Gainotti1972; Ober et al., Reference Ober, Jagust, Koss, Delis and Friedland1991), and the frequency of overlap-CIB increased relative to near-CIB (Gainotti, Reference Gainotti1972). We observed these patterns in the cross-sectional analysis and also in the longitudinal sample. We also confirmed a reliable effect of figure complexity on CIB, with the symptom becoming more frequent, and manifesting more frequently as overlap-CIB, as the figure increased in complexity (Grossi et al., Reference Grossi, Orsini and De Michele1978; Mayer Gross, Reference Mayer Gross1935).
CIB has traditionally been considered as a form of CA (Critchley, Reference Critchley1953; Mayer Gross, Reference Mayer Gross1935), implying a visuospatial problem at its root. In the present study, we attempted to measure CIB and other aspects of CA independently. The regression analyses exploring the cognitive predictors of CIB support the view that visuospatial impairments are not the exclusive cause of CIB. The multinomial regression analysis suggested that different combinations of factors may underlie near-CIB and overlap-CIB, respectively. The emergence of near-CIB from normal performance was predicted by impairment on attentional tasks, with the step from near-CIB to overlap-CIB associated with visuospatial impairment and attentional tasks. Consistent with this, overlap-CIB was distinguished from normal performance by a combination of attentional and visuospatial problems. The regression analysis of the longitudinal sample produced consistent findings, in that deterioration on the CIB scale was associated with deteriorated attentional performance. Taken together, these regression analyses support an attraction hypothesis of CIB (De Ajuriaguerra et al., Reference De Ajuriaguerra, Muller and Tissot1960; Gainotti, Reference Gainotti1972; Lee et al., Reference Lee, Chin, Kang, Kim, Park and Na2004), according to which the symptom reflects a primitive attraction of the hand towards the focus of attention, released by a depletion of attentional resources (Conson et al., Reference Conson, Salzano, Manzo, Grossi and Trojano2009; Kwon et al., Reference Kwon, Kang, Lee, Chin, Heilman and Na2002; McIntosh et al., Reference McIntosh, Ambron and Della Sala2008). However, visuospatial problems may also play an important role, especially in the expression of the, more dramatic, overlap-CIB.
To our knowledge, this is the largest survey of CIB ever conducted in AD, or any other population. However, although the sample size and the longitudinal subgroup are obvious strengths of the data, the retrospective survey method also imposes important limitations. The MODA test battery was created for clinical purposes, not to test between competing hypotheses of CIB, so the mappings between specific subtests and the cognitive domains of interest (visuospatial, working-memory, and attentional functions) are somewhat rough, and serendipitous rather than designed. Moreover, clinical tests such as the MODA subtests are typically sensitive within a limited range of ability, and are often prone to compression at one or both ends of the scale. Thus, ceiling and floor effects were apparent in the distributions of many of the MODA subtest scores. This was especially serious for the prose memory subtest, in which 75% of patients scored zero at the first assessment. This floor effect is unsurprising, given that the diagnosis of AD requires memory impairment, but it implies that our analysis will have been very limited in its ability to differentiate between CIB subtypes on the basis of variations in memory capacity. In addition, although we have characterized digit cancellation as a relatively specific measure of attention (cf. Della Sala et al., Reference Della Sala, Laiacona, Spinnler and Ubezio1992), it nonetheless incorporates visual scanning and recognition components, so we cannot definitely exclude a contribution of visuospatial factors to near-type CIB. These limitations indicate that the present findings must be considered suggestive, rather than definitive, pointing the way toward future, more specifically targeted investigations of the cognitive determinants of CIB.
The suggestion of the present survey is that attentional deficits are key determinants of CIB in patients with AD, supporting the view that this symptom reflects a default behavior characterized by a manual bias toward the focus of attention. Although this symptom is not central to the clinical profile of AD, it might nonetheless have important functional implications. An anonymous reviewer has suggested that CIB could manifest in daily life as a tendency to veer towards objects of attention, raising the likelihood, for example, of collision with salient visual cues (road signs or even pedestrians) during driving. If this tendency is secondary to attentional depletion, then it may also be observed in other drivers with reduced attentional capacity, regardless of their diagnosis. A further implication of the present study, however, is that the most florid, overlap form of CIB, in which the copy is performed directly on the model, does not simply represent an extreme form of this veering behavior. Rather, overlap-CIB may typically require visuospatial impairment. If this is correct, then near and overlap manifestations do not lie on a simple continuum, as has previously been assumed, but also reflect differential involvement of attentional and visuospatial factors.
ACKNOWLEDGMENTS
We are grateful to Professor Hans Spinnler for access to his neuropsychological archives, and to Andy Fugard for statistical advice. We are also grateful to an anonymous reviewer of this manuscript for pointing out the possible link between this clinical phenomenon and single-driver collisions with prominent visual cues. This manuscript, and the information herein, has not been published elsewhere, either electronically or in print.
EA’s work was supported by a bilateral Ph.D. program in “Cognitive neuroscience and experimental psychology” funded by the Ministero Italiano dell’Industria, Universita’ e Ricerca (MIUR), granted to SDS.