1. Introduction
In an efficient capital market, the prices of securities observed at any time are based on the correct evaluation of all information available at that time. According to Fama (Reference Fama1976), prices should therefore fully reflect all available information in an efficient market. Given a set of assets, a profit opportunity arises if, by trading assets from a given set, with positive probability one can purchase a claim to a non-negative future payoff for a non-positive current price, or if one can sell a claim to a certain zero future payoff for a positive current price. Only the absence of such profit opportunities implies that the share market is efficient under Fama's assertion. Asset pricing models that have emerged from this notion of market efficiency express the idea that there is, ex ante, an equality of risk adjusted expected rates of return among a given set of assets.
In an extension of this idea, Long (Reference Long1990) shows that a given set of assets offers no profit opportunities, if and only if a numeraire portfolio can be formed from the set. A numeraire portfolio here is defined to be a self-financing portfolio such that, if current and future asset prices and dividends are denominated in units of the numeraire, the expected rate of return of every asset within the given set of assets is always zero. That is, by simply dividing each asset by the contemporaneous value of the numeraire portfolio, the best forecast of each asset's numeraire denominated rate of return is zero. The main implication of this conclusion is that it is quite general with respect to discrete or continuous time asset trading and return distributions.
Event studies have become the predominant approach for measuring how security prices change in response to information following an event or a set of events. Some of the most widely used diagnostics for event studies include, inter alia the one-factor market model, the Fama-French three-factor model and the Carhart four-factor model. The one-factor model, developed by Sharpe (Reference Sharpe1963) and used in Brown & Warner (Reference Brown and Warner1985) describes the process generating returns during a prescribed event window. Variations of the market model have been employed in a number of studies to detect anomalies in the market efficiency assumption, and to detect other peculiar behaviours in security returns following a specific event (Chandra & Balachandran, Reference Chandra and Balachandran1990; Boehmer et al., Reference Boehmer, Musumeci and Poulsen1991; Bartholdy et al., Reference Bartholdy, Olson and Peare2007). The Fama & French (Reference Fama and French1996) three-factor model uses a market index, a size index and a book-to-market index to explain stock returns. There have been several other models that extend these approaches, the most prominent being the characteristic-based benchmark estimate of Daniel et al. (Reference Daniel, Grinblatt, Titman and Wermers1997) and the four-factor model of Carhart (Reference Carhart1997) that appends the Fama-French three-factor model with a short-run momentum index. In this study we restrict our analysis to the performance of the market model and the Fama-French three factor model against the numeraire-denominated returns approach (NDRA). The results in Ahern (Reference Ahern2009) show that there is little additional explanatory power in the multifactor models that extend the Fama-French three-factor approach and while multifactor regression models may alleviate the omitted variable bias of a simple market model, they may also introduce additional estimation error, see Fama & French (Reference Fama and French1997). The primary advantage of the NDRA is that no regressors need to be estimated which helps eliminate estimation error and there is no requirement to choose a ‘normal’ estimation period, either pre- or post-event, as there is in competing models.
The basis for inference in event studies is a test statistic, typically the ratio of the mean excess return to its estimated standard deviation. The aim of the test is to detect the presence of statistically significant departures from the assumption of market efficiency. However, tests of the efficient market hypothesis (EMH) are always joint tests of market efficiency, an underlying equilibrium model and a related market or factor model. In many studies, one possibility that is seldom considered is that if the EMH has been rejected, it is not because the wrong market model was used.
The objective of this analysis is to offer a robust and reliable alternative to the traditional models used for examining investor behaviour following an event under the EMH by using the growth optimal portfolio (GOP) as the numeraire portfolio, first suggested by Kelly (Reference Kelly1956). This approach avoids the problems associated with bias and efficiency when using the traditional market model and other problems such as the presence of momentum when using the Fama-French three-factor model. A variety of tests are employed in this analysis to detect adjustments of security prices to specific kinds of new information under these methods. We shall employ this unique methodology to catastrophic loss events in the insurance sector.
The advantages of using a numeraire proxy to extract market adjusted returns are the same as the advantages of using various market portfolio proxies to obtain abnormal returns. Just as market model proxies are used to estimate abnormal returns for individual assets, a numeraire proxy can be used for obtaining the market adjusted returns from the numeraire denominated returns of individual assets. Numeraire denominated returns have the same qualitative interpretation as conventional abnormal return measures. Ignoring measurement and estimation errors, both approaches measure asset performance relative to the average contemporaneous performance of other assets in the market. Both statistics are constructed so that, in equilibrium, the best short-term forecast for the statistic is zero.
More broadly, under the so-called benchmark framework, numeraire denominated returns are supermartingales, see Bühlmann & Platen (Reference Bühlmann and Platen2003). The theoretical justification behind this assumption accords with the work of Fama (Reference Fama1998), concerning the fair pricing of securities in an efficient market, particularly in the short term. The main advantage of this approach is that because daily expected returns are close to zero, a model for expected returns does not have a big effect on inferences about abnormal returns. The main contribution of this paper is that it applies the NDRA to event study methodology. We identify a growth optimal portfolio to act as the numeraire and then show that in a practical setting the NDRA strongly dominates both market model and factor model approaches. The so-called benchmark approach of Bühlmann & Platen (Reference Bühlmann and Platen2003) provides a general framework for financial market modelling which extends beyond standard risk-neutral pricing theory. It permits a unified treatment of portfolio optimisation, derivative pricing, integrated risk management and insurance risk modelling. Under the benchmark approach the existence of an equivalent risk-neutral pricing measure is not required. Instead, it leads to pricing formulae with respect to the real-world probability measure. This yields important modelling freedom which is necessary for the derivation of realistic and parsimonious market models. In addition to the fact that market model regressions of each asset are not necessary, an important advantage of the NDRA is that analysis may still be conducted using firms who cannot obtain reliable market model regressions.
In order to demonstrate the applicability of this approach, we look at catastrophic events and their influence on the returns in the insurance sector. This study utilises a short window positioned around relatively cleanly dated events to demonstrate the tractability of the NDRA. The results obtained from this methodology are shown to offer a more robust system for detecting abnormal returns in an efficient market. We use catastrophic events to measure market efficiency for two reasons. First the magnitude of the insurance losses for each of the selected events are sizeable, therefore market inefficiencies in the form of mispricing should become apparent. Secondly the liquidity of each insurer's unearned premium reserve account will have a direct but unknown impact on the firm's expected earnings which will affect insurer stock returns after an event. Our approach also avoids the problems associated with a contaminated estimation period discussed in Aktas et al. (Reference Aktas, de Bodt and Cousin2007) by using an appropriate test statistic.
This paper is organised as follows. Section 2 describes the NDRA in broad terms. Section 3 outlines the structure of the insurance market used in this study and the nature of catastrophic insurance events. Section 4 describes the testing methodology of both the numeraire denominated returns and the market model approaches. Section 5 constructs the test statistics used in this analysis. Section 6 presents the results of both approaches. Section 7 discusses and tests the differences between both approaches. Section 8 tests for a relationship between the size of catastrophic events and abnormal returns. Section 9 offers some concluding remarks.
2. Numeraire Portfolios and the EMH
Previous event studies have almost exclusively used the market model to measure abnormal returns, however more recent analyses have employed the Fama & French (Reference Fama and French1996) three-factor model and the Carhart (Reference Carhart1997) four-factor model. The Carhart (Reference Carhart1997) model will not be employed in this analysis as it has been shown to offer only a modest increase in explanatory power relative to the Fama-French three-factor model in Australia, see Schneider & Gaunt (Reference Schneider and Gaunt2011). For the market model the intercept and slope from the regression of a stock's return on the market return, estimated outside the event period, are used to estimate the stock's expected returns conditional on market returns during the event period. This will be referred to as the market model approach (MMA) throughout this analysis. For the Fama-French three-factor model, the estimation of abnormal returns is defined as the difference between the ex post return of the underlying asset minus the normal return defined under the three-factor model using the size (SMB), book-to-market ratio (HML) and the risk premium on the market portfolio as determinants of asset returns.
If however, a satisfactory numeraire proxy of the type suggested by Long (Reference Long1990) can be identified then numeraire denominated returns are a viable alternative to the above conventional measures of abnormal returns. Our approach is conceptually similar to the benchmarking of assets in the benchmark models of Bühlmann & Platen (Reference Bühlmann and Platen2003) to empirically measure market efficiency under the EMH.
Perhaps the most poignant feature of the numeraire portfolio is the property that zero is always the best conditional forecast of the future numeraire denominated rate of return on an asset, see Long (Reference Long1990). This condition is consistent with cross-sectional heterogeneity and material variation in expected dollar rates of return, so long as these are not indicative of, so called, profit opportunities.
Numeraire denominated returns have two advantages over market model and other factor model forecast errors as measures of abnormal returns. Because the multivariate process of numeraire denominated returns depends only on relative gross returns, it must be stationary under a broader range of circumstances than the multivariate process of nominal returns. For instance, over longer time horizons, the impact of inflation on the parameter estimates for the market model may be significant, even though relative gross returns, and therefore numeraire denominated returns, are not affected. Numeraire denominated returns are independent of expectations and realisations of pure price level inflation. Long (Reference Long1990) shows that numeraire denominated rates of return can be a stationary stochastic process even if the nominal rates of return are not. Indeed, if prices are denominated in the numeraire portfolio, then the real world probability measure is a martingale measure and no substitution of a different measure is necessary for the valuation of certain instruments, such as contingent claims. This is an important advantage of the NDRA and a significant contribution of this analysis.
Also, numeraire denominated returns for individual assets are computed through simple division which therefore eliminates the requirement for market model parameters to be computed for each security across each event being analysed. The feature of computational and interpretive simplicity is, in fact, one of its most attractive features.
The benchmarking approach of Bühlmann & Platen (Reference Bühlmann and Platen2003) used in this study as the NDRA permits a unified treatment of insurance risk modelling. This theory aligns the actuarial approach with the risk-neutral pricing approach and the existence of an equivalent risk-neutral pricing measure is not required. This leads to pricing formulae with respect to the real-world probability measure which yields important modelling freedom necessary for the derivation of other realistic and parsimonious market models.
The obvious disadvantage in observing market adjusted returns obtained using numeraire denominated returns is finding an appropriate GOP proxy. However, as shown in Bühlmann & Platen (Reference Bühlmann and Platen2003), a good proxy for the GOP is available which will be exploited.
3. Catastrophic Losses in the Insurance Industry
Several extreme catastrophes recording losses greater than US$20 billion have caused several insurance firm bankruptcies in the US. Although not of the same magnitude, large losses (several in excess of US$1 billion) have been recorded in Australia. Very little research has been dedicated to examining the market's reaction to such events.
Only three studies have examined the impact of large losses and other significant events on insurers’ stock values using the market model. Sprecher & Pertl (Reference Sprecher and Pertl1983) and Davidson et al. (Reference Davidson, Chandy and Cross1987) find that large losses due to natural disasters and airline crashes are rapidly incorporated into stock prices with significant negative returns, however Shelor et al. (Reference Shelor, Anderson and Cross1992) find that property-liability insurer stock values tended to increase after an isolated catastrophic loss event. Over the long-term however, no specific evidence has been produced to examine the market's reaction to insurance stocks which face large insurance losses. Previous studies measuring the reaction to security returns have focused on only a single event, however, to obtain an unbiased measure of efficiency to avoid factors particular to that event, a number of independent events is used in this analysis. This study will show that using the NDRA of Long (Reference Long1990) and Bühlmann & Platen (Reference Bühlmann and Platen2003) large insurance losses are efficiently incorporated into stock prices.
3.1 Insurance coverage of catastrophic losses
The reason why catastrophic events were chosen for the event study are twofold. Firstly catastrophic events may in fact be of some benefit to property casualty insurers. The hypothesis that an increased demand for insurance following a significant event driven by consumer awareness is supported in Kunreuther et al. (Reference Kunreuther, Ginsberg, Miller, Sagi, Slovic, Borkan and Katz1978) who found that consumer demand for flood insurance increased following a flood event. Secondly when a catastrophe is significantly large the entire insurance sector may experience a net loss, however the smaller firms and firms who have a geographically concentrated customer base are limited by statutory accounting requirements in the amount they can deploy from surplus accounts to pay claims. Smaller and geographically concentrated insurers are usually more negatively affected than the larger insurers. Furthermore statutory accounting requirements, which are designed to ensure sufficient reserves to cover policies, mandate the maintenance of an unearned premium reserve account to limit the amount of surplus assets an insurer can deploy to settle claims. The amount is then reduced through a credit to earnings as the policy period progresses to expiry, however to balance the unearned premium reserves account an insurer must transfer funds from other accounts, usually from surplus reserves. Importantly these reserves cannot be used to settle claims and so when an insurer expects a large number of claims from a catastrophic event, the insurer suffers potential liquidity shortfalls which may result in the insurer entering the reinsurance market to obtain capital. Reinsuring increases liquidity by freeing up surplus reserves from the unearned premium reserve account and the insurer receives a ceding commission from the reinsurer that rebates the insurer for costs to issue the policy. The ceding commission increases surplus reserves immediately, but a financially distressed insurer may be forced to accept a lower ceding commission from reinsurers which may not sufficiently recover surplus accounts, which in turn affects solvency. Catastrophic events therefore tend to affect the traded stock of insurers in a relatively more complex way than for non-insurers. Large losses may result in a fall in an insurer's net worth, however the incident itself may present an insurer with profit opportunities, particularly the larger and more liquid insurers who may exploit a temporary liquidity crisis to achieve greater than expected returns.
3.2 A portfolio of catastrophic losses
The need to observe multiple events over a period of time is highlighted by the shortcomings evident in the single event study conducted by Shelor et al. (Reference Shelor, Anderson and Cross1992). The returns around a single event may be susceptible to contamination by major economic events independent of, but occurring simultaneously with, a catastrophe causing large insurance losses. The Shelor et al. (Reference Shelor, Anderson and Cross1992) study concerning the 1989 Loma Prieta Fault earthquake failed to include sufficient compensation for the impact of the lowering of official US interest rates soon after the event, in retaliation to a large stock market drop two days after the earthquake. Since many of the assets held by insurance companies are typically highly concentrated in interest rate sensitive instruments relative to the market, an unanticipated fall in official rates may considerably affect insurance stock returns. Failure to reconcile the difficulties in differentiating correlation from causation in Shelor et al. (Reference Shelor, Anderson and Cross1992), poses problems in using a single event to determine market reaction to catastrophic events. To combat this, we shall examine the insurance security returns for the Australian insurance sector for a number of catastrophic events over a 28-year period.
To obtain a robust measure of abnormal returns across an entire sector, it is necessary to observe a market that has a relatively high insurance coverage level which is also subject to catastrophic events that are insurable. In order to capture the effects of catastrophic events on insurance stock returns, we also require a market that is characteristically small yet mature. The Australian insurance industry is a relatively good choice since large insurance coverage rates are observed, while only a small number of publicly listed insurers cover the majority of insurable risks. This market is relatively small in comparison to the insurance sector in the US, Japanese and European markets, which makes it easier to eliminate some of the more common measurement errors including loss biases due to firm size and the concentration of insured exposures to some companies based on geographical location. These measurement errors are largely avoided in Australia given that insurance firms are of a similar size and also have roughly an equal share of the market. The majority of events (apart from the very large loss events) do not trigger contract reinsurance claims which means that the losses absorbed by the Australian insurers should be almost immediately reflected in the stock price during the event window. Larger losses may also translate into stock price changes as discussed in section 3.1.
A catastrophe in insurance terms has a number of competing definitions. In order to encompass all existing meanings of the notion of a catastrophe to insurers and the subsequent reported losses to market participants, some quite liberal limits were chosen. The catastrophic events in this analysis were chosen according to two criteria. Firstly, the size of the total insured loss to the insurance industry must exceed US$5 million while the total damage estimate from the event itself must exceed US$100 million. This enables us to filter out large but uninsured loss events that may bias the results. Loss estimates refer to all losses (including uninsured infrastructure, remediation by governments and so on) as well as some degree of underinsurance in the market.
Secondly, the event must be devoid of information leakage. This relates specifically to events not being able to be anticipated by the market, thus enabling the occurrence of the event to send new and relevant information to the market. Aktas et al. (Reference Aktas, de Bodt and Cousin2007) extend the Markov switching regression framework developed by Hamilton (Reference Hamilton1989) to address contamination in the estimation window by proposing a two-state version of the classical market model as a return-generating process. Their results highlight the importance of explicitly controlling for unrelated events occurring during the estimation window, especially in the presence of event-induced volatility. To address the potential existence of bias from other events we employ the two-state market model (TSMM) test in addition to two relatively standard but powerful test statistics.
3.3 Avoiding information leakage
To obtain a cleanly dated event for each catastrophe, the event date varies depending on the nature of the actual event. For storms, earthquakes, landslides, explosions, tornados and flash floods, the event date t = 0 is the actual date of the event as first reported in news announcements in Reuters, Bloomberg and the wider financial news media. Typically, no prior warning is possible for these events and therefore the problem of information leakage to the market is avoided. The event date is therefore the actual date in which the event occurred and was reported in the appropriate news channel as having occurred. For an extended event, for instance a two- to three-day severe storm or flood, the event date is set to the first day when significant damage is apparent, and expectations of significant damage is reported in the media. For bushfires and cyclones however, anticipated losses which may represent information leakage, can occur up to several days prior to the actual event. By the time a cyclone reaches the coastal region, or a bushfire becomes uncontrollable, the information surrounding the impending event may be old news to the market. For both of these types of events, we carefully set the event date in such a way that the information concerning the event has not been widely disseminated. For consistency we set the event date two days prior to the instant that the majority of damage occurs. This may be somewhat of an arbitrary correction but it will help capture the true market reaction where information leakage is possible.
Avoiding the problem of information leakage is important when the reaction of the market to an event is observed only on the event day, constituting a one-day event window. Assuming it takes the market longer to assimilate all information surrounding an event, particularly a large loss insurance event with extensive damage to a widespread area, a longer event window is required. We will utilise a 50 day trading window, 25 days of which precedes each event t ∈ {−25,…,−1}, one day to represent the event date t = 0, and the remaining 24 days superseding each event t ∈ {1,…,24}. Using this trading window will also help avoid the problem of estimating the exact event date for events, such as cyclones and bushfires, which do not have the characteristics of inflicting damage, and therefore conveying information to market participants, at any particular instant.
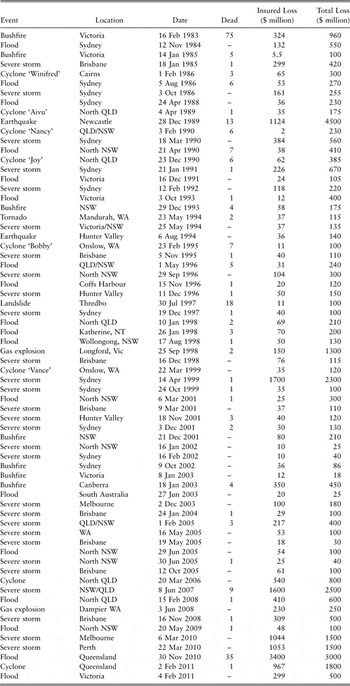
Using the above criteria for the Australian insurance industry from January 1983 to February 2011, we observe 68 individual events that can be classified as a catastrophe in terms of insurable loss. Both the insured losses and total losses for each event were converted to 2011 Australian dollars (AUD) using the published yearly rate of inflation issued by the Reserve Bank of Australia (RBA).
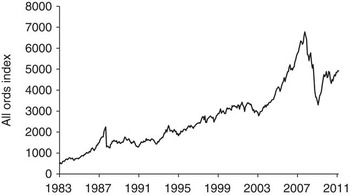
The market proxy used to represent the benchmark in this analysis is the All Ordinaries Index (AORD), which comprises 99.3 percent of the total market capitalisation of the Australian market, and can therefore be said to be representative of the whole market. As shown in Platen (Reference Platen2002), any broadly diversified portfolio can be shown to approximate the GOP. The AORD is a good candidate for the numeraire portfolio of the Australian market and will be used to benchmark returns. The AORD from January 1983 to February 2011 is shown in Figure 1. The spike observed in late-1987 is the equity market boom prior to the crash on Black Monday in October 1987.
Australian all ordinaries index Jan 1983 to Feb 2011.

4. Testing Methodology
Brenner (Reference Brenner1979) showed that if tests based on different market models result in different conclusions about market efficiency, then a correctly specified model is of vital importance. However if the conclusions about market efficiency are insensitive to the different market models used, then a robust theory of efficient market exists. Since the correct market model is unknown, we cannot separate truly inefficient market behaviour from an observed indication of inefficiency due to biases. One may assume the market to be efficient and choose the model that coincides with it to be the correct one. Alternatively, one may assume that a particular market model is true and test the efficiency of the market using this model. We lean towards the former approach in the initial part of this analysis, due to the increasing degree of evidence supporting the EMH, see Fama (Reference Fama1998).
The Central Limit Theorem guarantees that if the excess returns in the cross-section of securities are independent and identically distributed drawings from finite variance distributions, the distribution of the sample mean excess return converges to normality as the number of securities included in the drawings increases, see Beard et al. (Reference Beard, Pentikainen and Pesonen1984). There is some evidence of the distribution of cross sectional Australian insurance stock excess returns converging to the normal, and as such the use of a number of security returns across a number of events is methodologically prudent. Indeed, of concern here is that the assumptions underlying the Central Limit Theorem are not violated while testing market efficiency.
We use the return of the AORD to represent the value-weighted market index return Rm(t) at time t, since it is our proxy for the market. If  during the period under consideration, then
 will be an unbiased estimate of βi, regardless of the true underlying model. We let t represent the time passage before and after the event and let i, i = 1,…,N be the number of securities represented for each event. We do not distinguish between types of events. The value for N is therefore the number of securities i multiplied by the number of events. Not all securities were publicly listed for every event, and one has been listed only since 1998. In total, 225 sets of security prices are used in this analysis.
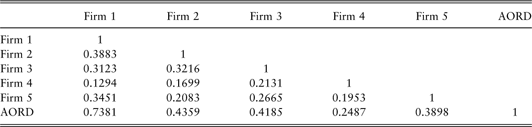
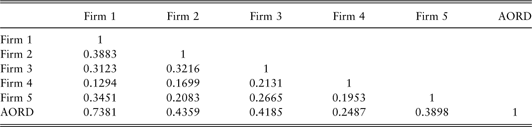
Our data consists of the security returns of several Australian insurance firms over 68 individual catastrophic events, which are listed at Appendix 9. The five main Australian insurance firms constitute 98.7 percent of the total property-liability insurance policies written in Australia, which is a particularly high level of concentration for a small number of firms. We expect large dependencies in security prices across insurance firms and must therefore make statistical adjustments for this in our analysis. When there is positive cross-sectional dependence, failure to make an adjustment results in a systematic underestimation of the variance of the mean excess return, implying too many rejections of the null hypothesis, both when it is true and when abnormal performance is present, see Brown & Warner (Reference Brown and Warner1985). Table 1 gives the correlation coefficients for the security returns of the five largest insurance firms in Australia and the AORD. Some degree of positive correlation appears across most firms. As one would expect, there are also time dependent variations in the correlation between each security and the market proxy across each event. This is, of course, likely to induce errors in the market model parameter estimates. The market model goes some way in correcting for this however, by re-estimating the parameters for each security and for each event.
Correlation coefficients for the security returns of the five largest insurance firms in Australia and the All Ordinaries Index (AORD) for the period Jan 1983 to Feb 2011.
4.1 Excess return measures using numeraire denominated returns
The numeraire denominated returns approach (NDRA) can be formulated to retrieve evidence of abnormal returns in an efficient market. A numeraire portfolio N is defined as a self-financing portfolio with always positive value such that, for each asset j and each time t, 0 ≤ t ≤ T,
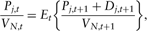
with probability one, where Pj ,t is the ex-dividend price of asset j, Dj ,t is the dividend per unit of asset j, VN ,t represents the value of a self-financing market portfolio and Et{·} denotes the expected value conditional on all information available at time t.
If a numeraire portfolio exists, and if
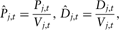
and

then the numeraire's definition and the law of iterated expectations imply

and

with probability one for all j and t. In other words, when prices and dividends are denominated in units of a numeraire portfolio, asset prices equal the undiscounted sum of expected future payoffs.
The numeraire denominated rate of return  on security i for the period [t−1, t] is
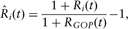
where Ri(t) is the nominal rate of return on security i for the period t ∈ {−25,…,24}, and RGOP(t) is the contemporaneous nominal rate of return on the numeraire portfolio or AORD, which is also the GOP. The values for RGOP(t) are essentially equivalent to the values for Rm(t) used in the market model approach. However, we distinguish between the two for notational convenience since the same index is used in different contexts.
Equation (2) can be expressed as

and by setting α = 0 and β = 1 we obtain

which is known as the “zero-one market model” based on log returns, see Brenner (Reference Brenner1979). We use this specification as the alternative to the traditional market model, however we will refer to this method as the NDRA for consistency.
As shown in Long (Reference Long1990), the expected value of the one step ahead numeraire denominated rate of return of a fair price process satisfies the equation

for t ∈ {0, 1, 2,…}. An asset's numeraire denominated gross return, defined as one plus its rate of return, for a given period is calculated as its nominal gross return divided by the numeraire's nominal gross return. Thus, numeraire denominated returns are nominal returns adjusted to reflect the contemporaneous return on the market, as measured by the nominal return on the numeraire portfolio. The numeraire denominated return on itself is zero by construction. In this sense, numeraire denominated returns measure asset specific returns in the same context as market model residuals.
Therefore, numeraire denominated returns are natural measures of abnormal returns. If there are no profit opportunities or more broadly, no arbitrage, the best forecast of future numeraire denominated returns is therefore zero. In this sense we will show that numeraire denominated returns measure asset specific returns in the same sense as market model residuals.
The securities observed over all catastrophic events are combined into an equally weighted portfolio  , which has a return
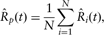
where N is the number of securities multiplied by the number of events. This creates a portfolio of 225 securities, representing a time series of all publicly listed stocks over the 50 day event period for 68 catastrophic events. We use an equally weighted portfolio because on and immediately after the event date there is unreliable information concerning the actual level of insurable loss exposure to each insurer, therefore an equally weighted portfolio serves as an average loss for the whole sector. The market share of each insurer is roughly equal and we therefore assume the insurable loss for each insurer, averaged over a portfolio of 68 events, will also be roughly equal. We shall also form an inverse variance portfolio  by
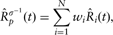
where wi represents the weight applied to each GOP denominated security return, the calculation of which will be discussed in section 5.2.
The notion of an abnormal return, from the market model approach, is misleading in the context of numeraire denominated returns, since the short-term expected numeraire denominated return is zero by construction, see (5). However, any nonzero return observed under the NDRA will be viewed as an abnormal return for the purposes of consistency in this study.
The cumulative abnormal return (CAR) for an equally weighted portfolio  is calculated as
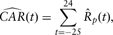
and the CAR for the inverse variance weighted index  is
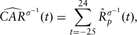
for t ∈ {−25,…,24}. These measures are useful for observing trends in abnormal returns during the event period. The use of CARs instead of other measures such as the currently popular buy and hold abnormal returns (BHARs) is because the BHAR measure can give false impressions of the speed of price adjustment to an event, see Fama (Reference Fama1998). The relative computational and interpretive simplicity of the NDRA is clearly its most attractive feature.
4.2 Excess return measures using factor models
Assuming capital market efficiency in the context of Fama (Reference Fama1976), security prices will adjust rapidly to new information in an unbiased manner. Capital market efficiency can be represented by the fair game model,

where Pi(t + Δ) is the price of security i at time t + Δ,  is the information set at time t and Et is the conditional expectations operator at time t. The difference between the expected price and the actual price at t + Δ based on the information set
 is expected to be zero, assuming market equilibrium conditions prevail.
In order to gain a more relevant view of market efficiency for this empirical study, the use of rates of return rather than prices in the above model is preferred. Equation (10) can be restated as  where Ri(t + Δ) is the return of security i at t + Δ.
The advantage of this method is that it is able to abstract the effects of the unique event from that of general market conditions. The disadvantage is that errors in the expected returns during the event period may be significant if the covariance between the security of interest and the market proxy is diminutive and insignificant. The market model first cited by Sharpe (Reference Sharpe1963), introduced a relationship between Ri(t) and Rm(t) implied by bivariate normality, and is represented by Ri(t) = αi + βiRm(t) + εi(t) where Ri(t) is the return on security i at time t, Rm(t) is the return on the value-weighted market index at time t, αi is the intercept of security i, βi is the beta of security i equivalent to Cov(Ri, Rm)/Var(Rm), and εi(t) is the disturbance term. The disturbance term εi(t) has mean zero and is independent of Rm(t) so that  and
 and
 for t ∈ {−150,…,24}.
As stated, time zero t = 0 is the date of the event. The abnormal returns are examined from 125 days prior to the event t = −150, to 24 days after the event t = 24. The first pass regression estimates the parameters of the market model using t = −150 days to t = −26 days, and we call this period the estimation period. This regression provides estimates for αi and βi, which are denoted as ai and bi, respectively, for each security i over each of the 68 events. These parameter estimates are applied to the actual market return Rm(t) for days t = −25,…,0,…,24, to obtain the normal returns  for security i over each of the 68 events. The estimated normal returns are compared to the actual returns for each of the i securities for days t = −25,…,0,…,24. This subset of time is referred to as the event period. The difference between the normal returns and the actual returns for security i at time t is called an abnormal return, ARi(t), and is determined by

where Ri(t) represents the actual return on security i at time t, and ai + biRm(t) is the expected return for each of the 68 events.
The average abnormal return, or more accurately the portfolio excess return, is computed by summing the ARi(t) across all i, i = 1,…,N firms for each day both before and after the catastrophic event, and dividing by N.
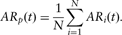
The cumulative abnormal return (CAR) is defined as
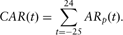
The Fama & French (Reference Fama and French1993) three-factor model is constructed similarly. The ex-post Fama-French model is given as  for i = 1,…,N where Rm(t) is the value-weighted index, SMB (Small Minus Big) is a mimicking portfolio to capture risk related to size and HML (High Minus Low) is a mimicking portfolio to capture risk associated with book-to-market characteristics. The coefficient estimates
 are regression coefficients and εi is the error term. The coefficient estimates are obtained using OLS regression on estimation period returns. We used a daily time series of the Fama-French factors (HML, SMB and market excess return) for Australia from proprietary research conducted at Griffith Business School which was cross-checked for accuracy against monthly results obtained in O'Brien et al. (Reference O'Brien, Brailsford and Gaunt2009). The factors obtained from the two independent studies are largely aligned with some minor exceptions. When a difference was observed, both sets of factors were used to examine abnormal and cumulative abnormal returns for a particular event. In all cases, where differences between the Fama-French factors were observed no conflict was detected between the significance of either abnormal returns or cumulative abnormal returns. Abnormal returns and cumulative abnormal returns are estimated for each security over the 68 event windows as per equations (12) and (13).
4.3 Estimation errors
In practice, both numeraire denominated returns and the more conventional market model estimates for abnormal returns are subject to estimation errors. For numeraire denominated returns, estimation errors emerge from the construction of the proxy for the GOP. When obtaining estimates of abnormal returns using the market model and Fama-French model however, the errors arise from the use of a proxy for the market portfolio upon which model parameters are obtained. The actual estimation of each specific model parameter for each asset across each event is subject to errors of varying magnitudes.
The correlation between individual securities and the market proxy heavily influences the accuracy of both the market model and the Fama-French model and therefore, due to the time dependent variability in the significance of the correlations, it can be said that the market model approach loses a great degree of reliability in obtaining expected returns.
Table 2 illustrates the average coefficient of determination statistic  for each firm over the estimation period t ∈ {−150,…,−26} for each model approach. It is clear from this table that there are significant biases in the regressions. For example, the R 2 value for Firm 1 indicates that, on average, only about 52 percent of the sample variance of the stock's return can be attributed to the estimated market model relationship between
 .
Average coefficient of determination R 2 values of market model (MMA) and Fama-French three-factor model (FF3F) for the five firms used for regressions with the All Ordinaries Index.

4.4 Event-induced variance
In general, event study tests are reasonably powerful, see Brown & Warner (Reference Brown and Warner1985), but there are potential testing problems created by event induced increases in the variances of returns, particularly when using the market model approach. If the variance is underestimated, the test statistic may lead to an incorrect rejection of the null hypothesis of zero abnormal returns. To remedy this problem, estimation period residual variance is ignored and the cross sectional variance over the event period itself forms the test statistic. We will also employ an extension of this method that weights the abnormal returns in inverse proportion to their variance for the market model approach, the Fama-French three factor model and the NDRA.
Some studies note that the cross sectional standard deviation in the event period increases by up to four times the standard deviation observed during the estimation period, see Boehmer et al. (Reference Boehmer, Musumeci and Poulsen1991). The increase in standard deviation from event-induced variance observed in Australian insurance stock returns for 1983 to 2011 rises by up to 55 percent for some stocks, although many experience insignificant changes. This amount is, however, enough to invoke an incorrect rejection of the null hypothesis. The potential for event induced variance to contaminate the true returns will be rectified using two of the alternative testing methods explained below.
5. Test Statistics
The basis for inference in traditional event studies is the use of a test statistic. The first test is simple and is easily constructed, however, it lacks the ability to deal with event induced variance and abnormal return dependencies among security returns under the market model approach. The second test is relatively powerful in that it can better account for event induced variance and more importantly, cross sectional dependencies.
5.1 Non-dependent adjustment method
Brown & Warner (Reference Brown and Warner1985) use a non-dependent adjustment method which assumes that security residuals are uncorrelated and that event-induced variance is insignificant. This method is not appropriate if the securities’ residuals are cross-sectionally correlated, which can occur due to event date clustering. We will employ a crude dependence adjustment procedure to correct this problem. By using a time series of average excess returns (portfolio excess returns), the test statistic takes into account cross-sectional dependence in the security specific excess returns. The crude dependent adjustment test statistic is

where ARp(t) is given in (12) and
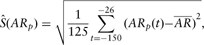
where
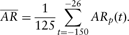
If the ARp(t) are independently and identically Gaussian distributed, the test statistic is Student-t distributed under the null hypothesis of event period excess returns equating to zero. The test statistic however, ignores any time-series dependence in excess returns. The observed mean excess returns in this study are typically Gaussian, which is consistent with earlier findings, see Brown & Warner (Reference Brown and Warner1985).
5.2 Modified weighted least squares
Two different approaches to account for cross-sectional dependencies are the generalised and non-generalised least squares tests. The generalised least squares test uses the covariance in weighting the mean excess returns, while in contrast, the non-generalised test disregards the correlations among abnormal returns when assigning portfolio weights. This approach is preferred to the generalised least squares approach if there are strong dependencies among contemporaneous returns. As already noted, there is some dependence among insurance security returns due to the high degree of industry concentration. There are, however, problems associated with incorporating covariance effects into a multifactor market model, the main one being that inferences about market efficiency can be sensitive to the assumed model for expected returns, see Fama & French (Reference Fama and French1996).
A measure of cumulative abnormal returns used by Shelor et al. (Reference Shelor, Anderson and Cross1992) is the modified weighted least squares method, initially suggested by Chandra & Balachandran (Reference Chandra and Balachandran1990). This approach weights the abnormal returns in inverse proportion to their variance. Shelor et al. (Reference Shelor, Anderson and Cross1992) assert that if no systematic relationship is assumed between the mean and variance of abnormal returns, then this test appears to be the most accurate. Chandra & Balachandran (Reference Chandra and Balachandran1990) claim that generalised least squares tests are inappropriate for event studies because these tests are highly sensitive to errors in specifying the abnormal return model, and also because we do not know enough about how securities should react to information to specify the correct model for an event.
If the adjusted abnormal returns are assumed to be independent, then the modified weighted least squares portfolio is simply the minimum variance portfolio. In the presence of the correlation between abnormal returns, Chandra & Balachandran (Reference Chandra and Balachandran1990) find that this method is still proficient in observing the true excess abnormal returns.
We construct a portfolio of abnormal returns with weights

where
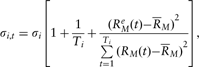
and where Ti is the number of days in security is estimation period,  is the market return on day t during the event period,
 is the average market return during the estimation period and RM(t) is the market return on day t. From this, a portfolio of abnormal returns for all securities across all events is constructed as
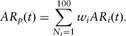
The modified weighted least squares regression model produces heteroscedastic and slightly skewed excess returns that approximate the normal. The modified weighted least squares cumulative abnormal returns are therefore computed as
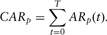
Assuming that the abnormal returns are independent and identically distributed, as well as Gaussian, the standard error of ARp(t) is

and the z-statistic for the modified weighted least squares cumulative abnormal returns is
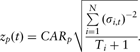
The standardised cumulative abnormal returns for firm i during event e is
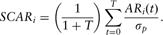
The standardised cumulative abnormal return is assumed to be normally distributed with mean 0 and variance 1. A quasi-z statistic can be obtained if we sum the SCARi across all firms and divide by the square root of the number of firms, since the portfolio is also assumed to be normally distributed with mean 0 and variance 1.
5.3 Two-state market model
To deal with possible bias due to contamination of returns during the event window we compare the modified weighted least squares test with the two state market model (TSMM) test of Aktas et al. (Reference Aktas, de Bodt and Cousin2007) which relies on the Markov switching regression framework of Hamilton (Reference Hamilton1989). This test assumes that the return generating process can be adequately modelled by a two-state process in which one regime has normal variance and the other high variance. The market model parameters are assumed to be the same in the two regimes such that

where  and S is a state variable assuming a value of 1 for the low variance state and 2 for the high variance state, as per Aktas et al. (Reference Aktas, de Bodt and Cousin2007). The γi coefficient is the estimated event-day abnormal return and the standard error of γi is used to standardise the abnormal return. The standardised abnormal return is
 where SE(γi) is the standard error of the coefficient γi. The test statistic from Aktas et al. (Reference Aktas, de Bodt and Cousin2007) based on a maximum likelihood approach is estimated for each event window. The TSMM test statistic has been shown to dominate other standard tests during contaminated event windows. The results are discussed in section 6.2.
6 Results
6.1 Numeraire denominated returns approach
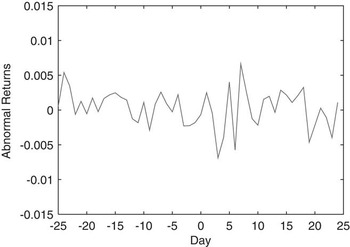
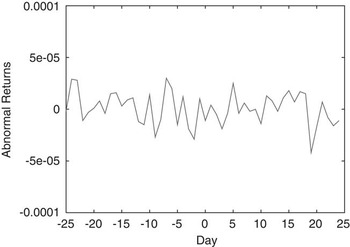
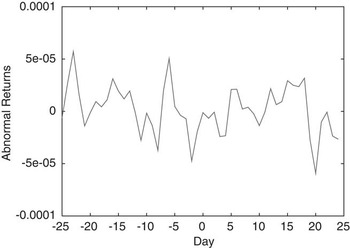
The expected return of daily numeraire denominated returns over a short window is theoretically zero. Under the NDRA we should therefore observe zero or statistically insignificant returns over the event period, using the AORD as the GOP proxy or numeraire. Figure 2 shows the numeraire denominated returns  for an equally weighted portfolio. Tests for significance are similar to those used for the market model approach. After the event day t = 0, we observe what appears to be a marked increase in the variability of returns that persists for about 7 days, however, all ARs were not significant. For the equally weighted portfolio in Figure 3, we recorded no significant CARs throughout the period and we can observe no significant trend. So, while the variability of returns increases, no significant trend in either direction is actually detected.
Numeraire denominated returns  for an equally weighted portfolio.

Numeraire denominated cumulative abnormal returns  for an equally weighted portfolio.

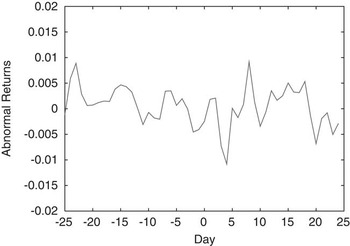
The same weighting technique applied to the market model ARs in section 5.2, when used for the numeraire denominated returns, eliminates the apparent variability observed in Figure 2. The new portfolio, defined here as an inverse variance weighted portfolio of numeraire denominated returns, was constructed with the returns shown in Figure 4. This portfolio eliminates event induced variance from the observed returns, see section 5. The graphical variability after the event day t = 0 is absent and insignificant ARs and CARs are observed over the event period. No particular trend is observed either, as shown by the CAR in Figure 5. In fact, the variability of benchmarked returns has been reduced by a factor of 10 using the inverse variance weighted portfolio. The tables have not been provided for brevity; no individual abnormal return was statistically significant for either portfolio.
Numeraire denominated abnormal returns  for an inverse variance weighted portfolio.

Numeraire denominated cumulative abnormal returns  for an inverse variance weighted portfolio.

6.2 Market and Fama-French models
Under the market model approach, catastrophic insurance events appear to have a positive impact on insurance firm value. Statistically significant positive abnormal returns were detected at various days after the event. The cumulative abnormal returns were also statistically significant and positive after some delay, using the two testing methods that eliminate event induced variance and cross sectional dependencies, outlined in section 5. Though statistically significant, no attempt is made in this analysis to determine if these results are economically significant. The absence of transaction costs and other market frictions in observing the positive reaction is therefore assumed.
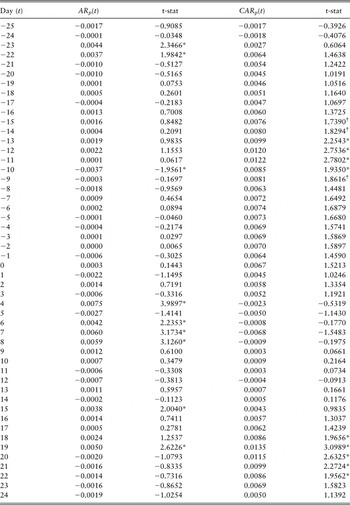
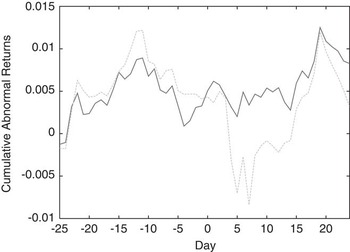
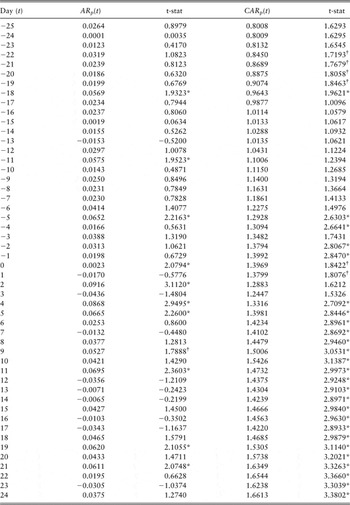
Table 3 illustrates the AR and CAR over the event period using the non-dependent adjustment method. This table indicates that on the event day, t = 0, no immediate significant reaction occurs. However, after a four day delay significant negative returns are evident for the ARs. The CARs are significantly negative, 7 days following an event, and significantly positive CARs are observed 18–21 days following the event day. This test does not incorporate allowances for cross-sectional dependencies or event-induced variance and so the results cannot be classified as being statistically reliable. For all tables in this section, * and † denote significance at the 0.05 and 0.10 levels respectively.
Market model AR and CAR using the non-dependent adjustment method.
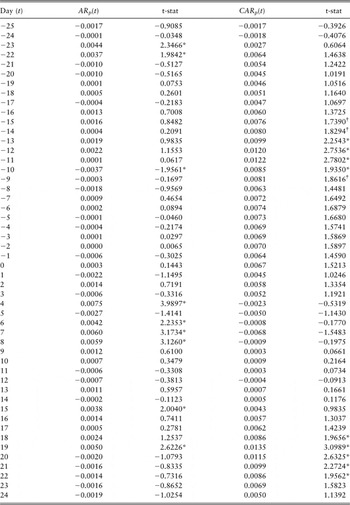
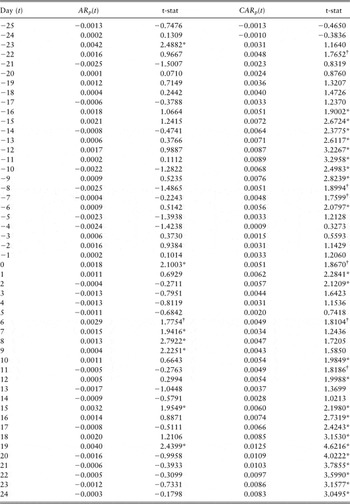
The modified weighted least squares approach compensates for strong dependencies across securities and is therefore the preferred method. Table 4 illustrates the results from the modified least squares method. There are significantly positive returns on the event day t = 0, and also at t = 6,7,8,9,15 and 19 after the event day. In addition, there are significantly positive cumulative abnormal returns around the event date and from t = 15 to t = 24.
Market model AR and CAR using the modified weighted least squares method.

Noting the event day at t = 0, Figure 6 illustrates the cumulative abnormal returns using both the simple non-dependent adjustment method and the modified least squares method for the market model approach.
Modified weighted least squares (solid line) and non-dependent adjustment (dashed line) cumulative abnormal returns for all catastrophic events.

After a delay of 12 days, the CAR for the insurance sector relative to the market appears to show significant positive returns under the modified weighted least squares method. Similar AR and CAR profiles are observed when using the Fama-French three-factor model (FF3F) approach, although the errors are much reduced. These results are broadly aligned with those obtained in Shelor et al. (Reference Shelor, Anderson and Cross1992). They attribute the positive increase in their study to anticipated increases in the demand for insurance dominating the expected rapid depletion of surplus accounts and perceived losses to insurance firms. The statistically significant results using the traditional market model approach and the FF3F model are, however, caused by biases in the regression and are not always reliable, as illustrated in section 4.
Table 5 illustrates the AR and CAR results over the event window using the FF3F model and the modified weighted least squares test statistic approach. Similar to the market model results in Table 4 positive ARs are observed around the event date and for several days after the event. Positive CARs are observed from t = 3 to t = 24.
Fama-French three factor model (FF3F) AR and CAR using the modified weighted least squares method.

In contrast to the NDRA results of no significant returns, both the MMA and FF3F models show positive ARs and CARs around the event date and for several days after the event.
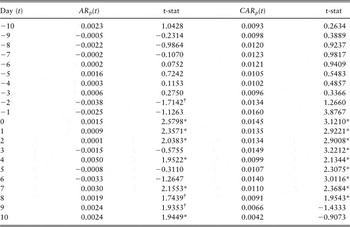
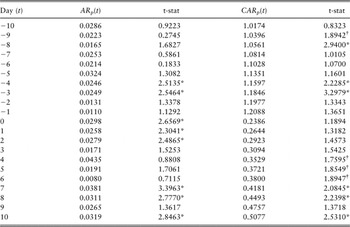
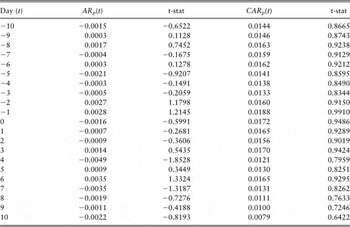
If we examine a single catastrophic event instead of a portfolio of events we obtain similar results. We consider the severe flood event on 30 November 2010 in Queensland which resulted in insured losses of US$3.4 billion. The event window was not affected by event-induced variance as defined by Hamilton (Reference Hamilton1989) and was free from contamination under the TSMM from equation (24) (Aktas et al. Reference Aktas, de Bodt and Cousin2007). The results of the abnormal and cumulative abnormal returns for the market model, FF3F and NDRA for this single event are given in Tables 6 to 8. The event window has been abbreviated to t = −10,…,10. Significant positive returns using the modified weighted least squares method are observed for the MMA and FF3F model while no abnormal returns were detected for the NDRA.
Market model AR and CAR using the modified weighted least squares method for a single flood event 30 November 2010.

Fama-French three factor model (FF3F) AR and CAR using the modified weighted least squares method for a single flood event 30 November 2010.

Numeraire denominated returns approach (NDRA) AR and CAR using the modified weighted least squares method.

Finally to control for potential contamination of the portfolio of event windows the TSMM statistic of Aktas et al. (Reference Aktas, de Bodt and Cousin2007) is used as a comparison with both the simple non-dependent adjustment method and the modified least squares method. The TSMM test statistic results weakly dominate the non-dependent adjustment test and the modified least squares test. However, in our analysis the degree of dominance was significantly less than the levels identified in Aktas et al. (Reference Aktas, de Bodt and Cousin2007). The number and timing of statistically significant AR and CAR results during each event window did not change, which suggests that on a portfolio basis the event windows were largely free from contamination. TSMM test results can be obtained from the author upon request.
7. Testing the Differences Between Models
These results demonstrate that statistically significant abnormal returns are observed for catastrophic insurance events using the market model and Fama-French approach. However, when using the NDRA the errors induced from parameter estimation under the market model disappear and the true abnormal returns are observed, with reference to a numeraire. The numeraire used here is the growth optimal portfolio (GOP). We now consider if the results obtained under the NDRA are robust for use in testing market efficiency.
It is clear that the abnormal returns obtained under both the MMA and the FF3F model violate the results produced in the benchmark theory of Long (Reference Long1990) and Bühlmann & Platen (Reference Bühlmann and Platen2003). This suggests that the market model and Fama-French three factor model provide an inefficient representation of expected returns. The abnormal returns, or, more formally, the supermartingale property of benchmarked returns is, however, maintained using the NDRA. Benchmarked returns therefore provide a more comprehensive view of expected returns for testing market efficiency. We now examine each approach with reference to the EMH.
Fama (Reference Fama1998) concluded that identifying the presence of long-term anomalies in ARs in a data set is sensitive to the methodology used. We can extend this assertion here since we have shown that in the short-term, detecting anomalies in observed ARs is also sensitive to the methodology. ARs tend to become marginal or, as shown here, even disappear when exposed to different models for expected returns or when different statistical approaches are used to measure them. It can be said that the incorrect specification of the market model for a number of securities, whose covariance with the market proxy is limited, contaminates the test for efficiency, and is thus a “bad” model problem, see Fama (Reference Fama1998). The “bad” model problem grows as the return horizon increases, such that spurious ARs eventually become statistically reliable in CARs. This is due to the fact that while the mean of the CAR increases by the number of days included in the event period at the rate t, the standard error of the CAR increases at the rate of  .
The anomalies observed under the market model and Fama-French model have clearly disappeared under the NDRA. Given the evidence in favour of the EMH it remains for us to strengthen our argument in testing the dependence of the conclusions with reference to the EMH on the particular model used.
Like all asset pricing models, the market model and other factor models provide an incomplete description of expected returns. While the shortcomings of this approach are well known, it is useful to compare the results obtained under this approach with the results obtained under the NDRA.
If we can show that the results underlying each model are significantly different in a statistical sense, then we can say with some confidence that one model must offer a better representation of the true abnormal returns than the other. In this section, we shall use some parametric tests to investigate the differences between the two sample distributions. Specifically, we shall test the differences in the basic statistics that characterise the distribution of residuals obtained under both approaches.
The construction of each approach outlined in section 4 implicitly assumes that

where ηz is the residual from model z, z ∈ {a, b}. Here a refers to the market model approach and b to the NDRA. If both approaches yield similar results, then the pairwise comparison test of the form

will hold, where  is the residual obtained from the market model approach and
 is the residual obtained from the NDRA.
An interesting question is now posed concerning the results obtained from each model. We know from the empirical tests in section 6 that both models yield different results. Testing for the “correct” model is however, dependent on the underlying assumptions for the efficient markets hypothesis (EMH). If catastrophic events convey new information to the market, then we are directly testing different conclusions about market efficiency. If catastrophic events do not convey new information to the market, then we are only testing differences between models. If one strongly believes that markets are efficient, then the conclusion would be that the true model is the one that fails to reject the EMH at a given confidence level. If we therefore assume the null hypothesis of the EMH, and indeed much of the literature supports the EMH, then the model which supports the null of equation (25) is the “correct” model. If, however, we find that the null hypothesis assumes that all models fail to reject the EMH, therefore, if validated, we say the evidence for the EMH is not conditional on the underlying model and the null hypothesis of equation (26) should hold. Given the recent evidence in the capital markets which fail to reject the EMH, with reference to the null hypothesis implicit in equation (25), it is clear that, from these assumptions, the NDRA is the more appropriate or “correct” model. The market model approach has been shown to be subject to significant calibration errors, and it is also limited by the stability of the correlation between individual securities and the market proxy. The Fama-French three factor model suffers from the above limitations but has been shown to be a significantly more efficient model than the market model. The use of the NDRA however offers a natural measure of abnormal returns with respect to the market itself. When compared with the factor models, this is a powerful argument in favour of the NDRA. We now need to test the differences between models to show that the market model approach is inaccurate and is, therefore the “incorrect” model in this example.
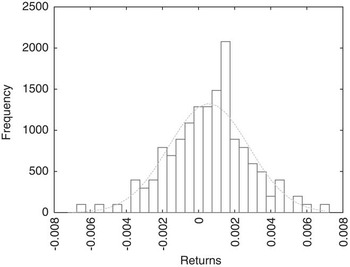
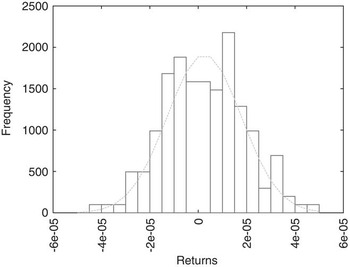
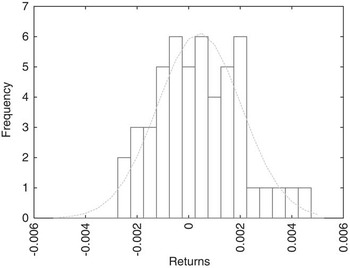
The numeraire denominated returns for both the equally weighted portfolio and the inverse variance weighted portfolio are Gaussian, as shown in figures 7 and 8. The Jarque-Bera statistics are 2.6133 and 0.2257 for the equally weighted and inverse variance weighted portfolio residuals, respectively, which, as expected under the EMH, suggests the residuals generated under the NDRA are normally distributed. In fact, the inverse variance weighted portfolio of residuals exhibit statistics for its distribution that are almost indistinguishable from the normal.
Histogram of numeraire denominated residuals for an equally weighted portfolio and the normal distribution.

Histogram of numeraire denominated residuals for an inverse variance portfolio and the normal distribution.

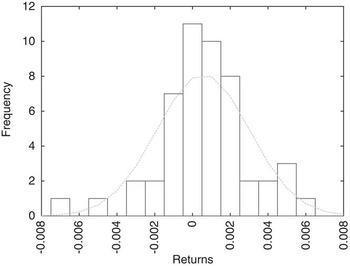
For the market model, both the standardised cross sectional portfolio and the modified weighted least squares portfolio of returns are also Gaussian with Jarque-Bera statistics of 3.9535 and 1.5372, respectively. Figures 9 and 10 illustrate the distribution of residuals compared with the normal distribution.
Histogram of market model residuals for the standardised cross sectional portfolio and the normal distribution.

Histogram of market model residuals for a modified weighted least squares portfolio and a normal distribution.

Assuming therefore that the residuals for both models are drawn from a normal distribution, we can conduct tests on the differences between the MMA and NDRA models. Firstly, we obtain a t-statistic for the mean difference between the two residuals, which is actually a test on the differences between means. This is computed as

for t ∈ {−25,…,24}, where  is the residual obtained from the market model approach,
 is the residual obtained from the NDRA and n is the number of residuals in the set, see Brenner (Reference Brenner1979).
Next, we estimate the correlation between the two sets of residuals via
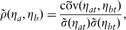
for t ∈ {−25,…,24}.
Finally, we calculate the Pitman statistic, which tests whether two dependent variances belong to the same population, as

for t ∈ {−25,…,24}, see Snedecor & Cochran (Reference Snedecor and Cochran1967). Table 9 presents the absolute averages of the above three statistics over the event window. The value for  is significant at the 5 percent level, which indicates a significant difference between the mean residuals of each model. The Pitman statistic
 is close to 1 since there is minimal correlation between the residuals of each model. From these tests, we can conclude that both approaches yield statistically significant different results and therefore the different approaches cannot simultaneously support the EMH.
Test statistics for the differences between both the market model (MMA) and the Fama French model (FF3F) with the numeraire denominated returns approach.

The, so called, robustness hypothesis for testing the EMH under different approaches in this example therefore fails. This is clearly a result of the inaccuracies in estimating step ahead returns using the market model and Fama-French approach. Assuming the EMH holds, as research evidence suggests, then it is clear that the NDRA provides a better description of expected returns over the short term. The various “bad” model problems that arise under the market model and Fama-French approach generate inaccurate expected returns in relation to the movement of the market proxy. Similar results to the market model approach were reached using the above analysis for the Fama-French model. “Bad” model problems are unavoidable, however, their effect can be vastly reduced through the use of a numeraire portfolio and the benchmark technique.
8. Catastrophe Size and Market Reaction
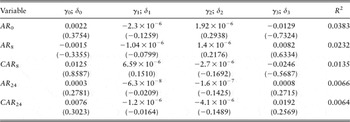
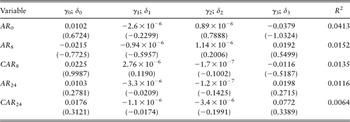
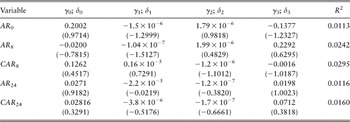
Before concluding, one obvious question that needs to be addressed concerns the relation between the size of the catastrophe and the subsequent reaction implicit in ex post security returns by the market. It is generally assumed by most investors and other market participants that larger catastrophes will have a greater impact on security prices than smaller events, see Shelor et al. (Reference Shelor, Anderson and Cross1992). If the market model is in fact the “correct” model, then one would expect a relationship between the size of the loss and the reaction by the market to exist. Therefore, a simple regression was conducted where the insured loss, total loss and the insured to total loss ratio were regressed against the abnormal returns and cumulative abnormal returns, obtained using the market model and Fama-French approach, at three points in time after each event – the event day t = 0, at t = 8 and at t = 24. Day t = 8 was chosen because this point represents the minimum observed CAR and day t = 24 was chosen since this point represents the maximum observed CAR for the market model methodology outlined in section 5.
The null hypothesis H 0 we seek to reject is that the abnormal returns and cumulative abnormal returns on days t ∈ {0, 8, 24} are not dependent on the size of the insured loss, the size of the total loss, and the size of the ratio of insured loss to total loss. Thus we will be testing the regressions

for t ∈ {0, 8, 24}, and

for t ∈ {8, 24}, where ILj ,t represents insured loss for event j, TLj ,t represents total loss for event j and (IL/TL)j ,t represents the ratio of insured loss to total loss for event j. The first null hypothesis we are attempting to reject is that the level of insured losses ILj ,t have no impact on the ARj ,t or CARj ,t at t ∈ {0, 8, 24} for event j, such that

The second null hypothesis we are attempting to reject is that the level of total losses TLj ,t have no impact on the ARj ,t or CARj ,t at t ∈ {0, 8, 24}, such that

Thirdly, we will attempt to reject the null hypothesis of the disparity between insured losses against total losses (IL/TL)j ,t having no impact on the ARj ,t or CARj ,t at t ∈ {0, 8, 24}, such that

From table 10 we fail to reject the null hypotheses  for days t ∈ {0, 8, 24} for all events j since these results are not significantly different from zero. The lack of significance in the statistics implies that there is no real relationship between abnormal returns observed in insurance securities using the market model and the Fama-French model, and the readily observable factors that surround identifiable catastrophic insurance events. The regression statistics are presented in tables 10 and 11. The t-statistics are in parentheses.
Regression of losses against ARt and CARt for t = 0, 8, 24 for the market model (MMA).

Regression of losses against ARt and CARt for t = 0, 8, 24 for the Fama-French three factor model (FF3F).

A regression was also conducted using market adjusted returns under the NDRA corresponding to the same hypotheses, which obtained similar results, as per table 12.
Regression of losses against ARt and CARt for t = 0, 8, 24 for the numeraire denominated returns approach (NDRA).

This strengthens the argument in favour of failing to reject the EMH, and it also confirms that the NDRA for event studies, where securities are somewhat dependent and are subject to event induced variance, is a more efficient alternative than the traditional market model or factor model approach.
9. Conclusion
We have shown that using the NDRA offers a natural measure of abnormal returns. This method is more powerful than the traditional market model and the Fama-French three factor model. We have shown how this can be applied to test the EMH in the Australian insurance sector. The NDRA for testing the EMH, given the proposition that expected proxy-denominated stock returns are zero, can be applied to test a variety of anomalies in both the short- and long-term. This yields results consistent with the findings in this paper, thus strengthening the EMH assumption in capital markets. Furthermore, the use of the NDRA avoids the step-ahead estimation errors implicit in using the market model approach and estimation errors due to, among other things, the presence of momentum when using the Fama-French three factor model. The NDRA is flexible, simple and robust and can be applied to many other areas of finance to test for inefficiencies, so long as a representative numeraire or GOP is available.
Appendix: Catastrophic Events – Australia 1983–2011
Table 13 outlines all catastrophic events that qualify for analysis in this study. The conditions set were estimated insurance losses greater than $5 million, total loss greater than $100 million and a minimum degree of information leakage. The dates given are the actual dates where it became apparent that substantial loss was likely. In the case of cyclones, floods and bushfires, this can be several days prior to the actual incident. For example, the predicted paths of cyclones once they move in close proximity to coastal Queensland and Western Australia are reasonably well understood and therefore the event date was set two days prior to the cyclone making landfall. This data was obtained from the EMA Disaster Events Tracking System through Emergency Management Australia, Canberra (2011).
Catastrophic events with losses greater than $100 million – Australia 1983–2011.