


The article by Jack Goldstone, Dating the Great Divergence, has the merit of discussing both the wide panorama of recent global history and the conclusions stemming from specific north-European long-term series of GDP.Footnote 1 The article’s main target is the deeply rooted idea that Modern Growth was the continuation of previous trends of GDP growth. Goldstone’s opinion is that the rise of the West, in the frame of global history, occurred only from the late-eighteenth century or the beginning of the Nineteenth, not earlier. At the time, a true divergence among World economies did not exist. Modern Growth is different from previous periods of expansion not merely in the degree but also in the nature. Pre-modern examples of growth were episodic and not sustained; they represented temporary ‘efflorescences’ rather than long upward rises.Footnote 2
It is apparent that, in such an approach to growth, problems of definition are crucial. Since the modern rise is deemed to be different from past ‘efflorescences’ of sporadic growth, what is, according to Goldstone, the primary feature of “modern” in comparison with ‘pre-modern’? The definition of Modern Growth adopted by Goldstone is the classical one put forward in economics and historical research primarily by Simon Kuznets:Footnote 3 it is characterised both by strong increases in population and production; growth in production is, however, higher than in population. The result is then a rise in per capita product or intensive Footnote 4 growth. This rise is sustained for long periods of time and primarily derives from modern technological growth. This definition of Modern Growth, rapidly recalled by Goldstone in his present article, had been more widely discussed in his previous article on efflorescences and economic growth in World history.Footnote 5
In the following, I will deal with the differences between modern and pre-modern growth and later with the concept of technological progress in relation to the rise of the West. I will focus primarily on Europe and the Mediterranean and will include extra-European macroareas at the end.
Growth: modern and pre-modern
Looking both at the product of past economies and at proxies of growth, there is no denying that, according to the specific Kuznets’ definition of Modern Growth, Goldstone is right.
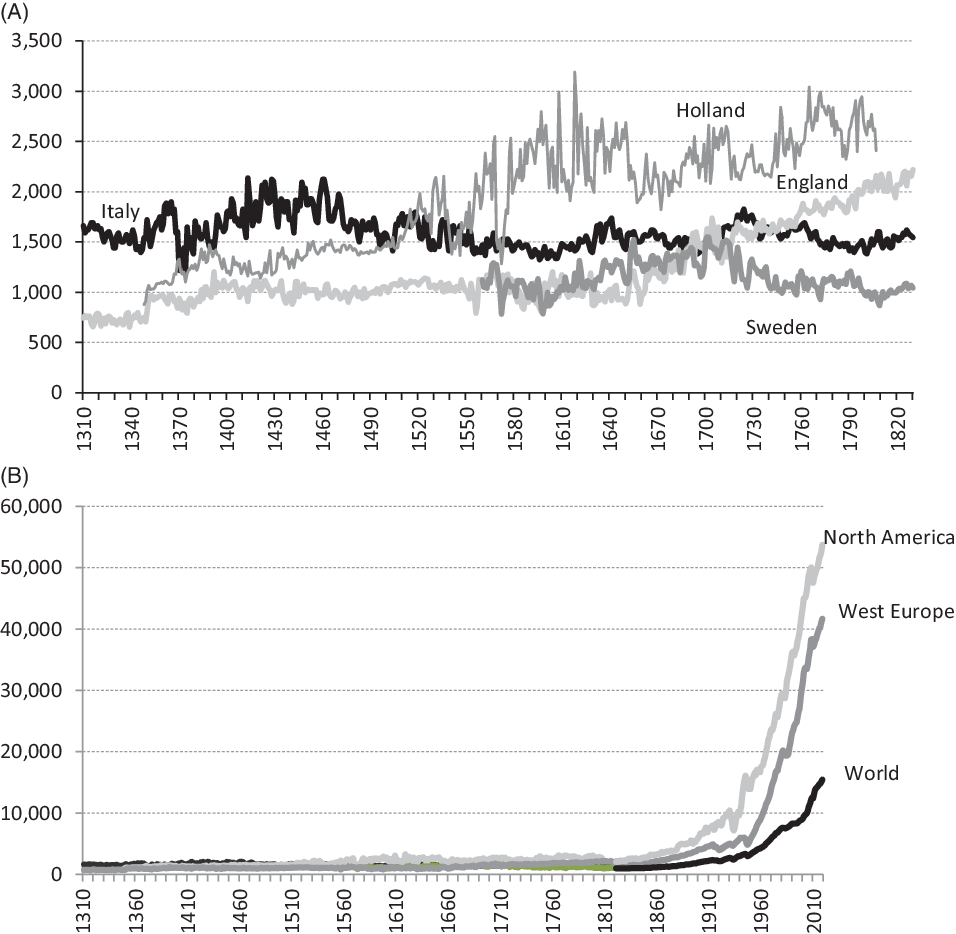
In Figure 1(A), I report four series of per capita GDP: one for the Centre and North of Italy and the others for three northern European countries; two of which, Holland and England, are objects of Goldstone’s critical remarks. The last one refers to the northernmost Sweden. The series could be increased with the inclusion of those relating to Spain,Footnote 6 Portugal,Footnote 7 Germany,Footnote 8 FranceFootnote 9 and Poland.Footnote 10 The European picture would become more detailed, yet the profile would not substantially change.
Per capita GDP in North-Central Italy, Holland, England and Sweden in 1310–1830 (in Geary-Khamis 1990 $ PPP) (A) and per capita GDP in the same countries and in North America, Western Europe and the World in 1310-2010 (in 2011US$) (B).
Sources: England: Stephen Broadberry, Bruce Campbell, Alexander Klein, Mark Overton, Bas Van Leeuwen, British economic growth, 1270–1870, Cambridge: University Press, 2015 (the series of UK from 1700 is adjusted to that of England through Angus Maddison, The World economy, I, OECD 2001, p. 247); north-central Italy: Paolo Malanima, ‘The long decline of a leading economy: GDP in Central and Northern Italy, 1300–1913’, European Review of Economic History, 15, 2, 2011, pp. 169-219; Holland: Jan Luiten Van Zanden, Bas Van Leeuwen, ‘Persistent but not consistent: The growth of national income in Holland 1347–1807’, Explorations in Economic History, 49, 2,2014, pp. 119–30; Sweden: Lennart Schön, Olle Krantz, ‘The Swedish economy in the early modern period: constructing historical national accounts’, European Review of Economic History 16, 4, 2012, pp. 529–49. The series for World, West Europe, North America are personal elaboration of Maddison Project Database, version 2018. Jutta Bolt, Robert Inklaar, Herman de Jong, Jan Luiten van Zanden (2018), ‘Rebasing ‘Maddison’: new income comparisons and the shape of long-run economic development’, www.ggdc.net/maddison.

What strikes, first and foremost, is the high volatility of previous examples of growth, so different from the relatively smooth modern series (at least for developed economies). Pre-modern growth is not sustained over time, but highly variable in the short run. As regards to the long-term profile, we see that the Dutch series reveals a rising trend in the sixteenth century, although interrupted by frequent falls, and followed, from the end of the seventeenth, by ups and downs without a clear trend. The yearly rate of growth in 1500–1807 was equal to 0.16. Sweden and Italy seem to enjoy some favourable decades in the seventeenth century, but to stagnate or decline later on. England as well progresses in the seventeenth century, but seems to slow down in the second half of the following century and recover only later. With the partial exception of Holland, a small province of The Netherlands, the other three curves seem to rise in per capita terms when population stagnates in the seventeenth century and seem to stagnate or decline when population rises in the eighteenth century. Both for Italy and England, the demographic fall after the Black Death is marked by increase in per capita product. Thus, the main features of Modern Growth, that is GDP per capita rise sustained in the short run and increasing for long periods of time (according to the definition by Kuznets), do not seem to characterize these examples of pre-modern economic dynamics.
If the little divergences in their pre-modern profile are looked at from the perspective of the later modern rise from 1820 in western Europe, northern America and the World on the whole, these divergences disappear altogether. The sharp bend after 1820 was preceded by small oscillations around a straight line and nothing else. Both the nature and degree of pre-modern growth, in comparison with the modern rise, were deeply diverse. This is the conclusion we could draw from Figure 1(B).
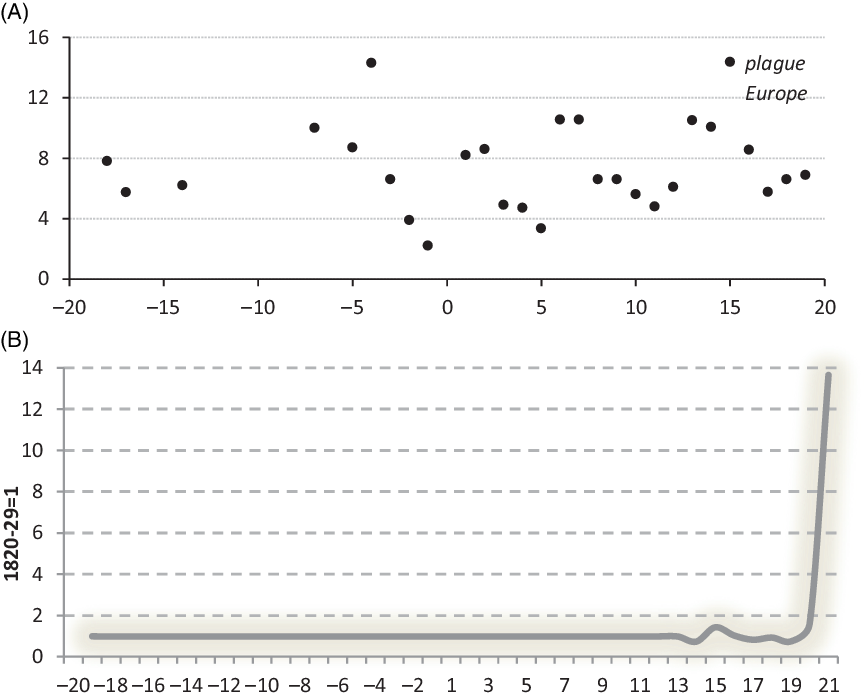
To many scholars, series of real wages seem to be more reliable than series of GDP especially for far in time epochs. In Figure 2(A), daily real wages of unskilled workers in the euro-Mediterranean economy from the eighteenth-century BCE until the thirteenth-century CE are represented by the few data points available for the Southern Mediterranean and Near East (Mesopotamia, Greece, Egypt). This series is complemented by the average wages, per half century, of unskilled workers in northern Italy and England, deflated by the cereal price (the only method of deflation we can use in these cases) spanning the period 1300–1800.Footnote 11 All in all we can avail of only 28 data points along 4,000 years. Few indeed! Of these 28 data points, 24 stay between 4 and 12 liters of cereal per day and do not describe any trend. The perspective we draw from the first graph (A) is that of oscillations around a straight line in a relatively narrow range of values. Whenever we include the last two centuries (Fig. 2(B)), the long-term history of the euro-Mediterranean civilisations from the viewpoint of real wages draws a straight line before the recent discontinuity with a rise of 13–14 times in two centuries. The overall profile of real wages confirms the stability we find in pre-modern series of per capita GDP.
Daily real wages of unskilled building workers in the euro-Mediterranean world from eighteenth centuries BCE until 1800 CE (in A) and a long-term trend of real wages in the last 4000 years (in B).
Sources: Data until the 13th century are from Walter Scheidel, ‘Real wages in early economies: evidence for living standards from 1800 BCE to 1300 CE’, Journal of the Economic and Social History of the Orient, 53, 3, 2010, pp. 425–62 and Walter Scheidel, Roman wages in context, in François De Callataÿ, Quantifying the Greco-Roman economy, Bari: Edipuglia, 2014, pp. 209–18.The grey band around the curve (in B) represents the range of variation. Data for 1820-2000 are taken from Pim De Zwart, Bas Van Leeuwen, Jieli Van Leeuwen-Li, ‘Real wages since 1820’, in Jan Luiten van Zanden, et al.(eds.), How was life? Global well-being since 1820, OECD, 2014, pp. 73-89. For more information see also Paolo Malanima, ‘Wages: ancient, medieval, modern’, in Marco Maiuro, Giovanna Daniela Merola, Mauro De Nardis, Gianluca Soricelli (eds.), Uomini, istituzioni, mercati. Studi di storia per Elio Lo Cascio, Bari: Edipuglia, 2019, pp. 493–504.

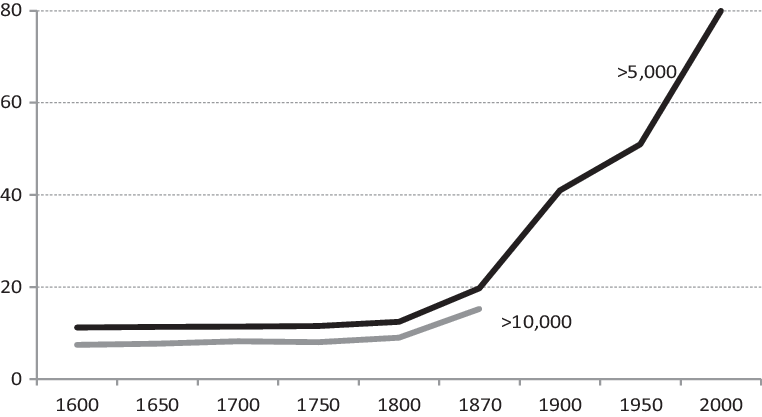
Data for urbanisation are among the best proxies of long-term economic growth and structural change for past economies. Figure 3 summarises the available data for Europe on the whole relating to centres with over 5,000 inhabitants in 1600–2000. We cannot but simply repeat what E.A. Wrigley wrote in 1991, that is that ‘continental Europe was little if at all more urbanised in 1800 than in 1600, and indeed that it is possible that there was no significant change between 1400 and 1800.’Footnote 12 Again, a sharp bend distinguishes the distant past before 1800 from the recent development. The main indicator of structural change in pre-modern World does not reveal any growing trend until 1800.
Urbanisation rates in Europe between 1600 and 2000 (centres with over 5000 and over 10,000 inhabitants).
Sources: until 1870: Paolo Malanima, ‘Urbanisation 1700–1870’, in Stephen Broadberry and Kevin O’Rourke (eds.), The Cambridge Economic History of Modern Europe, Cambridge: Cambridge University Press, 2010, I, pp. 236–64 and, from 1900 until 1990, Paul Bairoch, Storia delle città. Dalla proto-urbanizzazione all’esplosione urbana del terzo mondo, Milano: Jaca Book, 1992, p. 53. The estimate for the year 2000 has been computed from the trend.

Viewing the past in the light of the present, pre-modern growth appears neither sustained in time nor higher than the growth in population (if not episodically), nor conducive to the structural changes we associate with Modern Growth. We could go back in time and quote the sparse information on GDP now available for ancient Greece, Roman empire, Byzantium and even for non-European countries from China to Latin America. The view would only add examples that confirm this conclusion. All in all, the main indicator of growth, that is GDP per head of past civilisations, stayed within a narrow range of values, with ups and downs between 1 and 3 and no more (ordinarily less), before the hockey stick curve of the last two centuries, when the rise became sustained in time and fast as never before.
Revolutions in technology
The recent break with the past occurred thanks to a big change in the capacity to produce, which occurred in Europe and North America at first and other World countries later after a stability of five-six millennia. It is quite strange that in the literature on this cut with the past, scholars rarely include a central theme, that is the change in the capacity to do work or the change in the exploitation of energy. E. A. Wrigley, long time ago, stressed the topic of the limitations in energy use in the ‘organic’ or biological energy systems of the past.Footnote 13 Yet, the theme of energy availability only peeks out in the reconstructions of the long-term changes in past economies. While the literature abounds in data on the level of per capita GDP at the start of the nineteenth century, estimates of energy exploitation for the same period are almost completely lacking.
Until the energy revolution that occurred in the last two centuries, the main big changes in energy use were few.Footnote 14 A crucial change occurred in about 6000–3000 BCE, with the domestication of working animals. To the input of food for the human beings and the exploitation of fire, a third important source was added. The exploitation of the animals’ work added something such as 20–30 percent to the energy budget of the traditional agrarian economies and increased the capacity to do work drastically. Population rose, in these three millennia, from 10 to 150 million.Footnote 15 A first, urbanisation flourished. It was a main example of extensive growth, based, that is, on the rise of gross product rather than on the improvement of living standards.Footnote 16 In this second phase of the neolithic agricultural revolution, once called the Urban Revolution,Footnote 17 extensive growth was primarily supported by the work of draft animals.Footnote 18 The birth of the cities, the formation of military, political and religious elites were the results of the rise in the overall capacity to do work. It is well known that some progress in the energy endowment occurred in the ensuing agrarian societies with the exploitation of wind and water power.Footnote 19 Some gains in efficiency occurred as well. These changes, however, added less than 1 percent to the budget of energy of the agrarian societies from the Urban Revolution until recent industrialisation. In the agrarian traditional societies, for millennia, the daily budget of energy remained between 6,000 and 12,000 calories per head. This stagnation defined the capacity to do work of those economies. The stability of wages, incomes and urbanisation were the main consequences. Forms of modern growth, based fundamentally on the rise of the productive capacity, were simply out of reach until the recent revolution of fossil sources of energy.
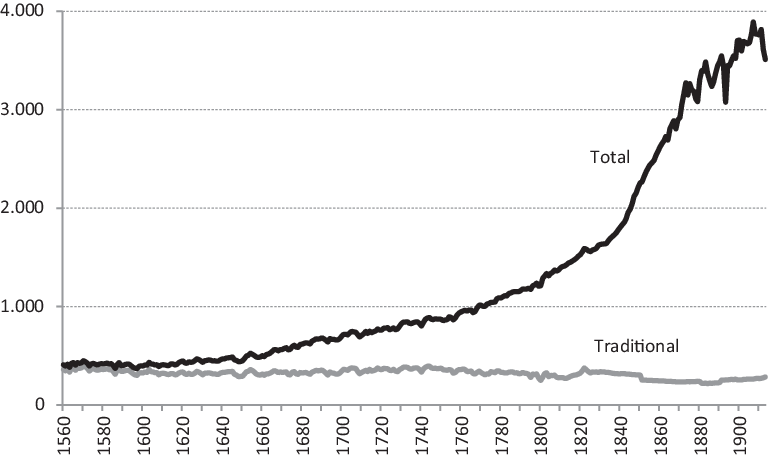
If we introduce energy in the context of the little divergence, the thesis by Goldstone could appear at first less convincing. After all, we could argue, a little divergence was actually taking place in the sixteenth, seventeenth and eighteenth centuries, since in the growing economies of the time, and specifically Holland and England, new sources of energy were beginning to be widely exploited. Holland, however, only experienced a wider exploitation of sources of energy well known for a long time, such as wind and peat.Footnote 20 In England, coal exploitation was well known already when Romans conquered the island. No doubt, however, that since the end of the sixteenth century, while the traditional sources of energy were stagnating and then diminishing, coal exploitation was advancing, such as we see in Figure 4.
Per capita energy consumption in England & Wales 1560–1913 (koe per year).
Source: Paolo Malanima, ‘Energy consumption in England and Italy, 1560–1913. Two pathways towards energy transition’, Economic History Review, 69, 1, 2016, pp. 78–103.
Note: a koe is equal to a kg of oil equivalent, that is 10,000 kcal.

In the graph, the difference between the curves represents the contribution of coal to the energy budget. At the end of the eighteenth century, coal was beginning to be exploited also in Belgium, Germany, France, Poland, and its use had been traditional in China, at least since the late Middle Ages.Footnote 21 Both in England and elsewhere, however, what was progressing was the thermal use of coal and not yet the mechanical use, that is the true modern revolutionary innovation in the use of energy able to support and replace human work. In 1750, in England, only 1 percent of coal was used for mechanical work.Footnote 22 In 1800, it had risen to 8–10 percent.
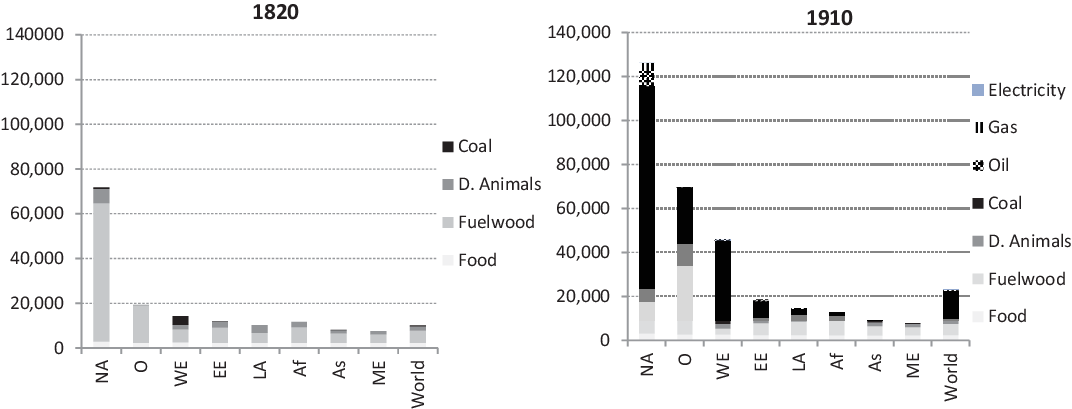
Figure 5 represents the energy consumption per macroarea in 1820 World. The graph can complement and specify what we know on per capita GDP at the time. The advantage of a view of the World economy from the side of energy is that we are dealing with physical quantities and not hard to compare monetary values.
Per capita energy consumption in eight macroareas and the World in 1820 and 1910 (kcal per day).
Source: Paolo Malanima, ‘The limiting factor: energy, growth, and divergence, 1820–1913’, Economic History Review, 2020, pp 486–512.
Note: NA Northern America; O Oceania; WE Western Europe; EE Eastern Europe; LA Latin America; Af Africa; As Asia; ME Middle East.

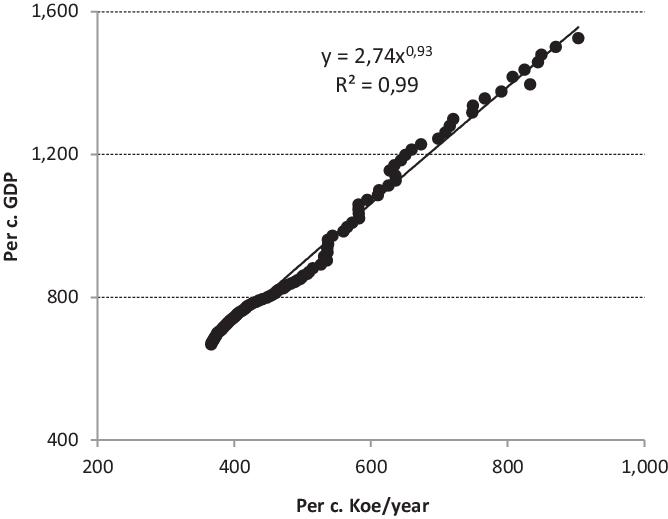
In 1820, the World’s average consumption per capita per year was in the order of 370 koe, that is about 10,000 kilocalories per day (in 2018, it has been, respectively, 2,100 koe per year or hardly less than 60,000 kcal per day). The progress of the new was still quite limited, at the time. In 1820, coal represented only 7 percent of the World total consumption, hardly less than 70 percent of coal was consumed in England. A divergence among macroareas in the use of energy did not appear at that time. A very high level of consumption of energy existed only in North America, that is in Canada and USA, although coal was hardly in use and represented 1 percent of their total consumption. The high level of consumption depended here on the low density of population and the abundance of wood, draft animals and food, that is the three components of the old energy regime. In Oceania as well, per head energy consumption was high (twice the World average) and in 1820 coal was not consumed at all. In the rest of the World differences in energy consumption were still modest indeed and mainly depended on different climates and different agricultural systems. Higher energy budgets did not imply yet higher living standards. Equality still prevailed in the world of energy. The break-in of the new occurred in the nineteenth century, such as the graph depicts. In 1910, per capita level of energy consumption was more than twice that of 1820: about 23,000 calories per day in comparison with 10,000. The difference was due to coal and still marginally to the rising use of oil, natural gas and hydroelectricity. The equality among countries of the pre-modern world was being replaced by the divergence typical of the modern economy. GDP per capita and energy per capita were rising at the same pace, such as Figure 6 reveals.
Relationship between GDP per capita (in 1990 US$) and energy per capita (in koe) 1820–1913.
Source: Energy: Paolo Malanima, ‘The limiting factor: energy, growth, and divergence, 1820–1913’, Economic History Review, 2020; GDP: personal elaboration of Maddison Project Database: Maddison Project Database (2013 edition) in: https://www.rug.nl/ggdc/historicaldevelopment/maddison/releases/maddison-project-database-2018

Conclusion
Energy consumption defines the capacity to do work of a given society. The biological system of energy of the agrarian societies represented the inner limiting factor of those civilisations, to use a chemistry term coined by Justus Liebig. Marginal progresses in the capacity to do work occurred from the advanced phase of the agricultural revolution, or urban revolution, until about 1800. In these millennia, phases of growth took place: the efflorescences Goldstone speaks of. Goldstone is right on the point. The main features of these pre-modern growths were the limited range of variation in per capita GDP, its volatility, its short-term duration, its coincidence with periods of population decline (frequently although not always). These inner features of pre-modern growth markedly distinguish edit from the recent Modern Growth. This does not mean that short-term periods of GDP per capita rise did not exist in the agrarian civilisations. They could derive both from advances in labour productivity and from institutions able to use the known resources more efficiently. All these phases of pre-modern growth or efflorescences, in the definition by Goldstone, were, however, nothing more than ripples in the narrow range of values of the individual incomes and standards of living.