1. Introduction
In marine environments, subsurface hydrocarbon generation, migration and release lead to formation of submarine cold seeps—sites where hydrocarbon-charged fluids are released into the water column (Campbell, Reference Campbell2006). Reduced compounds available at such sites are a resource for a lush macrofauna, chiefly chemosymbiotic bivalves and polychaete tubeworms (Dubilier et al. Reference Dubilier, Bergin and Lott2008), and diverse asymbiotic species supported by organic matter produced due to chemosynthesis. Apart from the fauna, another distinct feature of submarine hydrocarbon emissions is precipitations of authigenic carbonates, which form due to the process of microbially mediated anaerobic oxidation of methane (AOM; Boetius et al. Reference Boetius, Ravenschlag, Schubert, Rickert, Widdel, Gieseke, Amann, Jørgensen, Witte and Pfannkuche2000). Due to their peculiar formation mechanisms, the methane-derived authigenic carbonates are typified by distinct geochemical and petrographic features, such as depletion in 13C, presence of 13C-depleted biomarkers typical of AOM-mediating microbial consortia, as well as lithological textures indicative of microbially facilitated carbonate formation (Peckmann & Thiel, Reference Peckmann and Thiel2004). Thanks to the above, carbonates formed at ancient seep sites can be rather easily recognized in the fossil record long after hydrocarbon seepage ceased (e.g. Peckmann et al. Reference Peckmann, Walliser, Riegel and Reitner1999, Reference Peckmann, Goedert, Heinrichs, Hoefs and Reitner2003, Reference Peckmann, Birgel and Kiel2009, Reference Peckmann, Kiel, Sandy, Taylor and Goedert2011; Himmler et al. Reference Himmler, Freiwald, Stollhofen and Peckmann2008; Amano et al. Reference Amano, Jenkins, Aikawa and Nobuhara2010; Hammer et al. Reference Hammer, Nakrem, Little, Hryniewicz, Sandy, Hurum, Druckenmiller, Knutsen and Høyberget2011; Hryniewicz et al. Reference Hryniewicz, Hagström, Hammer, Kaim, Little and Nakrem2015, Reference Hryniewicz, Bitner, Durska, Hagström, Hjálmrsdóttir, Jenkins, Little, Miyajima, Nakrem and Kaim2016; Kiel & Hansen, Reference Kiel and Hansen2015; Miyajima et al. Reference Miyajima, Watanabe, Yanagisawa, Amano, Hasegawa and Shimobayashi2016, Reference Miyajima, Watanabe, Jenkins, Goto and Hasegawa2018; Jakubowicz et al. Reference Jakubowicz, Hryniewicz and Belka2017; cf. Campbell, Reference Campbell2006).
Numerous fossil hydrocarbon seep carbonates and associated faunas have been previously reported from Japan (e.g. Hikida et al. Reference Hikida, Suzuki, Togo and Ijiri2003; Jenkins et al. Reference Jenkins, Kaim, Hikida and Tanabe2007; Amano et al. Reference Amano, Jenkins, Aikawa and Nobuhara2010, Reference Amano, Jenkins, Sako, Ohara and Kiel2013; Miyajima et al. Reference Miyajima, Watanabe, Yanagisawa, Amano, Hasegawa and Shimobayashi2016, Reference Miyajima, Nobuhara and Koike2017, Reference Miyajima, Watanabe, Jenkins, Goto and Hasegawa2018; cf. Majima et al. Reference Majima, Nobuhara and Kitazaki2005). They span from late Early Cretaceous (Albian; Kaim et al. Reference Kaim, Jenkins and Hikida2009) to Pleistocene in age, with nearly 100 sites listed in the last comprehensive review by Majima et al. (Reference Majima, Nobuhara and Kitazaki2005). A long-lasting record of ancient hydrocarbon seepage along the eastern (presently Pacific) shores of Japan in part reflects its geological history, where the active continental margin was especially predisposed for seabed fluid release (Sibuet & Olu, Reference Sibuet and Olu1998). The western (Sea of Japan) side of the Japanese Islands, on the other hand, was formed by complex tectonics during the Miocene, or perhaps earlier (Lallemand & Jolivet, Reference Lallemand and Jolivet1985; Ingle, Reference Ingle1992; Nakada et al. Reference Nakada, Yunagi and Maeda1997), with development of the back-arc basin and its subsequent inversion. This process is traceable there by a seepage history, with ancient seep deposits as old as the middle Miocene recording release of hydrocarbons to marine environments (Majima et al. Reference Majima, Nobuhara and Kitazaki2005; Amano et al. Reference Amano, Jenkins, Sako, Ohara and Kiel2013; Miyajima et al. Reference Miyajima, Nobuhara and Koike2017). Extant hydrocarbon seeps in the Sea of Japan offshore Niigata Prefecture, central Honshu, where hydrocarbon gases are released from breached anticlines along fault planes (Okui et al. Reference Okui, Kaneko, Nakanishi, Monzawa and Yamamoto2008), can be regarded as structural equivalents of some Miocene and Pliocene seeps, which have likely formed in similar structural settings (e.g. Amano & Kanno, Reference Amano and Kanno2005; Amano et al. Reference Amano, Jenkins, Aikawa and Nobuhara2010; Amano & Jenkins, Reference Amano and Jenkins2011a; Miyajima et al. Reference Miyajima, Watanabe, Jenkins, Goto and Hasegawa2018). Until now, the oldest chemosynthetic fauna in the Sea of Japan is from the lower Miocene Kurosedani Formation in Toyama Prefecture, central Honshu (Amano et al. Reference Amano, Miyajima, Nakagawa, Hamuro and Hamuro2019b). However, it is not associated with any carbonates indicating hydrocarbon seepage. In order to understand the relation between seepage activity and the formation of the Sea of Japan, it is necessary to examine any lower Miocene seep carbonates with chemosynthetic faunas from the Sea of Japan side.
In this paper we present a description of three seep carbonates from the lower Miocene Taishu Group, cropping out on the Tsushima islands, located at the western entrance of the Sea of Japan (Fig. 1). The Tsushima islands are located between the Eurasian continent and Japanese Islands, and are therefore important in understanding the ancient seep systems during the opening of the Sea of Japan back-arc basin. The carbonate bodies and associated chemosynthesis-based faunas from the Taishu Group have been previously reported by Ninomiya (Reference Ninomiya2011, Reference Ninomiya2012) and Ninomiya et al. (Reference Ninomiya, Shimoyama, Miyata, Yamanaka, Shimazu, Taniguchi, Aoki, Nishida and Takahashi2020) at four sites, along with the isotopic evidence for seep-related identity of two of these deposits (Ninomiya, Reference Ninomiya2012; Ninomiya et al. Reference Ninomiya, Shimoyama, Miyata, Yamanaka, Shimazu, Taniguchi, Aoki, Nishida and Takahashi2020). However, these tentative identifications of the chemosynthetic species are based on ill-preserved shells, which, in our opinion, allow for identification to the generic level only. Our study includes identification of chemosynthetic species to the species level based on better-preserved materials, and presents a comprehensive description of petrography, stable isotope geochemistry and organic geochemistry of three of the four known carbonate deposits from Tsushima. We also use optical and cathodoluminescence (CL) microscope imagery to reveal the degree of diagenetic alteration in these seep carbonates, and discuss the results in the general context of the diagenetic history of the Taishu Group. Finally, we place the seep carbonates of the Taishu Group in a broader geological context. As the lower Miocene seep carbonates from the Taishu Group are the oldest seep deposits from the Sea of Japan, we discuss early Miocene hydrocarbon seepage in Tsushima in relation to the geological events that shaped the Sea of Japan into the form seen today.
Study area and geological map of Tsushima, simplified after Miti (1972, 1973, 1974) and Ninomiya et al. (Reference Ninomiya, Shimoyama, Watanabe, Horie, Dunkley and Shiraishi2014). (a) Inset map with location of study area indicated. (b–d) Map showing location of Tanohama (b), Kanoura (c) and Fukuzaki (d) limestones.

2. Geological setting
Tsushima is located within the Korean Strait separating the island of Kyushu from the Korean Peninsula (Fig. 1). The two major islands forming Tsushima are Shimojima and Kamishima, and both are almost entirely composed of folded siliciclastics of the Taishu Group (Fig. 1) with subordinate volcanic tuffs, porphyric intrusives and rhyolite lavas (Miti, 1972, 1973, 1974). The group comprises three lithostratigraphic units, customarily called the Lower, Middle and Upper formations (Fig. 2), representing a succession of mudstones, sandstones and conglomerates deposited under marine and estuarine conditions influenced by northward-progradating river deltas (e.g. Nakajo, Reference Nakajo1998; Nakajo & Maejima, Reference Nakajo and Maejima1998; Ninomiya et al. Reference Ninomiya, Shimoyama, Watanabe, Horie, Dunkley and Shiraishi2014, Reference Ninomiya, Shimoyama, Miyata, Yamanaka, Shimazu, Taniguchi, Aoki, Nishida and Takahashi2020). The bulk of the Taishu Group represents marine sediments accumulated due to landslide activity in the palaeo-Tsushima Basin formed by pull-apart tectonics in the SW Sea of Japan. The materials supplied by submarine landslides came from surrounding shallow shelf areas and were transported to the base of the continental slope at a high sedimentation rate (Golozubov et al. Reference Golozubov, Kasatkin, Yokoyama, Tsutsumi and Kiyokawa2017). The palaeobathymetric estimates for at least the lower parts of the Taishu Group indicate water depths exceeding 800 m (Ninomiya et al. Reference Ninomiya, Shimoyama, Miyata, Yamanaka, Shimazu, Taniguchi, Aoki, Nishida and Takahashi2020).
Uncorrelated lithological columns of the Taishu Group in the southern (a), central (b) and northern (c) parts of Tsushima, with approximate stratigraphic position of the studied seep deposits indicated. Lithological columns after Miti (1972, 1973, 1974), stratigraphic position of the seep deposits after Ninomiya (Reference Ninomiya2011).
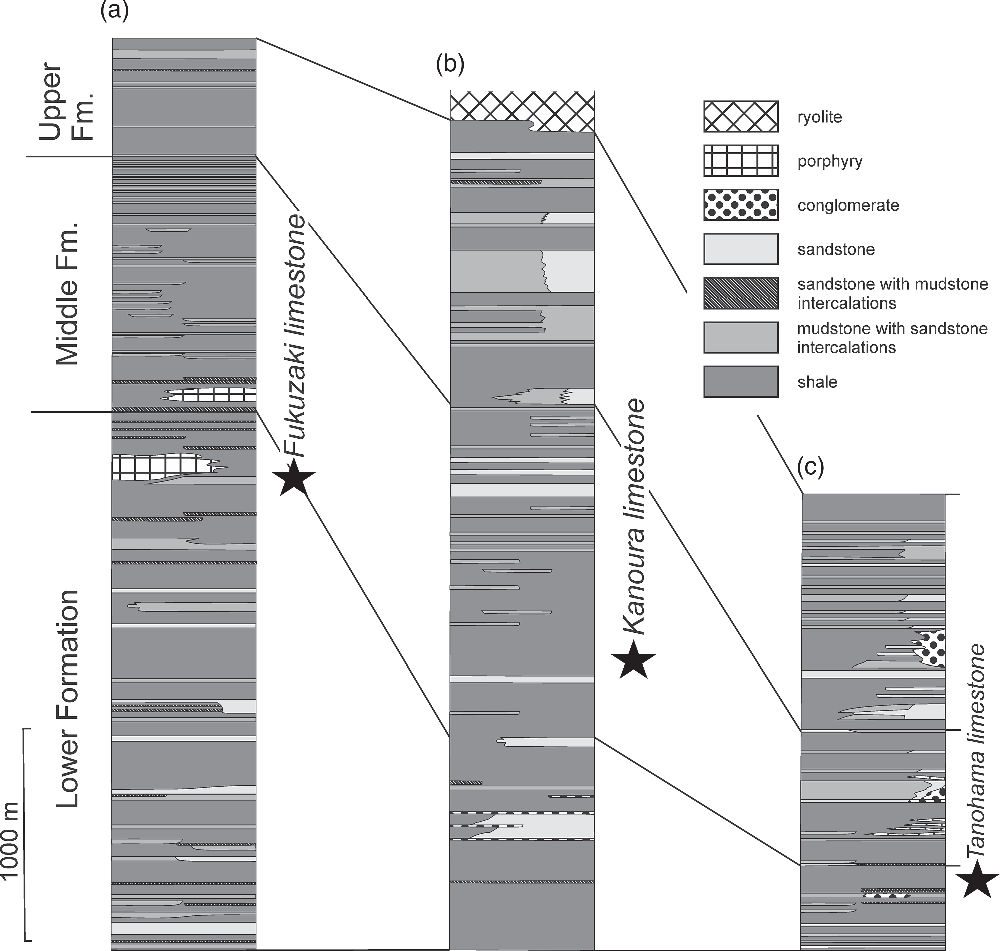
Before the description of chemosymbiotic bivalves by Ninomiya (Reference Ninomiya2011), many normal shallow- and deep-water molluscan fossils from the Taishu Group had been recorded by Kanno (Reference Kanno1955) and Masuda (Reference Masuda1970). According to Masuda (Reference Masuda1970), the shallow-water faunas including Mizuhopecten cf. kimurai murayamai (Yokoyama) occurred in the lower part, and the deep-water faunas including protobranchs and mud pectens in the middle and upper parts of the Taishu Group. The chemosynthetic bivalves from the Fukuzaki (mistakenly referred to as Fukusaki), Tanohama and Kanoura Limestones have been described in ascending order by Ninomiya (Reference Ninomiya2011, Reference Ninomiya2012) and Ninomiya et al. (Reference Ninomiya, Shimoyama, Miyata, Yamanaka, Shimazu, Taniguchi, Aoki, Nishida and Takahashi2020). The former two limestones occur in the uppermost part of the Lower Formation while the Kanoura Limestone has a position near the lowermost part of the Middle Formation (Fig. 2).
Dating of the Taishu Group has been a matter of controversy for some time (cf. Sakai & Nishi, Reference Sakai and Nishi1990). Poorly preserved Palaeogene microfossils found in the Lower and Upper formations of the group (e.g. Nakajo & Funakawa, Reference Nakajo and Funukawa1996), considered as an evidence of its Palaeogene age (e.g. Sakai & Nishi, Reference Sakai and Nishi1990), were likely redeposited from older rocks. Palynological materials examined are diagenetically altered and did not provide any identifiable fossils (E Durska, pers. comm. 2019), thus excluding palynology as a dating tool for the Taishu Group. The Ebashima Formation unconformably overlying the Group yields Pliocene foraminifers (Isomi & Nagahama, Reference Isomi and Nagahama1964), confining the upper age limit of the Taishu Group to pre-Pliocene. U–Pb radiometric dating of the Kunehama Tuff from the lowermost part of the Taishu Group yielded an absolute age of 17.9 Ma, whereas the Oobaura Tuff from the uppermost part of the unit has an age of 15.9 Ma (Ninomiya et al. Reference Ninomiya, Shimoyama, Watanabe, Horie, Dunkley and Shiraishi2014). An early Miocene age for at least fragments of the Taishu Group can therefore be postulated. Nevertheless, mutual stratigraphic relationships between the Lower, Middle and Upper formations cropping out in various parts of the islands remain to be established, and the age relationships between the three seep deposits discussed in this paper are unknown.
3. Materials and methods
We collected carbonate and fossil samples from three sites, Fukuzaki, Kanoura and Tanohama (Fig. 1). Another limestone body has been previously reported by Ninomiya (Reference Ninomiya2011, Reference Ninomiya2012) at Nita, but we could not find this limestone during our field survey in 2016.
A set of uncovered thin-sections (48 mm × 28 mm) and polished slabs were prepared in order to identify the main carbonate phases, and to interpret spatial and temporal relationships between them. Thin-sections were analysed under normal and cross-polarized light using an optical microscope. Some polished and carbon-coated thin-sections were examined with a CL microscope equipped with a hot cathode linked to the Kappa video camera for recording digital images at the Institute of Paleobiology of the Polish Academy of Sciences in Warsaw. An electron energy of 14 keV and a beam current of 0.1–0.2 mA were used.
Invertebrate fossils were prepared with a vibrotool and coated with ammonium chloride before photography. Measurements were taken with a digital caliper with precision of 0.1 mm.
The mineralogical composition of the investigated seep carbonates was determined using X-ray powder diffractometry (XRD) with the Thermo Electron ALR X’tra powder diffractometer at the Institute of Geology of the Adam Mickiewicz University, Poznań (Poland). The instrument operated at a tube voltage of 40 kV and a tube current of 30 mA. The spectrum was obtained for an angular range of 3–65° 2θ with a 0.02° 2θ step.
Powdered samples for carbon and oxygen isotope analyses were collected from slabs using a hand-held microdrill and analysed by a Thermo Scientific GasBench II/Delta V Advantage isotope ratio mass spectrometer (IRMS) at the Laboratory of Evolution of Earth Environment, Kanazawa University (LEEKU), Kanazawa, Japan, or a Thermo Scientific GasBench II/Delta Plus IRMS at the Department of Earth and Planetary Science, the University of Tokyo, Tokyo, Japan (EPSUT). The powders (~300–500 μg) were reacted with orthophosphoric acid in a glass vial under helium atmosphere at 70 °C (LEEKU) or 60 °C (EPSUT) in an online GasBench II system. Samples containing ankerite were reacted for 72 hours at 60 °C. The produced CO2 was analysed in a continuous-flow IRMS. All isotope values are reported in the δ notation as a per-mil difference between the sample and a Vienna Pee Dee Belemnite (VPDB) standard in delta notation ([δ = R sample/R standard − 1] × 1000, where R is the ratio of minor to major isotopes). The measured values were calibrated with the international standard NBS19. At the LEEKU, the standard deviation of replicate analyses of NBS19 (n = 6) and working standards LSVEC (n = 6) and JLs-1 (n = 9) during three analytical sessions was better than 0.11 ‰ and 0.09 ‰ for δ13C and δ18O, respectively. The standard deviation of ten replicate analyses of a working standard HRS-carb at the EPSUT was 0.16 ‰ and 0.23 ‰ for δ13C and δ18O, respectively.
Lipid biomarker analyses were performed following Miyajima et al. (Reference Miyajima, Watanabe, Yanagisawa, Amano, Hasegawa and Shimobayashi2016) with modified extraction methods. After removal of weathered surfaces, small pieces of rock were washed in distilled water and then in methanol (MeOH) and dichloromethane (DCM) using an ultrasonic bath for 10 min. The washed pieces were crushed into fine chips, and then powdered using a tungsten mortar and pestle. Lipids were extracted from the powdered samples (~10 g powders) using a Thermo Scientific Accelerated Solvent Extractor System (Dionex ASE 350) at the LEEKU, with DCM as a solvent. For another ~10 g powder of a sample from Tanohama, hexane-washed distilled water was added to the powder and 1 N HCl was slowly poured to dissolve the carbonate. After the carbonate was dissolved, lipids were extracted by adding hexane: DCM (9:1, v:v) and centrifuging for 10 min (three cycles). The separated solvents were washed with hexane-washed distilled water. After removing elemental sulphur, the aliphatic hydrocarbon fractions of the extracted lipids were obtained through a silica gel column with n-hexane. Finally, the aliphatic hydrocarbon fractions were diluted with 200 μL of n-hexane after drying. Individual compounds were detected using a gas chromatograph – mass spectrometer (Shimadzu GCMS-QP2010) equipped with a HP-5MS capillary column (30 m × 0.25 mm × 0.25 μm; Agilent Technologies) at the LEEKU. The column oven temperature was increased from 50 °C to 120 °C at 30 °C/min, then from 120 °C to 310 °C at 3.0 °C/min, and kept at 310 °C for 15 min. The splitless system inlet was kept at 310 °C.
The stable carbon isotopic compositions of total organic carbon (TOC) within the seep carbonates were analysed for the powdered samples obtained at the same time as those for biomarker analyses. The carbonate powders (~1 g) were completely dissolved by reacting with 5 N HCl for 24 h at room temperature. Acid was then removed by repeated decantation after centrifugation and washing with deionized water. After freeze-drying, the residues (~4 mg) were analysed with a Thermo Quest NA2500NCS elemental analyser (EA) connected to a Thermo Scientific Delta V Advantage IRMS at the LEEKU. Samples were oxygenated at 1000 °C to make CO2 gas. Concentrations of TOC (in wt %) were calculated by comparing measured 44CO2 peak areas with those of a working standard (L-alanine, LAL) containing 10 μgC/μL. Carbon isotopic compositions are given in the δ notation (δ13C ‰ vs VPDB). The standard deviation of 15 replicate analyses of LAL was 0.06 ‰.
3. Results
4a. Fukuzaki limestone
4.a.1. Locality description
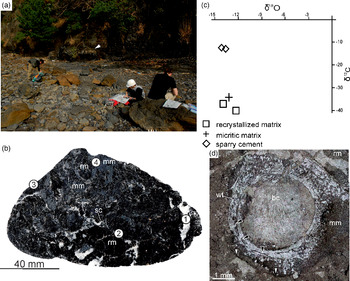
The Fukuzaki seep deposit was found on the NW shore of a small peninsula, at the base of a cliff c. 700 m north of Fukuzaki Town on Shimojima at 34° 18′ 21.24″ N, 129° 15′ 11.58″ E (Fig. 1). In 2016 the deposit included an in situ carbonate body c. 5.6 m long and c. 0.3 m thick found in the cliff (see also Ninomiya et al. Reference Ninomiya, Shimoyama, Miyata, Yamanaka, Shimazu, Taniguchi, Aoki, Nishida and Takahashi2020) and numerous rounded boulders found on the beach (Fig. 3a). The deposit consists of indurated black limestone. We did not find any fossil in the carbonate body found in situ, whereas the boulders found on the beach contained worm tubes and bivalve fossils. All of the fossils and most of the rock samples studied herein came from the boulders.
Fukuzaki limestone. (a) Field photograph of the studied seep deposit. White arrow indicates carbonate body cropping out in the background; a large portion of material studied herein comes from the boulders visible in the foreground. Geologists for scale. (b) Polished slab of the Fukuzaki limestone: rm – recrystallized matrix, mm – micritic matrix, sc – sparry cements. Numbered points refer to location of samples studied with XRD (Table 1). (c) Cross-plot of δ13C and δ18O values of the Fukuzaki limestone. (d) Thin-section photomicrograph showing an agglutinated worm tube fossil (wt) with internally layered structure (black arrows); the worm tube is encapsulated in micritic matrix (mm) and filled with botryoidal cements (bc). Note pressure solution seam (white arrows) which affects the micritic matrix surrounding the worm tube, but does not affect the tube itself. Plane-polarized light.

4.a.2. Mineralogy, stable isotope geochemistry and petrography
The Fukuzaki seep deposit is composed of black, recrystallized carbonate matrix and micritic matrix, cut by veins filled with white sparry cements (Fig. 3b). The dominant mineral building the seep deposit is calcite (Table 1), varying in isotope composition from −40.2 ‰ to −37.2 ‰ for δ13C and from −14.4 ‰ to −12.2 ‰ for δ18O (Table 2). The most 13C-depleted calcites are found in the recrystallized matrix (δ13C values of −37.2 ‰ and −40.2 ‰) and micrite (−36.8 ‰), while calcites forming sparry cements are much less 13C-depleted (δ13C values of −12.9 ‰ and −12.6 ‰; Fig. 3c). The main non-carbonate mineral is quartz, followed by one or more clinopyroxenes: clinoenstatite, Fe enstatite, Mg ferrosillite, or pigeonite (Table 1). All these minerals were common near numerous pressure-dissolution features (Figs 3d, 4). Allochems found in the carbonate boulders comprise fossils: worm tubes (Fig. 3d) and shells (Fig. 4a), most likely of bivalve molluscs.
Mineral composition of selected facies from the Taishu Group seep deposits described in this study. For XRD diagrams, see Supplementary Material available online at https://doi.org/10.1017/S001675682000103X

Stable carbon and oxygen isotopic compositions of the Taishu Group seep deposits described in this study

Fukuzaki limestone. (a) Thin-section photographs showing recrystallized matrix (rm) of Fukuzaki limestone yielding numerous pressure-solution seams (white arrows) and a recrystallized bivalve shell (sh). Cross-polarized light image. (b) Thin-section photographs showing heavily recrystallized matrix cross-cut by pressure-solution seams (white arrows). Most of the recrystallized matrix exhibits dark orange luminescence, with bright orange luminescence seen in microfractures (black arrow). Cathodoluminescence image.

Volumetrically, the dominant phase is recrystallized matrix, composed of a mixture of cloudy and translucent spar, and largely euhedral blocky calcite (Fig. 4a). Micrite is also present, although in much smaller amounts (Fig. 3d). Both phases are penetrated by numerous pressure-solution seams, forming an interconnected network, lined by black opaque material (Fig. 4a). The seams often surround euhedral blocky calcite crystals (Fig. 4a, b), which have irregular faces, accentuated by opaque material, resulting most likely from accumulation of insoluble residues (Fig. 4a). The recrystallized matrix exhibits uniform dark orange luminescence, and is cut by bright orange luminescent microfractures visible only under CL imaging (Fig. 4b).
4.a.3. Organic geochemistry
Hydrocarbons were extracted from a carbonate mass of ~90 % recrystallized matrix and ~10 % sparry cements. Only minor amounts of hydrocarbons from the aliphatic hydrocarbon fractions were detected. These are mostly C17 to C19 and C23 to C31 n-alkanes, with unresolved complex mixture (UCM) around n-C18 alkane. Total organic carbon content was below 0.1 wt % and its δ13C value was −42.3 ‰.
4.a.4. Macrofauna
Worm tubes have an outer diameter of 1.5 to 6 mm and a maximum observed length of c. 60 mm (Fig. 3d). All tubes are fairly straight, unbranched, occur as several tubes together rather than a dense cluster, and do not appear to be attached to substrate in the observed fragments. No outer wall ornamentation is discernible, and it is also not possible to determine if the tubes taper along their length. In thin-section, tube walls are 0.5–1 mm in thickness, and contain a thick outer layer of fine-grained sediment. Towards the inside of the tube wall, fine disintegrated layers are present. In one of the tubes, these interrupted layers occur throughout the tube wall where they are mixed with varying amounts of sediment (Fig. 3d). These tubes appear to have originally been agglutinated, and thus composed of sediment mixed with organic secretions that are used to adhere sediment to the tube (Merz, Reference Merz2015). Such tubes generally have a structure of greater amounts of sediment towards the outer tube wall, while the inside of the tube wall is lined with organic layers (Georgieva et al. Reference Georgieva, Little, Watson, Sephton, Ball and Glover2019). Various marine animals such as annelids and crustaceans may construct agglutinated tubes; however, the diameter and length of these tubes is perhaps most consistent with having been made by an annelid. Annelids which build similarly sized agglutinated tubes include sabellids, terebellids, ampharetids and maldanids.
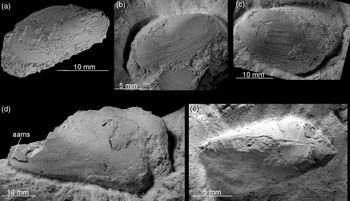
Apart from the worm tubes, the macrofauna of the Fukuzaki limestone comprise a species of mytilid, up to 41.5 mm long and 22.5 mm high with an H/L ratio of 0.54 (Fig. 5). The species from Fukuzaki was previously identified as Bathymodiolus sp. by Ninomiya (Reference Ninomiya2011) and Ninomiya et al. (Reference Ninomiya, Shimoyama, Miyata, Yamanaka, Shimazu, Taniguchi, Aoki, Nishida and Takahashi2020). It has a moderately elongated shell with a small, elongated anterior adductor muscle scar, small anterior and larger posterior lobe and edentulous dorsal margin and is hereby identified as ‘Bathymodiolus’ akanudaensis (Kuroda, Reference Kuroda and Homma1931). The species has previously been reported from the middle Miocene Akanuda and Anazawa seep deposits from the Bessho Formation, Nagano Prefecture, Japan (Tanaka, Reference Tanaka1959; Miyajima et al. Reference Miyajima, Nobuhara and Koike2017), from the latest middle Miocene Kita-Kuroiwa seep deposits from the Ogaya Formation, Niigata Prefecture, Japan (Amano et al. Reference Amano, Jenkins, Aikawa and Nobuhara2010), and from the late Miocene Nakanomata seep deposit from the Nodani Formation, Niigata Prefecture, Japan (Miyajima et al. Reference Miyajima, Watanabe, Yanagisawa, Amano, Hasegawa and Shimobayashi2016). We hereby agree that the species from Fukuzaki is conspecific with ‘B.’ akanudaensis. However, due to a lack of taxonomically important byssal muscle scars preserved in any of the ‘B.’ akanudaensis specimens that we examined (cf. Cosel & Janssen, Reference Cosel and Janssen2008; Saether et al. Reference Saether, Little, Campbell, Marshall, Collins and Alfaro2010b; Amano & Jenkins, Reference Amano and Jenkins2011b; Xu et al. Reference Xu, Feng, Tao and Qui2019), we are unable to resolve the generic identity of this species.
‘Bathymodiolus’ akanudaensis (Kuroda, Reference Kuroda and Homma1931) from the Fukuzaki limestone. (a) Right-lateral view of a complete specimen. Shell. ZPAL V.55/1. (b) Right-lateral view of an incomplete specimen. Partial shell. ZPAL V.55/2. (c) Left-lateral view of an incomplete specimen. Shell. ZPAL V.55/3. (d) Left-lateral view of a damaged specimen, with the anterior adductor muscle scar (aams) indicated. Internal mould with fragments of shell adhering. ZPAL V.55/4. (e) Dorsal view of an incomplete specimen, with the edentulous dorsal margin indicated (asterisk). Partial shell. ZPAL V.55/5.

4.b. Kanoura limestone
4.b.1. Locality description
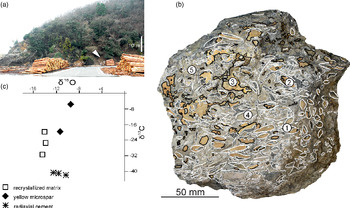
The Kanoura seep deposit represents a set of boulders found on Kamishima, c. 4 km north of Minechosaka Town. Access to the site is through prefectural road 39 north of Minechosaka Town towards Minechoshitaka Town (Fig. 1) and turning east into an unnamed asphalt road prior to the first tunnel. The deposit consists of loose blocks, which have fallen from the slope south of the pier at 34° 28′ 16.86″ N, 129° 23′ 36.96″ E (Fig. 6a); the blocks are composed of moderately hard, brittle grey carbonate.
Kanoura limestone. (a) Field photograph of the study site. White arrow indicates fragments of the seep deposit preserved as boulders in the scree. (b) Weathered surface of a seep deposit block showing carbonate textures; solid white lines indicate the observed vesicomyid bivalve shells; stippled white lines – radiaxial cements; black lines – yellow microspar filling voids. Numbers correspond to carbonate samples for XRD study from a corresponding polished slab (Table 1). (c) Cross-plot of δ13C and δ 18O values of the Kanoura limestone (‰).

4.b.2. Mineralogy, stable isotope geochemistry and petrography
The Kanoura seep deposit is composed of grey, recrystallized matrix with yellow microspar filling the voids or bivalve shells (Fig. 6b). The XRD pattern indicates that the dominant mineral forming the carbonate is calcite (Table 1), with δ13C values ranging from −41.8 ‰ to −19.9 ‰ and δ18O values from −14.5 ‰ to −10.4 ‰ (Table 2). The most 13C-depleted calcites are those building radiaxial cements (δ13C values from −41.8 ‰ to −41.0 ‰), while the recrystallized matrix is considerably less depleted and shows more scattered δ13C values (from −30.7 ‰ to −19.9 ‰; Fig. 6c). The other carbonate mineral is identified as ankerite, which together with calcite and quartz forms yellow microspar filling voids and bivalve shells (δ13C values from −19.5 ‰ to −7.1 ‰). Non-carbonate minerals comprise quartz and trace amounts of unidentified clinopyroxene (Table 1). The carbonate contains numerous fossils, chiefly planktonic foraminifera (Fig. 7a) and vesicomyid bivalve shells.
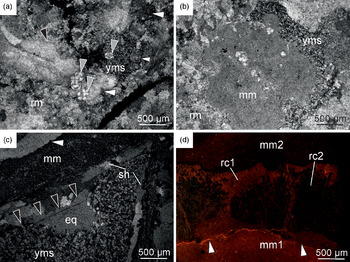
Kanoura limestone. (a) Thin-section photomicrographs showing recrystallized matrix (rm) of the Kanoura limestone with pressure-solution seam (white arrows) and planktonic foraminifera (grey arrows). Yellow microspar (yms) fills small cavity in the recrystallized matrix. Cross-polarized light image. (b) Thin-section photomicrographs showing nodule of micrite (mm) surrounded by recrystallized matrix (rm) and yellow microspar (yms). Cross-polarized light image. (c) Thin-section photomicrographs showing a recrystallized vesicomyid bivalve shell (sh) encapsulated in micritic matrix (mm) and filled with yellow microspar (yms) and equant spar (eq). Black arrows mark the surface of bladed cements, rimming the matrix-free interior of the bivalve shell. Note that there is only a thin veneer of micritic matrix on the outer surface of shell, accompanied by a cement-filled cavity (white arrow). Cross-polarized light image. (d) Thin-section photographs showing radiaxial cements (rc) encapsulated in micritic matrix (mm1 and mm2). Micritic matrix predating the radiaxial cements (mm1) shows dark orange luminescence, and the micritic matrix covering the crust (mm2) shows dull to no luminescence. Radiaxial cements show orange luminescence (rc1), apart from enclaves inside the cement crust which show dark to no luminescence (rc2). Micritic matrix is cut by a pressure-solution seam (white arrow). Cathodoluminescence image.

The recrystallized matrix is composed of a mixture of cloudy and translucent calcite spar, cut by pressure-dissolution seams (Fig. 7a). The matrix contains enclaves of micrite, preserved either as nodules (Fig. 7b) or patches adjacent to bivalve shells and cement-filled cavities (Fig. 7c). Cavities, whether inside bivalve shells or within the matrix itself, are filled with yellow microspar composed of subhedral calcite and ankerite crystals with minor amounts of detrital quartz (Table 1; Fig. 7b, c). The yellow microspar occasionally forms distorted geopetals (Fig. 7c). The remaining volume of the cavities, where present, is filled with bladed cements and equant calcite spar (Fig. 7c).
Radiaxial cements are encased in micrite (Fig. 7d) or cover bivalve shell surfaces. All cements observed were recrystallized, and we were unable to observe the crystallite morphology under optical microscopy. CL microscopy reveals that marginal parts of the cement crusts show orange luminescence, and fibrous enclaves within the crust show dark to no luminescence (Fig. 7d). Micrites hosting the cements show variable luminescence, with micrite generations at the base of the crust being usually more luminescent than those post-dating the crust (Fig. 7d).
4.b.3. Organic geochemistry
Hydrocarbons were extracted from a carbonate mass of ~80 % recrystallized matrix and ~20 % radiaxial cements. As in the case of Fukuzaki, only minor amounts of C17 to C19 and C23 to C31 n-alkanes were detected at Kanoura, with unresolved complex mixture (UCM) around n-C18 alkane. Total organic carbon content was below 0.1 wt % and its δ13C value was −35.6 ‰.
4.b.4. Macrofauna
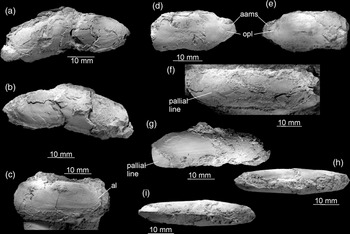
The only macrofaunal species found in the Kanoura limestone is an elongated vesicomyid bivalve (Fig. 8). Bivalves from the Kanoura locality have previously been interpreted as belonging to at least two species of the vesicomyid Calyptogena Dall, Reference Dall1891, occurring in both the seep limestone and surrounding mudstone, and an additional species of the mytilid Adipicola Dautzenberg, 1927, occurring only in the surrounding mudstone (Ninomiya, Reference Ninomiya2011). Our observations indicate that at least the materials from the Kanoura carbonate belong to a single species. The largest complete specimen at our disposal is 48.5 mm long and 16.5 mm high, with a H/L ratio of c. 0.34. The elongated shape and pallial line emerging at the posterior side of the anterior adductor muscle scar places the species in the genus Pleurophopsis Van Winkle, Reference Van Winkle1919 (Kiel, Reference Kiel2007; Krylova et al. Reference Krylova, Sahling and Janssen2010), a senior synonym of Adulomya Kuroda, Reference Kuroda and Homma1931 (Amano & Kiel, Reference Amano and Kiel2011; Amano et al. Reference Amano, Miyajima, Jenkins and Kiel2019a). Morphologically, the species is most similar to Pleurophopsis chitanii (Kanehara, Reference Kanehara1937), known from early to middle Miocene localities on both the Sea of Japan and Pacific sides of Japan (Amano & Kiel, Reference Amano and Kiel2011; Amano et al. Reference Amano, Miyajima, Jenkins and Kiel2019a, b). Many specimens from Kanoura are deformed, with the posterior lobe squeezed into the remainder of the shell, which gives an impression of a false deep ventral sinus (Fig. 8a–b; Ninomiya, Reference Ninomiya2011, p. 4, figs 5–6). However, undeformed shells have straight to slightly concave ventral margins (Fig. 8c–i) known in P. chitanii. The posterior portion of the pallial line is formed by a series of muscle attachments and bends sharply upward (Fig. 8f); however, the portion of the pallial line where the false sinus is developed in P. chitanii is not preserved, and we are unable to verify the presence of this feature. Nonetheless, based on the observed morphological features, such as the H/L ratio, shape of the ventral margin and size of the anterior lobe, the species can be safely included into Pleurophopsis chitanii (Kanehara, Reference Kanehara1937).
Pleurophopsis chitanii (Kanehara, Reference Kanehara1937) from the Kanoura limestone. (a–b) Right- (a) and left- (b) lateral views of a complete, deformed specimen with false ventral sinus formed by broken valves. Internal mould with adhering fragments of the shell. ZPAL V. 55/6. (c) Right-lateral view of the anterior part of an incomplete right valve with the anterior lobe (al) indicated. Partial shell. ZPAL V. 55/7. (d–e) Right- (d) and left- (e) lateral views of an incomplete specimen with anterior adductor muscle scars (aams) and point of origination of the pallial line (opl) visible. Internal mould. ZPAL V.55/8. (f) Right-lateral view of an incomplete specimen with the pallial line forming a weak sinus. Internal mould with adhering fragments of the shell. ZPAL V.55/9. (g–i) Left-lateral (g), dorsal (h) and ventral (i) views of a nearly complete specimen. Partial shell. ZPAL V.55/10.

4.c. Tanohama limestone
4.c.1. Locality description
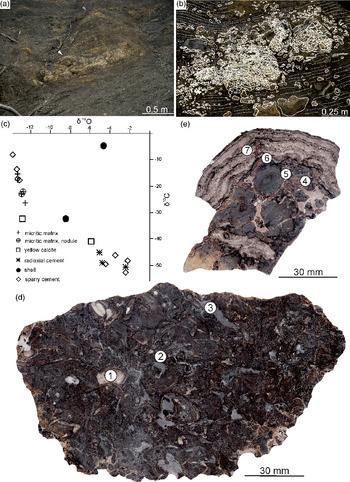
The Tanohama seep deposit was found c. 700 m north of the fishing town of Kamiagatamachi Shitaru (Fig. 1). The easiest way to access it is to follow the cliff northwards from the harbour, preferably during low tide. In 2016 the deposit was preserved in situ a few metres above the base of the cliff at 34° 34′ 32.34″ N, 129° 17′ 49.44″ E. The deposit is composed of a ~3.7 m long and ~1 m thick in situ carbonate body and centimetre-sized concretions scattered in siltstone both above and below the carbonate body. There is an additional, smaller carbonate body a few metres above the main deposit. A pipe-shaped concretion is also found below the main carbonate (Fig. 9a). This seep deposit is formed of concretionary, micritic and stromatolitic carbonates (Fig. 9b).
Concretionary facies of the Tanohama limestone. (a) Field photograph of a studied seep deposit. White arrow marks lower seep deposit. Grey arrow marks smaller, upper seep deposits a few metres above the lower seep deposit. The majority of Tanohama limestone material studied comes from the lower seep deposit. (b) Distribution of carbonate bodies comprising the lower seep deposit at Tanohama. White solid lines delineate major concretions that we were able to track in the field and on the photographs; white dotted lines delineate stromatolitic crusts; white stippled lines indicate host sediment bedding. (c) Cross-plot of δ13C and δ18O values of the Tanohama limestone (‰). (d) Polished slab of the concretionary facies of the Tanohama limestone; numbered points refer to locations of samples studied with XRD (Table 1). (e) Polished slab of stromatolitic facies of Tanohama limestone; numbered points refer to location of samples studied with XRD (Table 1).

4.c.2. Mineralogy, stable isotope geochemistry and petrography
The Tanohama seep deposit is composed of nodular, yellowish-grey micritic matrix intercalated with stromatolitic crusts composed of radiaxial cements, the latter also filling smaller voids within the micritic and recrystallized matrix. The XRD pattern indicates that the bulk of the carbonate is calcite (Table 1), with δ13C values ranging from −52.8 ‰ to −4.7 ‰ and δ18O values from −13.8 ‰ to −2.2 ‰ (Fig. 9c; Table 2). Most 13C-depleted are the calcites building radiaxial cements (δ13C values between −52.8 ‰ and −45.2 ‰), followed by yellow calcites (δ13C values from −41.0 ‰ to −32.3 ‰), bivalve shells (δ13C values from −32.4 ‰ to −4.7 ‰), micrite, in the form of both homogeneous micrite (δ13C values from −26.5 ‰ to −15.3 ‰) and nodules (δ13C values from −23.4 ‰ to −22.9 ‰), and blocky cements (δ13C values from −17.3 ‰ to −8.2 ‰). Other carbonate minerals are dolomite and ankerite, found in minor amounts in sediment trapped between the growing nodules (Fig. 9d–e; Table 1). Non-carbonate minerals comprise quartz, chalcopyrite and clinopyroxenes, found chiefly in the internal sediment or as small impurities within carbonate-rich phases (Table 1). The carbonate contains fossils such as planktonic foraminifers (Fig. 10a) and vesicomyid bivalve shells (Fig. 10b).
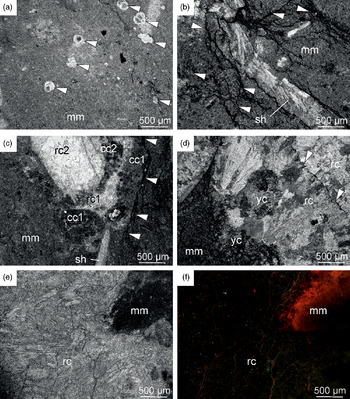
Concretionary facies of the Tanohama limestone. (a) Thin-section photomicrograph showing micritic matrix (mm) yielding several planktonic foraminifera (white arrows). Plane-polarized light. (b) Thin-section photomicrograph showing micritic matrix (mm) with the vesicomyid bivalve shell (sh) and numerous pressure-solution seams penetrating the matrix in the immediate vicinity of the shell (white arrows). Cross-polarized light image. (c) Thin-section photomicrograph showing a cavity within micritic matrix (mm) lined with at least two generations of clotted carbonate (cc1 and cc2) and filled with two subsequent generations of radiaxial cements (rc1 and rc2). Plane-polarized light image (d) Thin-section photomicrographs showing a cavity within micritic matrix (mm) filled with yellow cements (yc) and radiaxial cements (rc). White arrows indicate the surface of radiaxial cement crust with needle to flat-topped crystal terminations. Cross-polarized light image. (e–f) Thin-section photomicrographs showing a contact between micritic matrix (mm) and radiaxial cement (rc). Micritic matrix zone adjacent to the base of the radiaxial cement crust shows dark orange luminescence, and the subsequent cement shows no luminescence. Plane-polarized light (e) and cathodoluminescence image (f).

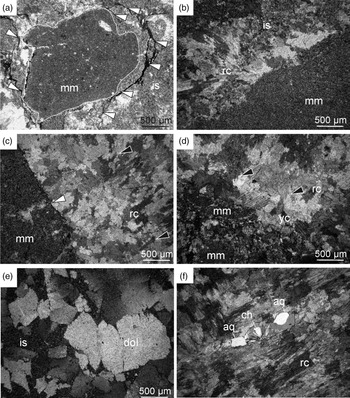
Stromatolitic facies of the Tanohama limestone. (a) Thin-section photomicrograph showing nodule of micritic matrix (mm) floating in internal sediment (is); pressure-solution seams (white arrows) encircle the nodule and affect the internal sediment surrounding it, but do not distort the nodule’s margin (white stippled line). Cross-polarized light image. (b) Thin-section photomicrograph showing a fragment of a large micritic nodule (mm) floating in internal sediment (is), with the remaining space occluded by radiaxial cement (rc). Cross-polarized light image. (c) Thin-section photomicrograph showing surface of a fractured nodule of micritic matrix (mm) covered with radiaxial cements (rc). The fracturing predates the formation of cement crust as indicated by the cross-cutting relationship (white arrow). Cross-polarized light image. (d) Thin-section photomicrograph showing corroded surface of fractured micritic nodules (mm) covered with yellow calcite (yc), followed by radiaxial cement crust (rc). Cross-polarized light image. (e) Thin-section photograph showing subhedral dolomite (dol) formed in mixed carbonate–siliciclastic internal sediment (is). Cross-polarized light image. (f) Thin-section photograph showing a cavity within a radiaxial cement crust (rc) filled with chalcedony (ch) followed by anhedral quartz (aq). Cross-polarized light image.

The micritic matrix forming the bulk of the carbonate is cut by numerous pressure-dissolution seams accentuated by dark, insoluble residue (Fig. 10b). Some cavities in the micrite are lined with clotted carbonate, composed of cloudy micritic clots up to 100 μm across, interlayered with radiaxial cement (Fig. 10c). Other cavities are lined with an irregular layer of yellow calcite, followed by recrystallized radiaxial cements with noticeable traces of a fibrous precursor and characteristic flat-topped or needle-like terminations (Fig. 10d). Radiaxial cements and micrites from Tanohama are predominantly non-luminescent; only a thin veneer of micrite immediately below the radiaxial cement crust displays orange luminescence (Fig. 10e–f).
The top of the main Tanohama seep deposit (Fig. 9b) is composed of accumulation of micritic carbonate nodules (Figs 9e and 11a), covered with a cement crust up to c. 100 mm in thickness (Fig. 9b, e). The nodules are up to c. 15 mm in diameter and are composed of layered (Fig. 9e) or homogeneous (Fig. 11a) micrite. The space between the nodules is partially filled by internal sediment which can be cut by pressure-dissolution seams affecting only the internal sediment and not the nodules (Fig. 11a). Cavities between internal sediment and nodules, where present, are occluded by recrystallized radiaxial cements, nucleating at the surface of nodules; some of those radiaxial cements show traces of a fibrous precursor (Fig. 11b–c). A thick stromatolitic crust composed of radiaxial cements covers the corrosion surface truncating nodules and internal sediment, either pristine or fractured (Fig. 9e). The surface is followed either directly by radiaxial cements (Figs 11c) or by a sequence of yellow calcites and radiaxial cements (Fig. 11d). The latter pattern can be repeated several times within the crust. Radiaxial fibrous cements are uniformly recrystallized; ghosts of a fibrous precursor are, however, visible (Fig. 11d). Other precipitates include subhedral dolomite occasionally formed between the nodules within the internal sediment (Fig. 11e), and silica (chalcedony and anhedral quartz) formed in the few radially arranged cavities found within radiaxial cement crust (Fig. 11f).
Total ion chromatogram of the hydrocarbon fraction obtained from the Tanohama limestone from (a) stromatolitic facies and (b) concretionary facies. Closed circles indicate n-alkanes, and numbers above them indicate the number of carbon atoms. UCM – unresolved complex mixture. Pr – pristine; ph – phytane.

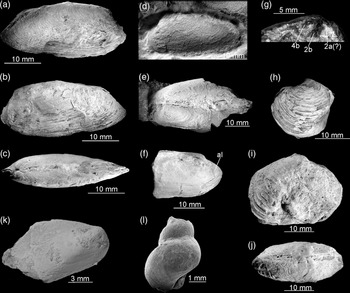
Fossils from Tanohama limestone. (a–g) Vesicomyid bivalve Pleurophopsis cf. hamuroi (Amano & Kiel, Reference Amano and Kiel2011); (a–c) Right- (a) and left- (b) lateral, and dorsal (c) views of a complete specimen. Shell. ZPAL V.55/10. (d) Left-lateral view. Shell. ZPAL V.55/11. (e) Dorsal view of a butterflied specimen. Partial shell. ZPAL V.55/12. (f) Right-lateral view showing the anterior lobe (al). Partial shell. ZPAL V.55/13. (g). Details of the cardinal dention of the left valve. Shell. ZPAL V.55/14. (h–j) Lucinoma sp. (h) Left-lateral view. Partial shell. ZPAL V.55/15. (i–j) Right-lateral (i) and dorsal (j) views. Shell. ZPAL V.55/16. (k) ‘Bathymodiolus’ akanudaensis (Kuroda, Reference Kuroda and Homma1931). Partial shell. GKZ-N00002. (l) Provanna? sp. GKZ-N00003.

4.c.3. Organic geochemistry
Hydrocarbons were extracted from the concretionary facies (~50 % micrite and ~50 % sparry cements) and the stromatolitic facies (100 % radiaxial cements). Both subsamples have remarkably similar hydrocarbon composition, dominated by C14 to C28 n-alkanes. The extracted n-alkanes clearly show a short-chain predominance, with lower abundance with increasing carbon number. Isoprenoid hydrocarbons, such as crocetane and pentamethylicosane (PMI), were not detected, except for minor amounts of pristane and phytane in the stromatolitic facies (Fig. 12). Steranes and hopanes were also undetectable. Hydrocarbons extracted from the stromatolitic facies after carbonate dissolution by HCl did not show any compositional difference from those extracted without carbonate dissolution. Total organic carbon content of the stromatolitic facies was ~0.1 wt % and its δ13C value was very low (−48.9 ‰).
4.c.4. Macrofauna
The macrofauna from the Tanohama limestone comprises four species (Fig. 13). The most common is a vesicomyid bivalve species, previously interpreted as belonging to two unnamed species of Calyptogena occurring also at the Kanoura locality (Ninomiya, Reference Ninomiya2011). The species has a moderately elongated shell up to 34 mm long and 15 mm high, with an H/L ratio of c. 0.44. This is within the range of elongation of similarly sized specimens of Pleurophopsis hamuroi (Amano & Kiel, Reference Amano and Kiel2011) and P. kuroiwaensis (Amano & Kiel, Reference Amano and Kiel2011). The beak is positioned in the anterior one-fourth to one-seventh of the shell, more similar to its position in adult specimens of P. hamuroi than that of P. kuroiwaensis (Amano & Kiel, Reference Amano and Kiel2011). The species from Tanohama is significantly inflated, in which it resembles P. hamuroi rather than P. kuroiwaensis, and has a cardinal dentition with small 2a cardinal. Based on the above criteria, we identify the vesicomyid species from Tanohama into Pleurophopsis cf. hamuroi (Amano & Kiel, Reference Amano and Kiel2011).
Other macrofaunal species are much less common in Tanohama. They include a species of the lucinid bivalve Lucinoma Dall, Reference Dall1901. Numerous species of Lucinoma have previously been reported from the Miocene seep deposits from the Northern Pacific area (cf. Majima et al. Reference Majima, Nobuhara and Kitazaki2005), and we refrain from including Lucinoma from Tanohama into any of these until a thorough revision is available as suggested by Kiel (Reference Kiel2013). The remaining materials comprise a single specimen of the mytilid bivalve ‘Bathymodiolus’ akanudaensis (Kuroda, Reference Kuroda and Homma1931), and three poorly preserved gastropod specimens, possibly of Provanna Dall, Reference Dall1918 (e.g. Amano & Little, Reference Amano and Little2014).
4. Interpretations
5.a. Miocene methane seepage within the Taishu Group
Two lines of evidence unequivocally show that the Miocene authigenic carbonate deposits found within the Taishu Group formed at submarine methane seeps. These are (i) the strong 13C depletion of their carbonate minerals, and (ii) petrography of the most 13C-depleted carbonate phases.
All three studied deposits exhibit low δ13C values of calcites, ranging from −40.2 ‰ to −12.6 ‰ (Fukuzaki), −41.8 ‰ to −19.9 ‰ (Kanoura) and −52.8 ‰ to −4.7 ‰ (Tanohama). The majority of those values point to a carbon source isotopically much lighter than ambient-seawater dissolved inorganic carbon (c. −2 to +2 ‰ VPDB) and carbon coming from degradation of sedimentary organic matter (c. −25 ‰ to −20 ‰ VPDB; Krajewski & Luks, Reference Krajewski and Luks2003; Campbell, Reference Campbell2006). The low δ13C values encountered in the carbonates from the Taishu Group are consistent with hydrocarbons being the primary source of carbon incorporated into the studied authigenic carbonates (Peckmann & Thiel, Reference Peckmann and Thiel2004; Campbell, Reference Campbell2006). The most abundant hydrocarbon in marine pore fluids is methane (Whiticar, Reference Whiticar1999), and microbially mediated anaerobic oxidation of methane (AOM; Boetius et al. Reference Boetius, Ravenschlag, Schubert, Rickert, Widdel, Gieseke, Amann, Jørgensen, Witte and Pfannkuche2000) releases bicarbonate anions and in consequence facilitates precipitation of authigenic carbonate minerals (Peckmann & Thiel, Reference Peckmann and Thiel2004). Aerobic oxidation of methane, on the other hand, increases the acidity and thus causes carbonate dissolution, rather than precipitation (Himmler et al. Reference Himmler, Brinkmann, Bohrmann and Peckmann2011). In addition, much less common, heavier gaseous hydrocarbons and oils are also oxidized in marine environments (e.g. Joye et al. Reference Joye, Boetius, Orcutt, Montoya, Schulz, Erickson and Lugo2004; Smrzka et al. Reference Smrzka, Zwicker, Misch, Walkner, Gier, Monien, Bohrmann and Peckmann2019); however, their contribution to the overall carbonate pool at seeps remains poorly understood. Consequently, significantly 13C-depleted values of the Miocene authigenic carbonates from the Taishu Group indicate that methane-derived carbonate released during AOM was involved in their formation (cf. Peckmann & Thiel, Reference Peckmann and Thiel2004). The methane involved could have been either biogenic (δ13C below −50 ‰ VPDB) or thermogenic in origin (−30 ‰ to −50 ‰ VPDB; Whiticar, Reference Whiticar1999; Campbell, Reference Campbell2006). Assuming a certain degree of mixing of different carbonate pools that always takes place at seeps (e.g. Peckmann & Thiel, Reference Peckmann and Thiel2004; Kiel & Peckmann, Reference Kiel and Peckmann2007; Peckmann et al. Reference Peckmann, Birgel and Kiel2009), and that the low δ13C values of carbonate are closest to those of the original hydrocarbon source (e.g. Peckmann et al. Reference Peckmann, Kiel, Sandy, Taylor and Goedert2011; Himmler et al. Reference Himmler, Birgel, Bayon, Pape, Ge, Bohrmann and Peckmann2015), the δ13C values of −40.2 ‰ for Fukuzaki, −41.8 ‰ for Kanoura and −52.8 ‰ for Tanohama indicate that all three deposits formed due to seepage of biogenic methane (e.g. Hryniewicz et al. Reference Hryniewicz, Bitner, Durska, Hagström, Hjálmrsdóttir, Jenkins, Little, Miyajima, Nakrem and Kaim2016; Miyajima et al. Reference Miyajima, Watanabe, Yanagisawa, Amano, Hasegawa and Shimobayashi2016, Reference Miyajima, Watanabe, Jenkins, Goto and Hasegawa2018). Nevertheless, we cannot exclude that thermogenic methane or heavier hydrocarbons could also have contributed to the overall carbon budget.
Because of the pervasive recrystallization that obliterated most of the primary fabrics, no seep-specific textures have been preserved in the Fukuzaki limestone (Fig. 4). However, features typical for carbonates formed at methane seeps are present at Kanoura and Tanohama. The micritic matrix of the Kanoura and Tanohama limestones, whether partially recrystallized in the case of Kanoura or purely micritic in the case of Tanohama, contains cavities filled with radiaxial cements (Figs 7, 10 and 11). At Kanoura, only remnants of the original radiaxial textures are preserved, as shown by CL imaging (Fig. 7d). At Tanohama, radiaxial cements preserve their original fibrous textures, in spite of later recrystallization (Figs 10d–f and 11b–d). Notably, radiaxial cements are the most 13C-depleted phases at both Kanoura (–41.8 ‰ to –41.0 ‰) and Tanohama (–52.8 ‰ to –45.2 ‰). 13C-depleted radiaxial cements are typical for hydrocarbon seeps, both ancient and Recent (e.g. Savard et al. Reference Savard, Beachamp and Veizer1996; Campbell et al. Reference Campbell, Farmer and Des Marais2002; Greinert et al. Reference Greinert, Bohrmann and Elvert2002; Campbell, Reference Campbell2006; Feng et al. Reference Feng, Chen, Peckmann and Bohrmann2010; Hammer et al. Reference Hammer, Nakrem, Little, Hryniewicz, Sandy, Hurum, Druckenmiller, Knutsen and Høyberget2011; Jakubowicz et al. Reference Jakubowicz, Dopieralska and Belka2015), and their presence in both Kanoura and Tanohama further corroborates the seep-related origin of both deposits. The fibrous morphology of cements at Tanohama is paired with an aragonite precursor (e.g. Aïssaoui, Reference Aïssaoui1985; Savard et al. Reference Savard, Beachamp and Veizer1996), a carbonate mineral dominating many recent seeps (e.g. Feng et al. Reference Feng, Chen and Roberts2008; Zwicker et al. Reference Zwicker, Smrzka, Himmler, Monien, Gier, Goedert and Peckmann2018). Aragonite cements form preferentially over calcite cements in waters rich in sulphate anions in aragonite seas (e.g. Hardie, Reference Hardie1996; Savard et al. Reference Savard, Beachamp and Veizer1996; Zwicker et al. Reference Zwicker, Smrzka, Gier, Goedert and Peckmann2015), implying that the radiaxial cements at Tanohama formed mostly close to the seabed.
Radiaxial fibrous cements at Tanohama are associated with yellow cements (Figs 10d and 11d). An association of yellow and radiaxial cements is typical of ancient seep carbonates (e.g. Beauchamp & Savard, Reference Beauchamp and Savard1992; Campbell et al. Reference Campbell, Farmer and Des Marais2002; Peckmann et al. Reference Peckmann, Goedert, Thiel, Michaelis and Reitner2002; Himmler et al. Reference Himmler, Freiwald, Stollhofen and Peckmann2008; Hammer et al. Reference Hammer, Nakrem, Little, Hryniewicz, Sandy, Hurum, Druckenmiller, Knutsen and Høyberget2011; Hryniewicz et al. Reference Hryniewicz, Bitner, Durska, Hagström, Hjálmrsdóttir, Jenkins, Little, Miyajima, Nakrem and Kaim2016; Zwicker et al. Reference Zwicker, Smrzka, Himmler, Monien, Gier, Goedert and Peckmann2018). The yellow cements in ancient seep carbonates are among the most 13C-depleted carbonate phases present (e.g. Kuechler et al. Reference Kuechler, Birgel, Kiel, Freiwald, Goedert, Thiel and Peckmann2012; Zwicker et al. Reference Zwicker, Smrzka, Gier, Goedert and Peckmann2015) and contain a major portion of molecular fossils typical of AOM-mediating microbial consortia, indicating formation in direct proximity to the loci of AOM (Hagemann et al. Reference Hagemann, Leefmann, Peckmann, Hoffmann and Thiel2013). The yellow calcites are indeed among the most 13C-depleted carbonate phases at Tanohama (δ13C values from –41.0 ‰ to –32.3 ‰). In the absence of AOM-specific molecular fossils, the association of 13C depleted yellow and radiaxial cements at Tanohama is another evidence for seep-related origin of this carbonate deposit.
Cement-filled cavities at Tanohama are occasionally lined with clotted carbonate, underlying other cement phases (Fig. 10c). Individual clots in the Tanohama limestone are small (up to 100 μm across), rounded to oval structures with irregular boundaries. Much larger structures (1–2 mm across) with sharp boundaries and occasionally internal structuring have been broadly interpreted as faecal pellets (e.g. Peckmann et al. Reference Peckmann, Goedert, Thiel, Michaelis and Reitner2002; Peckmann et al. Reference Peckmann, Senowbari-Daryan, Birgel and Goedert2007; Senowbari-Daryan et al. Reference Senowbari-Daryan, Gaillard and Peckmann2007). The latter usually appear in large numbers in different facies within the same seep deposit, and are taken as an indicator that carbonate formation has taken place mostly within the sediment (Hryniewicz et al. Reference Hryniewicz, Hammer, Nakrem and Little2012). The small size, irregular boundaries and localized occurrence of the clots from Tanohama inside some cement-filled cavities indicate that they do not have a faecal origin, and are instead locally precipitated. Similar clotted fabrics have been reported from different seep deposits on a number of occasions (e.g. Peckmann et al. Reference Peckmann, Walliser, Riegel and Reitner1999, Reference Peckmann, Kiel, Sandy, Taylor and Goedert2011, Reference Peckmann, Sandy, Taylor, Gier and Back2013; Kiel & Peckmann, Reference Kiel and Peckmann2008; Kuechler et al. Reference Kuechler, Birgel, Kiel, Freiwald, Goedert, Thiel and Peckmann2012; Agirrezabala et al. Reference Agirrezabala, Kiel, Blumenberg, Schäfer and Reitner2013; Hryniewicz et al. Reference Hryniewicz, Hagström, Hammer, Kaim, Little and Nakrem2015), and have been interpreted to be a result of microbially mediated carbonate precipitation (Peckmann et al. Reference Peckmann, Goedert, Thiel, Michaelis and Reitner2002; Feng et al. Reference Feng, Chen and Roberts2008). Although clotted microfabrics are not exclusive to seeps and occur in other carbonate environments (cf. Flügel, Reference Flügel2004), their localized occurrence close to the 13C-depleted cements at Tanohama indicates they were likely influenced by microbially mediated AOM.
Both Kanoura and Tanohama exhibit nodular fabrics, especially well developed at Tanohama where laminated nodules occur encased in the stromatolitic crust (Fig. 9e). Their 13C-depleted signatures (–23.4 ‰ to –22.9 ‰) indicate that they incorporated methane-derived carbon, although other sources likely contributed to the less negative δ13C values of the nodule’s carbonate compared to the cement phases. This implies that the nodules formed at some distance from centres of AOM at Tanohama, either in the lateral zone of the seep where seepage was somewhat less intense, or deeper in the sediment. Indeed, recent carbonate nodules usually form at seeps at depth in the sediment column and are tied to lower methane concentrations (Haas et al. Reference Haas, Peckmann, Elvert, Sahling and Bohrmann2010). Laminated fabrics and changing δ13C values of particular laminae can be interpreted as results of fluctuating seepage conditions (e.g. Feng et al. Reference Feng, Chen, Peckmann and Bohrmann2010), although they can also reflect the presence of microbial mats on the surface of the nodules (e.g. Reitner et al. Reference Reinter, Peckmann, Blumenberg, Michaelis, Reimer and Thiel2005). Some evidence for fluctuating seepage intensities may come from the presence of quartz and chalcedony within cavities (Fig. 11f). Mobilization of silica at seeps is possible during stages of intense fluid flow, when bubble formation and CO2 degassing results in rise of alkalinity, while waning fluid flow favours silica reprecipitation (Kuechler et al. Reference Kuechler, Birgel, Kiel, Freiwald, Goedert, Thiel and Peckmann2012; Smrzka et al. Reference Smrzka, Kraemer, Zwicker, Birgel, Fischer, Kasten, Goedert and Peckmann2015). Nonetheless, moderately low δ13C signatures (–23.4 ‰ to –22.9 ‰) of nodules are somewhat comparable with the values of micrites from the same site (–26.5 ‰ to –15.3 ‰), indicating formation from a mixed carbon pool within the sediment. Lastly, low δ13C signatures of one of the bivalve shells from Tanohama (−32.4 ‰) can be explained by sample contamination with δ13C-depleted carbonate phases, such as yellow calcites or radiaxial fibrous cements. The other bivalve shell sample from this site that was analysed (−4.7 ‰) is closer to the values normally expected from the shells of chemosymbiotic bivalves (Rio et al. Reference Rio, Roux, Renard and Schein1992; Walliser et al. Reference Walliser, Tanabe, HIkida, Shirai and Schöne2019), although it was also likely contaminated by lighter carbonate phases.
5.b. Diagenesis of the Taishu Group
At least four lines of evidence indicate that the authigenic carbonates from the Taishu Group have been influenced by diagenetic alterations. These are (i) CL response of cements; (ii) the δ18O values of calcites; (iii) ankerite and its δ13C and δ18O signatures; (iv) the preservation of molecular fossils.
The earliest stage of diagenesis of carbonates at all three sites is revealed by CL imaging, which shows variable degrees of luminescence (Figs 4b, 7d and 10f). Luminescence in carbonates is caused by the presence of the Mn2+ activator, which under reducing conditions is incorporated into the structure of carbonates, giving them orange luminescence. After the manganese is expended, reduction of Fe3+ to Fe2+ and incorporation of the latter progressively quenches carbonate luminescence (Machel et al. Reference Machel, Mason, Mariano, Mucci, Barker and Kopp1991; Boggs & Krinsley, Reference Boggs and Krinsley2006). Likewise, orange and dull luminescence of recrystallized matrix of the Fukuzaki limestone implies it has recrystallized in contact with reducing pore fluids. Notably, radiaxial cements from Kanoura show small non-luminescent enclaves floating within a luminescent crust (Fig. 7d). In general, luminescence responses of radiaxial seep cements vary depending on local redox conditions, and both orange- (e.g. Little et al. Reference Little, Birgel, Boyce, Crame, Francis, Kiel, Peckmann, Pirrie, Rollinson and Witts2015) and blue- (e.g. Hammer et al. Reference Hammer, Nakrem, Little, Hryniewicz, Sandy, Hurum, Druckenmiller, Knutsen and Høyberget2011) luminescent cements have been documented. Yet, it is apparent that radiaxial cements from Kanoura express peripheral recrystallization under the influence of diagenetic fluids. Limited influence of diagenetic fluids on radiaxial cements at Tanohama is, on the other hand, revealed by their low luminescence (Fig. 10f).
The δ18O signatures of calcites from the Fukuzaki and Kanoura limestones are very negative, and cluster between −14.4 ‰ and −10.4 ‰. Such low values differ greatly from near-zero or positive δ18O values of calcites and aragonite commonly observed at modern seeps (e.g. Feng et al. Reference Feng, Chen and Roberts2008; Haas et al. Reference Haas, Peckmann, Elvert, Sahling and Bohrmann2010; Himmler et al. Reference Himmler, Birgel, Bayon, Pape, Ge, Bohrmann and Peckmann2015). In many cases, seep cements show δ18O signatures similar to that of local bottom waters. Factors like gas hydrate destabilization and clay mineral dehydration in the subsurface can contribute to the overall oxygen isotope budget of interstitial fluids to some extent, and alter the principal seawater signature (e.g. Bohrmann et al. Reference Bohrmann, Greinert, Suess and Torres1998; Greinert et al. Reference Greinert, Bohrmann and Elvert2002; Dählmann & De Lange, Reference Dählmann and De Lange2003; Mazzini et al. Reference Mazzini, Aloisi, Akhmanov, Parnell, Cronin and Murphy2005; Feng et al. Reference Feng, Birgel, Peckmann, Roberts, Joye, Sassen, Liu, Hinrichs and Chen2014). Both factors, however, cause seeping fluids to be more 18O-enriched, which translates into higher δ18O signatures of precipitating seep cements. This is not the case for the Taishu Group. Instead, the very low δ18O signatures indicate fluids either with low δ18O values, or an increased temperature. Possible causes could be influx of meteoric waters, burial diagenesis or precipitation from hydrothermal fluids. Major meteoric water influx seems unlikely for relatively deep-water sediments of the Taishu Group (Ninomiya et al. Reference Ninomiya, Shimoyama, Miyata, Yamanaka, Shimazu, Taniguchi, Aoki, Nishida and Takahashi2020). However, marginal marine and deltaic environments have been identified in some sections of the unit (Nakajo, Reference Nakajo1998; Nakajo & Maejima, Reference Nakajo and Maejima1998). Given that freshwater can penetrate sedimentary successions even far from land (cf. Kooi & Groene, Reference Kooi and Groene2001), and that marginal marine deposits developed southwards of the present-day outcrops of the Taishu Group, periodic freshwater influx cannot be excluded, at least for the southernmost site (Fukuzaki).
The presence of ankerite at Kanoura (Fig. 7; Table 1), on the other hand, can be related to the burial diagenesis. In sedimentary environments, ankerite forms from fluids containing reduced iron and, at the same time, no free sulphide which would otherwise bind the iron (e.g. Pye et al. Reference Pye, Dickson, Schiavon, Coleman and Cox1990). That indicates formation from sulphide-poor waters below the bacterial sulphate reduction zone. Assuming that burial fluids within the Taishu Group were largely marine, and that they maintained a near-equilibrium with the coeval seawater (Krajewski et al. Reference Krajewski, Łącka, Kuźniarski, Orłowski and Prejbisz2001), the δ18O values of the ankerite microspar (−11.1 ‰ to −9.7 ‰ VPDB) translate to precipitation temperatures of c. 50 to 110 °C (Fisher & Land, Reference Fisher and Land1986). The δ13C values of the ankerite microspar, spanning from −19.5 ‰ to −7.1 ‰, indicate precipitation from a mixture of inorganic and organic sources, likely coming from dissolution of detrital and skeletal carbonate and thermal decarboxylation of organic matter (Krajewski & Woźny, Reference Krajewski and Woźny2009).
Remarkably, the radiaxial cements from the Tanohama limestone exhibit much higher δ18O values (−5.0 ‰ to −2.4 ‰ VPDB), at odds with δ18O signatures of the remaining carbonate phases from this deposit. The yellow cements, micrites and micritic nodules are strongly 18O-depleted (−13.8 ‰ to −12.4 ‰ VPDB) and thus more comparable with respect to analogous phases from Fukuzaki and Kanoura limestones (Figs 3 and 6; Table 1). The pattern observed indicates that burial fluids had an influence on the Tanohama seep deposit, but their effect on radiaxial cements was less than for the Kanoura deposit. This is likely because radiaxial cements at Tanohama are particularly thick, and the low porosity typical of this fabric (Aïssaoui, Reference Aïssaoui1985) has prevented burial fluids from influencing their δ18O signatures to a degree comparable to that observed at Kanoura.
Further heating beyond the temperatures recorded by the cements is suggested by the preservation state of the enclosed organic matter. Normal-alkanes (n-alkanes) are chief hydrocarbon compounds preserved in all of the investigated seep carbonates, and isoprenoid biomarkers of methane-oxidizing archaea (ANME), such as pentamethylicosane (PMI) and crocetane, were not detected (Fig. 12). Alkanes preserved in the Fukuzaki and Kanoura limestones range from n-C17 to n-C31, with bimodal distribution maximizing at n-C18 and around n-C26 and n-C27 alkanes. n-Alkanes with high carbon numbers (23 to 31) are partially in the range of those normally expected for the leaf waxes or freshwater algae (e.g. Eglinton & Hamilton, Reference Eglinton and Hamilton1967; Gelpi et al. Reference Gelpi, Schneider, Mann and Oró1970). However, no odd-to-even predominance at Fukuzaki and Kanoura suggests that the observed carbon number pattern of alkanes is not source-related. Marine algae produce short-chain n-alkanes (n-C15 to n-C19) with odd-to-even predominance, also unlike the samples from the current materials. The presence of an unresolved complex mixture in seep carbonates is usually interpreted as an input from biodegraded oil (e.g. Naehr et al. Reference Naehr, Birgel, Bohrmann, MacDonald and Kasten2009). However, the carbonates studied have very low contents of total organic carbon (TOC; < 0.1%), which would be larger if oil was indeed incorporated. Therefore, the pattern of n-alkanes observed at Fukuzaki and Kanoura limestones is best explained as a result of thermal cracking of organic matter, with some input from terrigenous higher plants and non-marine/marine algae. The unimodal distribution of n-alkanes with short-chain predominance at Tanohama could be obviously ascribed to thermal maturity of the enclosed organic matter (Peters et al. Reference Peters, Walters and Moldovan2005). It is thus highly possible that the biomarkers of ANME have been degraded due to thermal cracking within the seep carbonates. The strongly 13C-depleted signatures of TOC of the studied carbonates (−36 ‰, −42 ‰ and −49 ‰ at Kanoura, Fukuzaki and Tanohama, respectively) imply that the seep carbonates contain some amounts of AOM-related organic compounds. Therefore, the observed n-alkanes might in some part originate from thermal cracking of ANME lipids. A possible heat source could be increased burial during middle Miocene folding (Golozubov et al. Reference Golozubov, Kasatkin, Yokoyama, Tsutsumi and Kiyokawa2017) and associated intrusive activity (Miti, 1972, 1973, 1974).
5.c. Chemosynthesis-based palaeoecosystems of the Taishu Group
The fauna of the cold seep carbonates from the Taishu Group comprises two species of the vesicomyid bivalve Pleurophopsis, a species of the bathymodiolin bivalve ‘Bathymodiolus’, a species of the lucinid bivalve Lucinoma, a gastropod possibly belonging to Provanna, and agglutinated worm tubes (Figs 3, 5, 8 and 13). Vesicomyid and bathymodiolin bivalves are obligate members of seep communities since the Eocene (Amano and Kiel, Reference Amano and Kiel2007; Kiel & Amano, Reference Kiel and Amano2013; see Kiel, Reference Kiel2010 and references therein for discussion of obligate seep fauna), and have no confirmed pre-Eocene fossil record. Such a fossil record is congruent with the hypothesis that evolutionary radiations of both groups started in the Eocene, and is related to the acquisition of symbiosis with sulphide-oxidizing bacteria (Lorion et al. Reference Lorion, Kiel, Faure, Kawato, Ho, Marshall, Tsuchida, Miyazaki and Fujiwara2013; Johnson et al. Reference Johnson, Krylova, Audzijonyte, Sahling and Vrijenhoek2017), with some bathymodiolins acquiring methanotrophic symbioses during subsequent radiations in the Miocene. The vesicomyid Pleurophopsis is one of the most common and species-rich vesicomyids in Eocene–Miocene seep faunas of the Northern Pacific (Amano and Kiel, Reference Amano and Kiel2007, Reference Amano and Kiel2011; Kiel, Reference Kiel2007; Amano et al. Reference Amano, Miyajima, Jenkins and Kiel2019a; Kiel et al. Reference Kiel, Altamirano, Birgel, Coxall, Hybertsen and Peckmann2019, Reference Kiel, Hybertsen, Hyžný and Klompmaker2020), and its presence in the lower Miocene Taishu Group is concordant with its known palaeogeographic and stratigraphic range. Likewise, the fossil ‘Bathymodiolus’ is a member of Eocene and younger fossil seep faunas worldwide (e.g. Saether et al. Reference Saether, Little, Campbell, Marshall, Collins and Alfaro2010b; Amano & Jenkins, Reference Amano and Jenkins2011b; Kiel & Amano, Reference Kiel and Amano2013; Kiel & Taviani, Reference Kiel and Taviani2017), and thus its presence in the early Miocene seep fauna from the Taishu Group is also concordant with the stratigraphic range of this genus. Among them, it has been elucidated that ‘Bathymodiolus’ akanudaensis is an endemic species of the early to middle Miocene Sea of Japan, corresponding to the oldest record of the species.
In contrast to vesicomyid clams and bathymodiolin mussels, Lucinoma and a possible Provanna from the Taishu Group seep deposits have been previously unknown. However, taking into account the frequent occurrence of Lucinoma at Neogene seeps from Japan (Majima et al. Reference Majima, Nobuhara and Kitazaki2005; Amano et al. Reference Amano, Jenkins, Aikawa and Nobuhara2010; Miyajima et al. Reference Miyajima, Watanabe, Jenkins, Goto and Hasegawa2018), and its relatively high frequency at Cenozoic and especially Miocene seeps worldwide (e.g. Kiel & Taviani, Reference Kiel and Taviani2017, Reference Kiel and Taviani2018; Amano et al. Reference Amano, Little and Campbell2018; Kiel et al. Reference Kiel, Hybertsen, Hyžný and Klompmaker2020), its presence at the Miocene seeps of the Taishu Group is in agreement with the palaeogeographic setting and age of these seep deposits. Cenozoic provannids, especially Provanna, are widespread in Eocene–Miocene seeps and cognate communities from the circum-Pacific area (e.g. Squires, Reference Squires1995; Saether et al. Reference Saether, Little and Campbell2010a; Amano & Jenkins, Reference Amano and Jenkins2013; Amano & Little, Reference Amano and Little2014; Hybertsen & Kiel, Reference Hybertsen and Kiel2018; Kiel et al. Reference Kiel, Hybertsen, Hyžný and Klompmaker2020). Consequently, a possible Provanna from the Miocene seeps of the Taishu Group fits well into the palaeogeographic and stratigraphic context of the deposit. Moreover, Lucinoma and a putative Provanna are also the oldest fossil records of each taxa from the Sea of Japan side.
Overall, the molluscan fauna discussed here has a classical Cenozoic character, especially well expressed at Oligocene–Miocene deep-water seeps of the northern circum-Pacific area (e.g. Amano et al. Reference Amano, Miyajima, Jenkins and Kiel2019a; Kiel et al. Reference Kiel, Hybertsen, Hyžný and Klompmaker2020), and includes at least the four oldest records of the species on the Sea of Japan side.
Annelids which construct agglutinated tubes and occur at seeps belong to the families Maldanidae, Terebellidae, Ampharetidae and Sabellidae (Levin et al. Reference Levin, Ziebis, Mendoza, Growney, Tryon, Brown, Mahn, Gieskes and Rathburn2003; Turnipseed et al. Reference Turnipseed, Jenkins and Van Dover2004; Levin & Mendoza, Reference Levin and Mendoza2007). These are generally not considered to be seep-obligate as they do not obtain their nutrition directly from chemosynthetic microbial symbionts, and often also occur in nearby non-seep environments. However, recently it was surprisingly discovered that sabellids can also harbour chemosynthetic symbioses at seeps (Goffredi et al. Reference Goffredi, Tilic, Mullin, Dawson, Keller, Lee, Wu, Levin, Rouse, Cordes and Orphan2020), providing the first instance of this for an annelid that dwells within an agglutinated tube. The prevalence of these symbioses in both modern and fossil seeps is still unknown; it is therefore possible that the Fukuzaki tubes (Fig. 3d) were built by annelid-bearing chemosynthetic symbionts, or that they occupied these seeps to benefit from the increased amounts of organic matter at the site.
6. Discussion
6.a. Formation of the Sea of Japan and hydrocarbon seepage
The existing hypothesis about the formation of the Sea of Japan involves either a rather prolonged process lasting from the Palaeogene to middle Miocene (e.g. Lallemand & Jolivet, Reference Lallemand and Jolivet1985; Nakada et al. Reference Nakada, Yunagi and Maeda1997), or a sudden event in the early and middle Miocene (e.g. Ingle, Reference Ingle1992; Jolivet & Tamaki, Reference Jolivet and Tamaki1992; Ninomiya et al. Reference Ninomiya, Shimoyama, Watanabe, Horie, Dunkley and Shiraishi2014, Reference Ninomiya, Taniguchi, Shimoyama, Watanabe, Danhara, Iwano, Dunkley, Shiraishi and Gouzu2017). The purpose of our study is not to resolve which of the two models is correct, but rather to place the hydrocarbon seepage recorded in the Taishu Group in a geological context. An important point for further discussion is also that the early Miocene hydrocarbon seeps from the Taishu Group belong to the oldest known hydrocarbon seep carbonates from the Sea of Japan (e.g. Amano et al. Reference Amano, Miyajima, Jenkins and Kiel2019a). Consequently, they record the earliest examples of hydrocarbon generation and expulsion in this basin.
Several fossil seep carbonates have been reported from ancient marine deposits bordering the eastern part of the Sea of Japan (e.g. Majima et al. Reference Majima, Nobuhara and Kitazaki2005; Amano et al. Reference Amano, Jenkins, Aikawa and Nobuhara2010; Miyajima et al. Reference Miyajima, Watanabe, Yanagisawa, Amano, Hasegawa and Shimobayashi2016, Reference Miyajima, Nobuhara and Koike2017, Reference Miyajima, Watanabe, Jenkins, Goto and Hasegawa2018). The great majority of these deposits, for example, the middle Miocene carbonates from the Bessho Formation in Nagano Prefecture, with δ13C signatures around −40 ‰ or heavier (e.g. Miyajima et al. Reference Miyajima, Nobuhara and Koike2017, Reference Miyajima, Watanabe, Jenkins, Goto and Hasegawa2018), the uppermost middle Miocene Kita-Kuroiwa seep deposit from Ogaya Formation, Niigata Prefecture, with δ13C signatures as low as −36.0 ‰ (e.g. Amano et al. Reference Amano, Jenkins, Aikawa and Nobuhara2010) and the upper Miocene Nakanomata seep deposit from the Nodani Formation, Niigata Prefecture, with δ13C values as low as −41.1 ‰ (Miyajima et al. Reference Miyajima, Watanabe, Yanagisawa, Amano, Hasegawa and Shimobayashi2016), document seepage of methane of biogenic or mixed biogenic/thermogenic origin. The geotectonic setting of the Sea of Japan seems favourable for generation, accumulation and release of the methane-rich fluids. Extensional tectonics which were active during the early Miocene in the eastern Sea of Japan have been replaced by compressional tectonics from the late Miocene – middle Pliocene onwards (e.g. Jolivet & Tamaki, Reference Jolivet and Tamaki1992; Okui et al. Reference Okui, Kaneko, Nakanishi, Monzawa and Yamamoto2008). Both extensional and compressional tectonic regimes are favourable for submarine hydrocarbon seepage. For example, extensional tectonics favour accumulation of thick sedimentary successions and hydrocarbon migration along normal faults (e.g. Sibuet & Olu, Reference Sibuet and Olu1998), and compressional tectonics enhance trapping of hydrocarbons and their subsequent escape from anticlinal structures (e.g. Okui et al. Reference Okui, Kaneko, Nakanishi, Monzawa and Yamamoto2008; Ding et al. Reference Ding, Spiess, Fekete, Murton, Brüning and Bohrmann2010). The link between compressional tectonics and seepage has so far been especially well documented in the Sea of Japan, as several late Miocene and Pliocene seep carbonates from the eastern part of the sea are located close to the axes of anticlinal structures (Amano & Kanno, Reference Amano and Kanno2005; Amano & Jenkins, Reference Amano and Jenkins2011a; Miyajima et al. Reference Miyajima, Watanabe, Jenkins, Goto and Hasegawa2018), a pattern which is also observed for the extant seeps in this area (e.g. Okui et al. Reference Okui, Kaneko, Nakanishi, Monzawa and Yamamoto2008).
In contrast to the well-documented late Miocene – Recent cold seeps and their relationship with compressional tectonics, seep deposits from Tsushima described in this paper record an initial period of hydrocarbon seepage in the Sea of Japan, when compressional tectonics were still inactive. The deposition of the Taishu Group was a rather rapid event, taking place roughly between 17.9 and 15.9 Ma, close to the end of the early Miocene (Ninomiya et al. Reference Ninomiya, Shimoyama, Watanabe, Horie, Dunkley and Shiraishi2014). It involved development of a pull-apart basin and its rapid filling with up to 5400 m of siliciclastic deposits, which gives an averaged sedimentation rate of up to 2.7 m per 1000 years (Golozubov et al. Reference Golozubov, Kasatkin, Yokoyama, Tsutsumi and Kiyokawa2017). However, because the rocks exposed today are compacted, the initial thickness of the succession and thus the actual sedimentation rate was likely higher. This is a high depositional rate when compared with those from typical deep water environments where extant seeps are usually encountered (e.g. Cita et al. Reference Cita, Ryan and Kidd1978; Wefer et al. Reference Wefer, Berger and Richter1998; Smith et al. Reference Smith, McNiell, Henstock, Arraiz and Spiess2014), but comparable with high depositional rates from sediment mass-wasting areas. Implications of these are (i) the thick sedimentary package of the Taishu Group trapped large volumes of fluids, and (ii) organic matter trapped in the sediment was deeply and rapidly buried. Pore fluids trapped during rapid deposition of sediments are susceptible to migration and expulsion when over-pressured, which initiates subsurface fluid flow (Judd & Hovland, Reference Judd and Hovland2007). As the Taishu Group was deposited in a rapidly downwarped basin which experienced synsedimentary landslide faulting (Golozubov et al. Reference Golozubov, Kasatkin, Yokoyama, Tsutsumi and Kiyokawa2017; Ninomiya et al. Reference Ninomiya, Shimoyama, Miyata, Yamanaka, Shimazu, Taniguchi, Aoki, Nishida and Takahashi2020), possible fluid migration pathways include various shallow to deep-rooted faults. We do not expect that the folding and intrusive activity was a major factor influencing fluid migration, since it was a post-depositional event, dated as c. 15 Ma (Golozubov et al. Reference Golozubov, Kasatkin, Yokoyama, Tsutsumi and Kiyokawa2017). Extant geological equivalents of early Miocene seeps from the Taishu Group could comprise, for example, cold seeps along the Marmara Fault in the Sea of Marmara, Turkey, where strike-slip tectonics cause pull-apart basin formation and submarine fluid seepage in relative proximity (e.g. Zitter et al. Reference Zitter, Henry, Aloisi, Delaygue, Çagatay, Mercier de Lepinay, Al-Samir, Fornacciari, Tesmer, Pekdeger, Wallmann and Lericolais2008; Ritt et al. Reference Ritt, Sarazzin, Caprais, Noël, Gauthier, Pierre, Henry and Desbruyères2010).
6.b. Miocene chemosynthesis-based faunas of the Sea of Japan
Miocene seep faunas from Japan are characterized by frequent occurrence of the vesicomyid bivalve Pleurophopsis, found in addition to ‘Bathymodiolus’ mussels, the gastropod Provanna, the lucinid Lucinoma and others (Amano et al. Reference Amano, Miyajima, Jenkins and Kiel2019a and references therein). Pleurophopsis is known from the late Eocene – late Miocene of the eastern Pacific (Amano and Kiel, Reference Amano and Kiel2007; Kiel, Reference Kiel2007; Kiel & Hansen, Reference Kiel and Hansen2015; Kiel et al. Reference Kiel, Hybertsen, Hyžný and Klompmaker2020). The fossil record of Pleurophopsis in Japan, on the other hand, is somewhat narrower, and spans from the late Oligocene – early Miocene to the Pliocene (Amano et al. Reference Amano, Miyajima, Jenkins and Kiel2019a). The acme of Pleurophopsis in Japan coincides with the early–middle Miocene interval, when at least six species occurred at seeps of the Sea of Japan, four of them endemic to it (Amano et al. Reference Amano, Miyajima, Jenkins and Kiel2019a). This is more than on the Pacific side of Japan, where up to four species have been reported so far (Amano et al. Reference Amano, Miyajima, Jenkins and Kiel2019a). In addition to its frequent occurrence at seeps from that time, Pleurophopsis is also found in ‘normal’, deep-water deposits of Japan, where it was apparently redeposited (Amano et al. Reference Amano, Jenkins, Ohara and Kiel2014, Reference Amano, Miyajima, Nakagawa, Hamuro and Hamuro2019b), which underlines its ubiquity and broad distribution in regional deep-water benthic environments at that time.
While the late Miocene decline of Pleurophopsis in Japan has been linked with cooling that occurred at that time, as evidenced by establishment of cold-water Calyptogena pacifica Dall, Reference Dall1891 in the late Miocene (e.g. Amano & Jenkins, Reference Amano and Jenkins2011a; Amano et al. Reference Amano, Miyajima, Jenkins and Kiel2019a), the reasons for the early–middle Miocene proliferation of Pleurophopsis in Japan remain elusive. Given that it roughly coincides with the warm climatic period culminating in the so-called Mid-Neogene Climatic Optimum around the early/late Miocene transition (Tsuchi, Reference Tsuchi1990), a climatic reason could be responsible. At least in the case of other Miocene chemosymbiotic bivalves, Acharax yokosukensis Kanie & Kuramochi, Reference Kanie and Kuramochi1995 (Amano & Ando, Reference Amano and Ando2011) and the lucinid Epilucina californica (Conrad, Reference Conrad1837), the warm climate seemed to have influenced their Miocene history, allowing A. yokusukensis to grow to unusually large sizes (Amano & Ando, Reference Amano and Ando2011), and facilitating E. californica dispersal from North America to Japan (Kurihara, Reference Kurihara2007). Higher temperatures might be beneficial for chemosymbiotic bivalves which are able to withstand them, mostly because of faster bivalve growth, enhanced symbiont metabolism and resulting higher rates of carbon fixation (Girguis & Childress, Reference Girguis and Childress2006; Childress & Girguis, Reference Childress and Girguis2011), as long as the increased oxygen demands of bacterial–bivalve symbiosis are met.
7. Conclusions
This study documents evidence of ancient hydrocarbon seepage and oxidation, preserved within authigenic carbonates from the lower Miocene Taishu Group from Tsushima, Japan. The investigation included deposits from Fukuzaki, Kanoura and Tanohama limestones, i.e. three out of the four initially reported by Ninomiya (Reference Ninomiya2011). The observed textures, such as radiaxial and yellow cements, and clotted micrites, together with notable 13C depletion of the carbonates indicate their formation due to oxidation of methane of biogenic or mixed biogenic/thermogenic origin. The fauna of these carbonates comprises two species of vesicomyid bivalve Pleurophopsis, a species of the bathymodiolin mussel ‘Bathymodiolus’, a species of lucinid bivalve Lucinoma, a possible provannid gastropod (Provanna?), which is common in Miocene seep carbonates from the ancient Sea of Japan, and agglutinated worm tubes. All of the investigated carbonates formed in a rapidly subsiding pull-apart basin c. 17.9–15.9 Ma, during an initial stage of opening of the Sea of Japan, and are among the oldest seep carbonates from this area. The authigenic carbonates from Tsushima formed before a major compressive event, while their younger equivalents from other parts of the Sea of Japan (Honshu) are often associated with compressive features, such as anticlines.
Acknowledgements
This work was performed in part in the NanoFun laboratory co-financed by the European Regional Development Fund within the Innovation Economy Operational Programme POIG.02.02.00-00-025/09. We would like to thank Przemysław Gorzelak for assistance during CL photography, and Ewa Durska (both Warsaw) for acid dissolution of carbonates and analysis of organic residues. Akihiro Kano (The University of Tokyo) generously performed carbon and oxygen isotope analysis. We gratefully acknowledge Soichiro Muta, Akiko S. Goto and Takashi Hasegawa (Kanazawa University) for support in biomarker and TOC analyses, as well as carbon and oxygen isotope measurements. Funding for KH was provided by the National Science Centre (NCN), Poland, research grant no. 2014/15/B/ST10/04886 entitled ‘The influence of Paleocene/Eocene Thermal Maximum on oceanic chemosynthesis-based ecosystems’. This study was also financially supported by Grant-in-Aid (KAKENHI) from the Japan Society for the Promotion of Science (JSPS) for JSPS Research Fellow to YM (No. 15J01158). MJ was supported by the National Science Centre, Poland, grant no. 2016/23/D/ST10/00444. MG is grateful for support from the United Kingdom Natural Environment Research Council (NERC), grant number NE/R000670/1. Special thanks go to Steffen Kiel and an anynomous reviewer whose comments helped significantly to improve the manuscript.
Supplementary material
To view supplementary material for this article, please visit https://doi.org/10.1017/S001675682000103X