1 Introduction
Political knowledge is a central construct in theories of democracy, most of which suggest that knowledgeable citizens are one of the components of a well-functioning democracy. The logic behind these theories is as follows: the more knowledgeable, informed a citizen is, the more deliberate decisions s/he makes and the more s/he participates in democratic processes (see e.g., Campbell et al. Reference Campbell, Converse, Miller and Stokes1960; Galston Reference Galston2001; Lassen Reference Lassen2005). To test these theories empirically, many efforts have been made to measure political knowledge in the studies of public opinion and political behavior (e.g., Luskin Reference Luskin1987; Delli Carpini and Keeter Reference Delli Carpini and Keeter1996; Mondak Reference Mondak1999). The conventional approach to measuring levels of political knowledge is conducted by asking survey respondents a brief battery of factual questions about politics and counting the number of correct answers. Common formats used for these survey questions include closed-ended (multiple-choice and true–false) items and open-ended identification items.
The selection of item formats involves two related issues that may affect the estimates of political knowledge: items that are likely to be guessed correctly and the levels of knowledge behind “don’t know” (DK) responses in the measurement procedure (Mondak Reference Mondak1999, Reference Mondak2001). On closed-ended items, one primary issue is that respondents who have no knowledge at all or those who have partial knowledge about a question are able to guess an answer from provided choice options, which leads to overestimated knowledge scores if they have a successful guess. On the other hand, although open-ended questions are more difficult than closed-format items for respondents to guess, barely and partially informed respondents who are uncertain of the answer to a question are likely to say “DK” due to individual-level characteristics, which suggests that there might be some knowledge hidden within DK responses (Mondak and Halperin Reference Mondak and Halperin2008; Mondak Reference Mondak2010).
This article examines guessing behavior by focusing on multiple-choice items with the DK-neutral condition and argues that “informed guessing” (i.e., guessing the correct answer based on partial knowledge) is more common than “lucky guessing” or “blind guessing” (i.e., guessing the correct answer randomly). Building on the methods of item response theory (IRT), we propose an IRT model with a guessing component that accommodates the chance of guessing the correct answer for a multiple-choice item based on a respondent’s level of political knowledge and the item’s difficulty. We term this model “two-parameter logistic guessing” (2PL-G) model and show that the proposed 2PL-G model successfully identifies items likely to be correctly guessed. The 2PL-G model is constructed and estimated by a Bayesian approach, which offers flexibility for complex model specifications. In the estimation process, we treat DK responses as “missing values” rather than collapsing DK responses and incorrect responses into the same category, which reflects our ignorance of these respondents’ knowledge levels.
The 2PL-G model is applied to analyzing survey data conducted in 2012 from the Taiwan’s Election and Democratization Study (TEDS) project. The results show that the proposed model accurately describes the characteristics of the political knowledge items employed in the TEDS2012 project. In particular, the guessing property of these items corresponds to what we expect for the public’s political knowledge in Taiwan. This article has two primary contributions. First, substantively, this article contributes to our understanding of guessing behavior in multiple-choice items. The evidence shows that informed (and/or misinformed) guessing is actually more common than blind guessing. One implication of this fact is that the responses in multiple-choice items can appropriately reflect actual knowledge when informed guessing is recognized and modeled accordingly. Second, methodologically, the proposed 2PL-G model appropriately describes the guessing components based on respondents’ levels of political knowledge and item difficulties. While the focus of this article is on political knowledge, the model proposed here can be applied to the multiple-choice format for measuring other types of knowledge in surveys.
The remainder of this article proceeds as follows. Section 2 reviews the extant literature on the measurement of political knowledge and discusses guessing behavior in multiple-choice items, followed by an illustration of the proposed 2PL-G model in Section 3. Section 4 introduces the analyzed data and presents the results of analysis. Section 5 concludes the paper.
2 Measurement of Political Knowledge and Guessing Behavior
Due to the crucial role of political knowledge in democratic participation, the measurement of political knowledge has been a major concern in the discipline of political science (Luskin Reference Luskin1987, Reference Luskin1990; Delli Carpini and Keeter Reference Delli Carpini and Keeter1996; Mondak Reference Mondak1999). In most of the survey research in political science, the common procedure to measure political knowledge is that respondents are asked a series of questions about politics, such as their awareness and cognitions of “textbook facts,” “current events,” and “historical facts” (Delli Carpini and Keeter Reference Delli Carpini and Keeter1991, Reference Delli Carpini and Keeter1993). The responses to political knowledge questions basically fall into three categories: correct responses, incorrect responses, and DKs. Conventionally, DKs are treated as incorrect responses and then the levels of political knowledge are constructed by counting the number of correct responses. This conventional procedure for the measurement of political knowledge involves at least two related issues. One issue is that the selection of item formats is closely associated with guessing behavior; the other is about whether there is knowledge hidden within DK responses.
To diminish the contamination effect of guessing propensity on the measurement of knowledge, Delli Carpini and Keeter (Reference Delli Carpini and Keeter1996) advocate that the DK option should be encouraged to increase the validity of measurement in the survey because the DK-encouraged strategy will somewhat reduce the tendency for respondents to guess, especially for the completely uninformed or partially informed respondents.Footnote 1 However, Mondak (Reference Mondak1999, Reference Mondak2001) argues that respondents’ propensity to guess is not completely eliminated by encouraging the DK option which still threatens the validity of knowledge measures. Rather, it is recommended that one should discourage DK responses in multiple-choice items because propensity to guess is eliminated if all respondents are forced to choose an answer despite their tendency to guess and, thus, knowledge scores reflect only one systematic factor, that is, actual knowledge levels (Mondak Reference Mondak2001; Mondak and Davis Reference Mondak and Davis2001).Footnote 2
In addition to the propensity to guess, Mondak’s forced-choice procedure implicitly assumes that there is variation among the levels of political knowledge for respondents who initially say they do not know. When these respondents are forced to guess, the partially informed and uninformed respondents will guess with successful guessing determined by partial information and by chance (Mondak and Davis Reference Mondak and Davis2001, p. 207).Footnote 3 Following this logic, Miller and Orr (Reference Miller and Orr2008) claim that the DK-omitted strategy is better than both the DK-encouraged and DK-discouraged strategies to eliminate guessing propensity and to reveal partial knowledge despite slightly inflated knowledge estimates due to blind guessing.Footnote 4 Employing DK-neutrality as a reference strategy, Luskin and Bullock (Reference Luskin and Bullock2011) show that there is concealment of partial knowledge within DK responses under the DK-encouraged condition rather than under the DK-discouraged condition.Footnote 5 One implication is that the multiple-choice format with the DK-neutral strategy not only eliminates the propensity of guessing but also reveals partial knowledge, with blind guessing reduced.Footnote 6
Several factors are associated with guessing behavior in the measurement of political knowledge, including the levels of respondents’ certainty about politics, the format of items, the presence/absence of the DK option, and respondents’ personality (e.g., the propensity to guess). Most of the existing literature on the measurement of political knowledge, however, emphasizes the importance of the latter three factors but ignores the first one.Footnote 7 To fill this gap, we focus on respondents’ certainty about politics, which involves respondents’ levels of knowledge and the difficulty of political knowledge questions. In the following discussion, we assume that the levels of knowledge construct a spectrum, with complete ignorance and perfect informativeness as two extremes. Therefore, the majority of respondents are partially informed and a successful guess depends on the level of partial knowledge. In this sense, guessing behavior is actually referred to as informed guessing and blind guessing could be considered as a special case of informed guessing, which relies upon no information.
To investigate the guessing components in the measurement of political knowledge, we consider multiple-choice items with the DK-neutral condition suggested by the literature. We do so for the following reasons. First of all, the choice options in a multiple-choice item can provide the relevant information which motivates respondents to think about the survey questions when they are asked to choose the correct one.Footnote 8 Rather than being completely ignorant, many respondents may be momentarily unable to quickly recall the right answer or may have vague information about the correct answer. These choice options can serve for respondents to either recognize (Tedin and Murray Reference Tedin and Murray1979; Gibson and Caldeira Reference Gibson and Caldeira2009) or recall (Prior and Lupia Reference Prior and Lupia2008) the correct answer.Footnote 9 We do not consider open-ended items because, according to the conventional wisdom, respondents are much less likely to guess when they are asked to answer open-ended items. Even if they do, retrieving partial knowledge from open-ended items depends on the coding procedure rather than knowledge questions since there may be some knowledge hidden in the incorrect responses under the conventional coding process (Gibson and Caldeira Reference Gibson and Caldeira2009; Luskin and Bullock Reference Luskin and Bullock2011).
Second, we assume that, when the DK-neutral strategy is employed along with multiple-choice questions, informed guessing occurs more frequently than blind guessing. Neither encouraged to admit ignorance nor forced to select one among choice options, respondents will choose a substantive answer based on their partial knowledge, which determines the probability of a successful guess/selection. In contrast, respondents who are completely uninformed are very likely to say they “DK” rather than randomly choose an answer. For example, Luskin and Bullock (Reference Luskin and Bullock2011) show that the DK-neutral strategy is not very different from the DK-discouraged strategy in terms of the proportion of DK responses and the amount of information concealed within DK responses, which implies that the DK-neutral strategy successfully makes partially informed respondents guess and leaves uninformed ones on DKs. Furthermore, Luskin and Bullock (Reference Luskin and Bullock2011, p. 552) show that the DK-neutral strategy dramatically reduces blind guessing, compared to the DK-discouraged strategy.
Finally, following a substantial body of literature indicating that the multiple-choice format with the absence of the DK options (either DK-discouragement or DK-omission) effectively excludes respondents’ propensity to guess from the measurement of political knowledge (e.g., Mondak Reference Mondak1999, Reference Mondak2001; Miller and Orr Reference Miller and Orr2008), we assume that the multiple-choice format with the DK-neutral condition achieves this goal as well based on the work of Luskin and Bullock (Reference Luskin and Bullock2011). Consider, for example, that when asked to answer a standard political knowledge question without the DK option, respondents who tend to guess will behave just like what they do in answering questions with the presence of the DK option, that is, guessing an answer. However, respondents with a low tendency of guessing will be implicitly rather than explicitly forced to guess. As a result, all but completely uninformed respondents will guess an answer despite their guessing propensity.
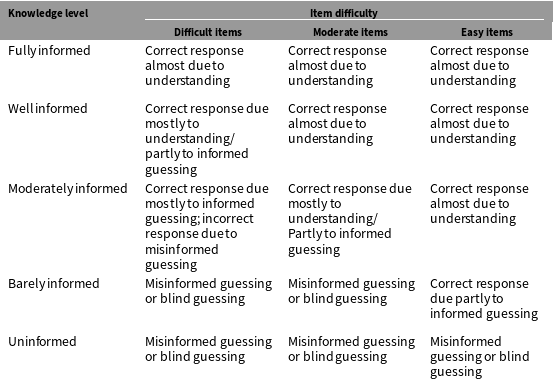
The above discussion suggests that the use of multiple-choice questions with the DK-neutral strategy bolsters our emphasis on guessing behavior associated with knowledge levels and item difficulties, without the need to worry much about confounders from item formats, the presence/absence of the DK option, or the personality of respondents. Mondak and Davis (Reference Mondak and Davis2001) illustrate possible relationships between knowledge levels and responses to standard multiple-choice questions, but they are more concerned with DK responses than guessing behavior. Modifying Table 1 in Mondak and Davis (Reference Mondak and Davis2001), we investigate guessing behavior by delineating possible responses corresponding to the level of knowledge and the difficulty of items, which is summarized in Table 1.
Possible responses to multiple-choice items without DK options.

As can be seen in Table 1, unlike the four levels of knowledge categorized in Mondak and Davis (Reference Mondak and Davis2001), we consider five groups of respondents based on the level of (partial) knowledge, given our assumption of an underlying knowledge spectrum. The first two groups consist of fully informed and well-informed respondents who are knowledgeable about politics and, thus, know the answers to easy, moderate, and most of the difficult political knowledge questions. Even though well-informed respondents are not fully certain of the answers to some difficult questions, they are able to rule out some options that are certainly incorrect based on their knowledge. When respondents can rule out implausible options, the probability of a correct response is higher than that of a random guess (Embretson and Reise Reference Embretson and Reise2000, p. 71). The exclusion of implausible options indicates that, when they “guess” one among the remaining options, they actually do this through partially informed guessing rather than blind guessing.
Consider, for example, that a well-informed respondent is asked to answer a four-category multiple-choice question. Theoretically, each of the choice options has a probability of 0.25 to be correct by chance. Suppose that, since this respondent is relatively informative, s/he knows that two of the options are incorrect but is uncertain which of the remaining two is correct. When s/he chooses one of the probable options, s/he has a probability of 0.5 to correctly answer the question, which is higher than the probability of a random guess.
The third group is moderately informed respondents who have partial information on politics and are uncertain of the answers to most of the questions except for easy ones. Since moderately informed respondents are less knowledgeable than well-informed ones, the former are more likely to answer questions correctly by guessing than the latter. For items with the same level of difficulty, however, moderately informed respondents have a lower probability of a correct response. Consider the same political knowledge question mentioned above, but now suppose that a moderately informed respondent is able to rule out only one choice option instead. Since this respondent is uncertain of the correct answer, s/he guesses one among the remaining three options. Therefore, the probability of a correct response is 0.33, which is higher than the probability of random guessing but is lower than 0.5.
One implication of the above two examples is that, given the item difficulty, a relatively informed respondent has a higher probability of a correct response. Another implication is that guessing contributes less to the probability of a correct response for a relatively informed respondent (e.g.,
 $0.25/0.5<0.25/0.33$
). In other words, a respondent with a relatively low level of knowledge is more likely to have correct responses due to guessing. These two implications make intuitive sense but have not been discussed much in this discipline.
The last two groups include barely informed and uninformed respondents who hardly have knowledge about politics. These respondents are almost unable to correctly answer difficult questions even by guessing. For moderate and easy questions, they are not knowledgeable enough to choose the correct answers or even to rule out some choice options. As a result, the probability of a correct response is mostly due to guessing. Moreover, unlike Mondak and Davis (Reference Mondak and Davis2001), we do not consider misinformed respondents as a distinct group. Instead, we assume that well-informed, moderately informed, barely informed, and uninformed respondents might be misinformed, with the extent determined by the level of knowledge. That is to say, barely informed and uninformed respondents are more likely to be mistaken about political events than partially informed and well-informed respondents. In this regard, when they are uncertain of correct answers, they will guess, probably with the exclusion of the correct answer, based on misleading information rather than by chance.
3 Item Response Theory for Guessing Behavior
In this article, we propose an IRT model with a guessing component that accommodates the chance of guessing the correct answer for a multiple-choice item based on a respondent’s level of political knowledge and the item’s difficulty. The methods of IRT have been developed in education testing and applied by political scientist to a variety of studies such as the measurement of political knowledge (Delli Carpini and Keeter Reference Delli Carpini and Keeter1996; Jackman Reference Jackman2000), congressional roll-call data analysis (Jackman Reference Jackman2001; Clinton, Jackman, and Rivers Reference Clinton, Jackman and Rivers2004), decisions of the Supreme Court (Martin and Quinn Reference Martin and Quinn2002), and levels of democracy (Treier and Jackman Reference Treier and Jackman2008). Political knowledge is typically assumed to be an unobserved, latent variable that can be measured by a number of manifest variables asking a respondent’s awareness of officeholders and political systems (Pietryka and MacIntosh Reference Pietryka and MacIntosh2013). However, the estimates of latent traits and item parameters from conventional IRT models would be biased due to guessing behavior. In the following, we introduce the proposed model and its properties.
3.1 The IRT guessing model
The Rasch model and the two-parameter logistic (2PL) model are two of the most widely used IRT models in various applications (Rasch Reference Rasch1960; Lord and Novick Reference Lord and Novick1968; Embretson and Reise Reference Embretson and Reise2000; Baker and Kim Reference Baker and Kim2004). The IRT models can be used to assess the item properties through item characteristics curves (ICCs), which describe how changes in the trait level relate to changes in the probability of successful responses. However, without considering the effect of guessing, items that have been correctly guessed appear relatively easier than they would be. Since the difficult items are easier than they would be, the knowledge levels of informed respondents who are able to answer difficult items correctly will be underestimated while those of uninformed and/or partially informed ones will be overestimated.
For the guessing property of an item, it has been observed that the lower tail of the empirical ICC sometimes is asymptotic to a value greater than 0. To show the asymptoticity, suppose that, for each item
 $k=1,\ldots ,K$
, respondent
 $i=1,\ldots ,N$
provides a response (
 $y_{i,k}$
), which is either correct (
 $y_{i,k}=1$
) or incorrect (
 $y_{i,k}=0$
). We assume that these items measure an unidimensional latent variable
 $\unicode[STIX]{x1D703}_{i}$
, i.e., the level of political knowledge here. The three-parameter logistic (3PL) model which describes this asymptotic behavior is presented as follows:
 $$\begin{eqnarray}\displaystyle \Pr (y_{i,k}=1|\unicode[STIX]{x1D703}_{i},\unicode[STIX]{x1D6FC}_{k},\unicode[STIX]{x1D6FD}_{k},c_{k}) & = & \displaystyle c_{k}+(1-c_{k})\unicode[STIX]{x1D6EC}[\unicode[STIX]{x1D6FD}_{k}(\unicode[STIX]{x1D703}_{i}-\unicode[STIX]{x1D6FC}_{k})]\nonumber\\ \displaystyle & = & \displaystyle c_{k}+(1-c_{k})\left(\frac{\exp [\unicode[STIX]{x1D6FD}_{k}(\unicode[STIX]{x1D703}_{i}-\unicode[STIX]{x1D6FC}_{k})]}{1+\exp [\unicode[STIX]{x1D6FD}_{k}(\unicode[STIX]{x1D703}_{i}-\unicode[STIX]{x1D6FC}_{k})]}\right),\end{eqnarray}$$
where
 $\unicode[STIX]{x1D6EC}(\cdot )$
denotes the logistic cumulative distribution function (cdf),
 $\unicode[STIX]{x1D6FC}_{k}$
the item-difficulty parameter,
 $\unicode[STIX]{x1D6FD}_{k}$
the item-discrimination parameter,
 $c_{k}$
the asymptotic probability of correct response for
 $\unicode[STIX]{x1D703}\rightarrow -\infty$
(Birnbaum Reference Birnbaum, Frederic and Novick1968). In the literature,
 $c_{k}$
is commonly referred to as the “guessing” parameter, which indicates the probability of an item success for respondents with the lowest trait level (Hambleton and Cook Reference Hambleton and Cook1977).
Empirically, however, the estimates of
 $c_{k}$
from the 3PL model are not equivalent to, and usually smaller than, the randomly guessing probability (Embretson and Reise Reference Embretson and Reise2000, p. 73). It lacks an explanation of why it is higher or lower than the randomly guessing probability for respondents with the lowest trait level. Therefore, some research argues that
 $c_{k}$
should not be interpreted as a guessing parameter (Lord Reference Lord1968, Reference Lord1970). Instead,
 $c_{k}$
should be considered as the lower bound for the ICC. This becomes more clear when we rearrange Equation (1) as the following:
 $$\begin{eqnarray}\Pr (y_{i,k}=1|\unicode[STIX]{x1D703}_{i},\unicode[STIX]{x1D6FC}_{k},\unicode[STIX]{x1D6FD}_{k},c_{k})=\unicode[STIX]{x1D6EC}[\unicode[STIX]{x1D6FD}_{k}(\unicode[STIX]{x1D703}_{i}-\unicode[STIX]{x1D6FC}_{k})]+(1-\unicode[STIX]{x1D6EC}[\unicode[STIX]{x1D6FD}_{k}(\unicode[STIX]{x1D703}_{i}-\unicode[STIX]{x1D6FC}_{k})])c_{k}.\end{eqnarray}$$
Equation (2) shows that the probability of a correct response to item
 $k$
for respondent
 $i$
results from two components. The first component represented by
 $\unicode[STIX]{x1D6EC}[\unicode[STIX]{x1D6FD}_{k}(\unicode[STIX]{x1D703}_{i}-\unicode[STIX]{x1D6FC}_{k})]$
is the probability that a respondent works on the item to find the correct answer based on his/her level of latent trait, which is the functional form of a standard 2PL model. The second component indicated by
 $\left(1-\unicode[STIX]{x1D6EC}[\unicode[STIX]{x1D6FD}_{k}(\unicode[STIX]{x1D703}_{i}-\unicode[STIX]{x1D6FC}_{k})]\right)c_{k}$
is that a respondent answers the item correctly due to how likely the item is to be guessed, which is the value of
 $c_{k}$
moderated by the probability of an incorrect response
 $1-\unicode[STIX]{x1D6EC}[\unicode[STIX]{x1D6FD}_{k}(\unicode[STIX]{x1D703}_{i}-\unicode[STIX]{x1D6FC}_{k})]$
. Furthermore, Equation (2) also shows that the greater the value of the first component, the smaller the value of the second component and, thus, the smaller the impact of guessing on the item (Andrich, Marais, and Humphry Reference Andrich, Marais and Humphry2012, p. 427).
Considering the second component on the right-hand side of Equation (2) as the probability of guessing the correct answer, some research attempts to represent the guessing property of items by allowing individual differences and/or item characteristics in the functional form. For example, building on the Rasch model, San Martín, Del Pino, and De Boeck (Reference San Martín, Guido and De Boeck2006) propose a one-parameter logistic model with ability-based guessing (1PL-AG), which is formulated as follows:
 $$\begin{eqnarray}\displaystyle \Pr (y_{i,k}=1|\unicode[STIX]{x1D703}_{i},\unicode[STIX]{x1D6FC}_{k},\unicode[STIX]{x1D6FE}_{k},b)=\unicode[STIX]{x1D6EC}(\unicode[STIX]{x1D703}_{i}-\unicode[STIX]{x1D6FC}_{k})+[1-\unicode[STIX]{x1D6EC}(\unicode[STIX]{x1D703}_{i}-\unicode[STIX]{x1D6FC}_{k})]\frac{\exp (b\unicode[STIX]{x1D703}_{i}+\unicode[STIX]{x1D6FE}_{k})}{1+\exp (b\unicode[STIX]{x1D703}_{i}+\unicode[STIX]{x1D6FE}_{k})}, & & \displaystyle\end{eqnarray}$$
where
 $b$
is the general weight of the trait level in the guessing component and
 $\unicode[STIX]{x1D6FE}_{k}$
is termed “guessing” parameter corresponding to a respondent with an average trait level on the logistic scale.Footnote
10
According to San Martín, Del Pino, and De Boeck (Reference San Martín, Guido and De Boeck2006), the 1PL-AG model differs from the 3PL model in several ways. First, a successful guess is related to latent traits and, thus, the guessing parameter
 $c$
in Equation (2) is formulated as a function of latent traits. Second, a general parameter
 $b$
is used to represent the weight of the ability in the guessing component and, thus, the discrimination parameter
 $\unicode[STIX]{x1D6FD}_{k}$
is excluded. Finally, the parameter
 $\unicode[STIX]{x1D6FE}_{k}$
is used as the guessing parameter, which determines the probability of a successful guess when
 $b=0$
, that is, guessing is not ability related.
Considering a successful guess as a function of trait levels and item properties, we extend the 1PL-AG model to include the item-discrimination parameter
 $\unicode[STIX]{x1D6FD}_{k}$
and make a modification with a replacement of
 $\unicode[STIX]{x1D6FE}_{k}$
by
 $-\unicode[STIX]{x1D6FC}_{k}$
. Moreover, we allow the weighting parameter to vary across items. As a result, the proposed model, termed the two-parameter logistic guessing (2PL-G) model, is specified as
 $$\begin{eqnarray}\displaystyle \Pr (y_{i,k}=1|\unicode[STIX]{x1D703}_{i},\unicode[STIX]{x1D6FC}_{k},\unicode[STIX]{x1D6FD}_{k},b_{k}) & = & \displaystyle \unicode[STIX]{x1D6EC}[\unicode[STIX]{x1D6FD}_{k}(\unicode[STIX]{x1D703}_{i}-\unicode[STIX]{x1D6FC}_{k})]\nonumber\\ \displaystyle & & \displaystyle +\,(1-\unicode[STIX]{x1D6EC}[\unicode[STIX]{x1D6FD}_{k}(\unicode[STIX]{x1D703}_{i}-\unicode[STIX]{x1D6FC}_{k})])\left(\frac{\exp [b_{k}(\unicode[STIX]{x1D703}_{i}-\unicode[STIX]{x1D6FC}_{k})]}{1+(M-1)\exp [b_{k}(\unicode[STIX]{x1D703}_{i}-\unicode[STIX]{x1D6FC}_{k})]}\right),\end{eqnarray}$$
where
 $M$
is the number of choice options for a multiple-choice item. Like Equation (3), the model presented by Equation (4) has two terms contributing to the probability of item success. The first term contributes to the success probability due to ability and the second term contributes to the success probability due to guessing.
The 2PL-G model differs from the 1PL-AG model in the following ways. First, we use the item-difficulty parameter
 $\unicode[STIX]{x1D6FC}_{k}$
rather than
 $\unicode[STIX]{x1D6FE}_{k}$
in the guessing component because a successful guess is not only determined by ability but also by how hard an item is. Second, the weighting parameter varies across items to show differences between items, which is the main reason why IRT models are better than the classical test theory. Third, we include a constant
 $M$
in the guessing component to reflect the fact that guessing is related to the number of choice options. Finally, the inclusion of
 $M$
limits the highest probability of guessing to
 $1/(M-1)$
because the probability of a successful guess higher than
 $1/(M-1)$
reflects partial knowledge, which should be accounted for in the first component. Moreover, this setting also solves the interpretation problem suffered by the 1PL-AG model because both components depend on ability (San Martín, Del Pino, and De Boeck Reference San Martín, Guido and De Boeck2006, p. 187).Footnote
11
3.2 Properties of the proposed 2PL-G model
Some properties of the proposed 2PL-G model, compared to the conventional 2PL and 3PL models, are discussed in this subsection. Following the literature on IRT, ICCs are displayed to describe how changes in the trait level relate to changes in the probability of a specified response. First, the inclusion of
 $M-1$
in the guessing component of Equation (4) indicates that the asymptotic probability of a successfully random guess for
 $\unicode[STIX]{x1D703}\rightarrow -\infty$
is equal to
 $1/M$
, given that
 $\unicode[STIX]{x1D6FC}=0$
and
 $b=0$
. For example, suppose that
 $M=4$
, that is, there are four options for a multiple-choice item. A respondent with the lowest trait level has a probability of
 $1/4$
of randomly choosing the correct response (
 $b=0$
) to an item with average difficulty (
 $\unicode[STIX]{x1D6FC}=0$
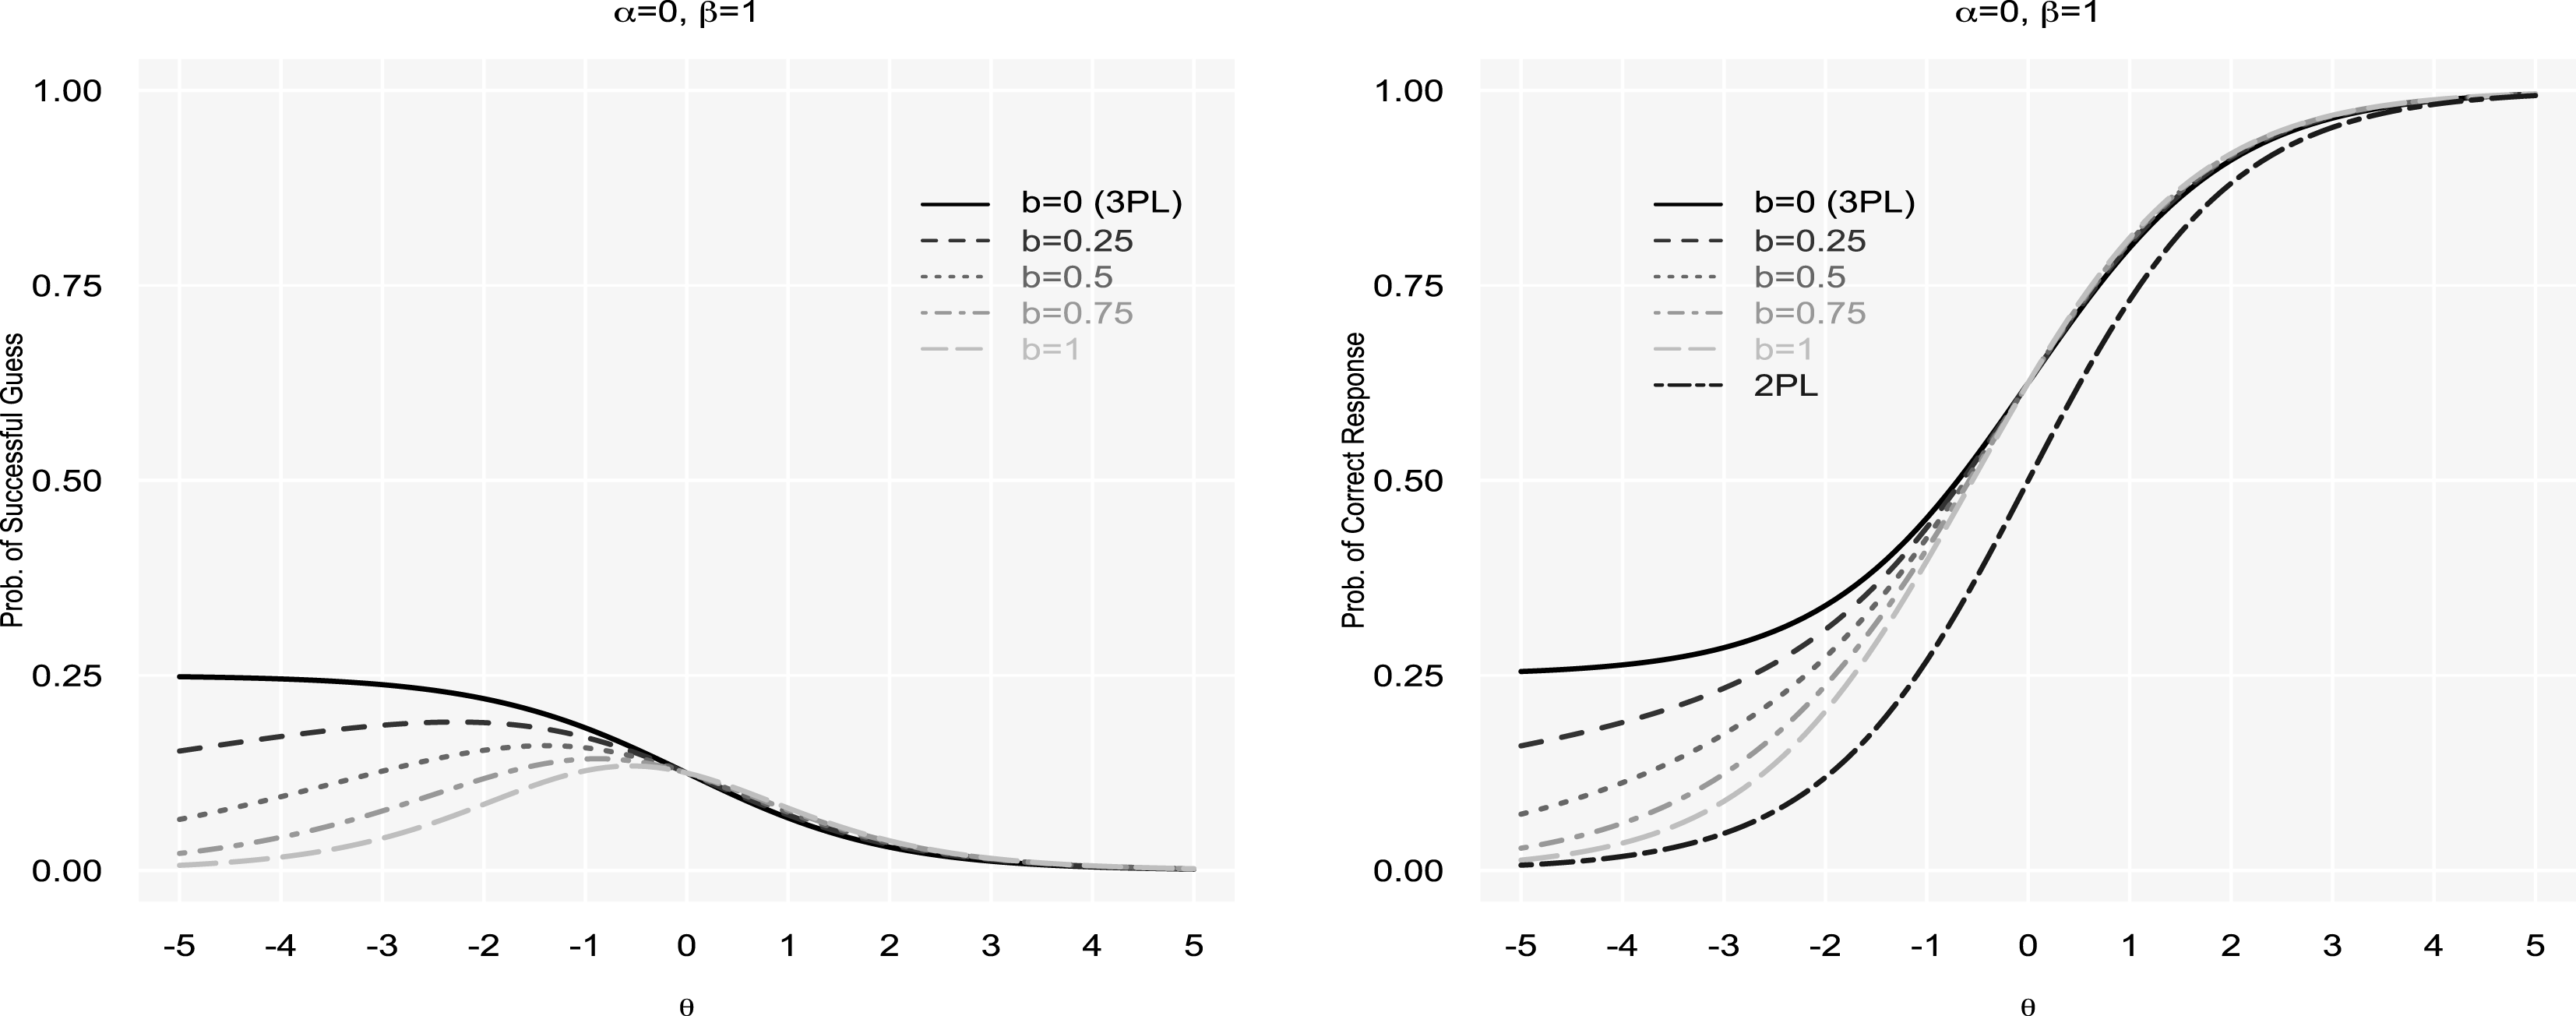
), which is represented by the black solid curve in the left panel of Figure 1.
Second, the weighting parameter
 $b$
indicates how important the level of ability is for the probability of a successful guess for an item, given that item parameters
 $\unicode[STIX]{x1D6FC}$
and
 $\unicode[STIX]{x1D6FD}$
are fixed. The left panel of Figure 1 shows that, as the value of
 $b$
increases, the probability of a successful guess for respondents with the lowest trait level decreases and the density becomes more concentrated around the average trait level. In the context of political knowledge, this property basically reflects the fact that both partially informed and barely informed respondents are more likely to guess than well-informed ones, but partially informed respondents are more likely to have a successful guess than barely informed ones. Barely informed respondents would make guesses with a low probability of being correct and the chance of guessing the correct answer is lower than randomly guessing because they are highly seducible by the attractive distractors. Furthermore, the reason why well-informed respondents have a relatively low probability of a successful guess is that their high trait levels play the major role in contributing to the probability of item success. Therefore, partially informed respondents have a higher probability of a successful guess than both barely informed and well-informed ones.
The probability of a successful guess and that of correct response for a four-category multiple-choice item. Item parameters
 $\unicode[STIX]{x1D6FC}$
and
 $\unicode[STIX]{x1D6FD}$
are fixed while
 $b$
is varied.

Third, related to the second property, respondents with relatively low trait levels are considerably affected by the weighting parameter
 $b$
, in terms of the probability of item success. The right panel of Figure 1 shows the ICCs for different values of
 $b$
given that
 $\unicode[STIX]{x1D6FC}=0$
and
 $\unicode[STIX]{x1D6FD}=1$
. As can be seen, the probability of item success for respondents with lower trait levels decreases when correct guessing requires high ability levels, which is reflected by the increase in the value of
 $b$
. Moreover, no matter how large
 $b$
is, the ICCs suggest that the success probability due to guessing always contributes to the probability of item success for partially informed respondents, compared to the ICC of a 2PL model displayed by the black two-dashed curve, which has no guessing component. In contrast, the probability of guessing contributes less to the probability of item success for well-informed respondents since they are knowledgeable enough to correctly answer these items.
Fourth, the black solid curve in Figure 1 is equivalent to a 3PL model with
 $c=0.25$
. In a traditional 3PL model, i.e., Equation (1), the lower asymptote theoretically lies between the interval 0 and 1 regardless of the number of options in a multiple-choice item and is an unknown parameter to be estimated. More importantly, it implies that the guessing component is an item property that applies to all respondents regardless of differences in item difficulty and levels of latent trait. In contrast, in the proposed 2PL-G model, the asymptotic probability is determined by both item characteristics (
 $M$
and
 $\unicode[STIX]{x1D6FC}$
) and levels of latent trait (depending on the magnitude of
 $b$
), which makes the 3PL model a special case of the 2PL-G model.
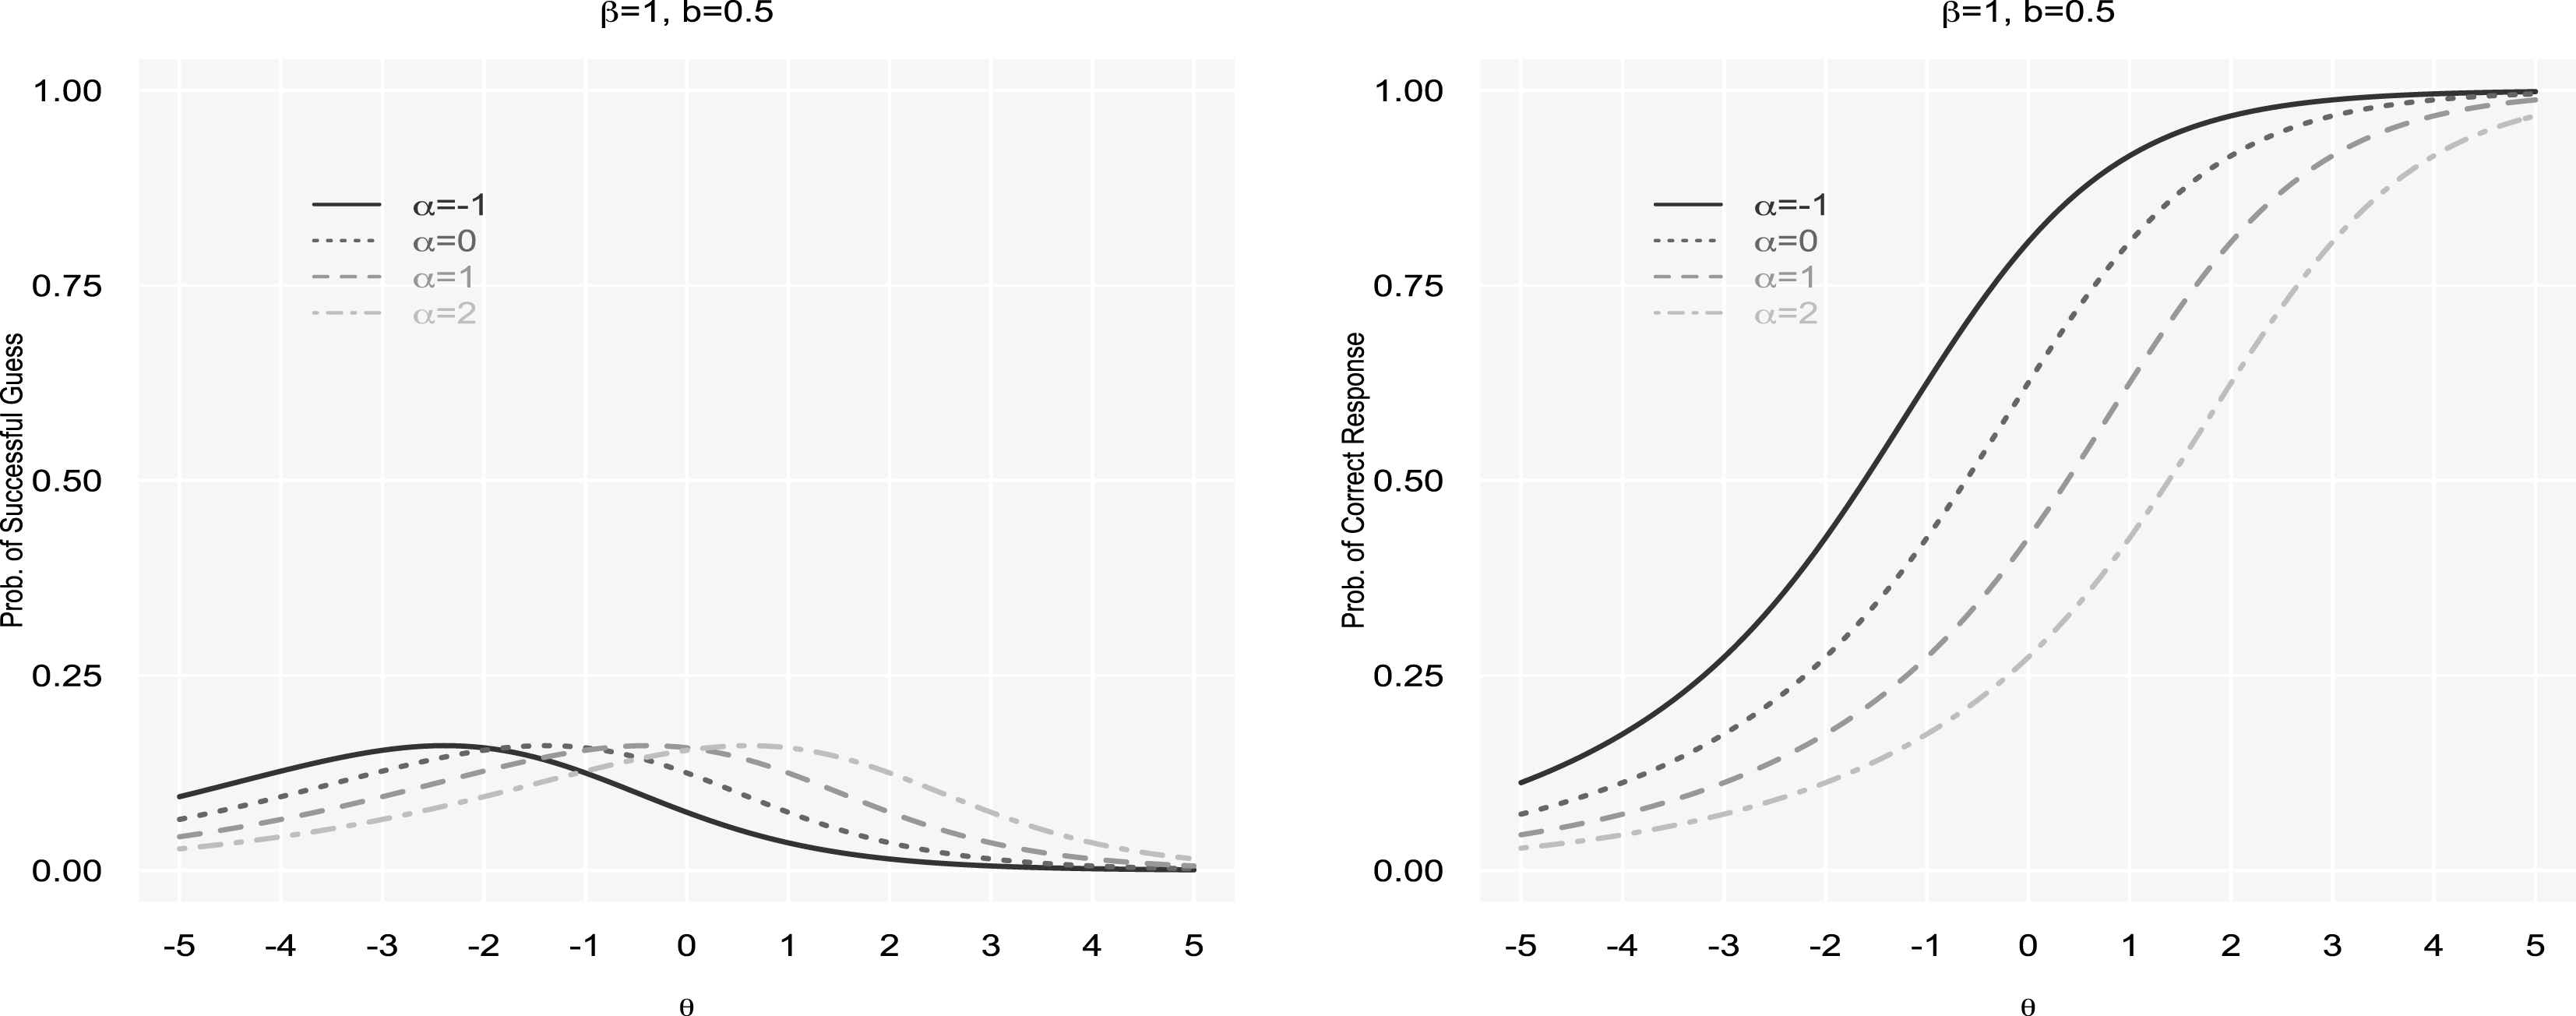
Finally, the 2PL-G model allows not only differences in trait levels but also those in item difficulty in the guessing component. The left panel of Figure 2 shows how changes in item difficulty relate to changes in the probability of a successful guess, which suggests that, as items become more difficult, higher ability is required for respondents to have a successful guess. As can be seen, the effects of
 $b$
and
 $\unicode[STIX]{x1D6FC}$
on the probability of a successful guess are quite different but jointly determine the probability of a successful guess for an item. Moreover, the corresponding ICCs are shown in the right panel of Figure 2. We can see that, when
 $b\neq 0$
, the probability of a correct response is slightly higher than 0.5 for a respondent with an average knowledge level (
 $\unicode[STIX]{x1D703}=0$
), given that
 $\unicode[STIX]{x1D6FC}=0$
and
 $\unicode[STIX]{x1D6FD}=1$
. The difference indicates the probability of a successful informed guess.
The probability of a successful guess and that of correct response for a four-category multiple-choice item. Item parameters
 $b$
and
 $\unicode[STIX]{x1D6FD}$
are fixed while
 $\unicode[STIX]{x1D6FC}$
is varied.

3.3 Prior distributions and identification
It is well known that the IRT models suffer from two identification problems: scale invariance and rotational invariance (Albert Reference Albert1992; Johnson and Albert Reference Johnson and Albert1999). The problem of scale invariance occurs because the metric (location and scale) of the latent trait is only known up to a linear transformation. Therefore, one must anchor the metric of the latent traits. The problem of rotational invariance refers to the fact that, for the unidimensional case, multiplying all of the model parameters by
 $-1$
would not change the value of the likelihood function.
We estimate the model presented in Equation (4) by a Bayesian approach, so we complete the model specification by defining the prior distribution. In the Bayesian context, the use of informative prior distributions can resolve these two identification problems (Johnson and Albert Reference Johnson and Albert1999; Martin and Quinn Reference Martin and Quinn2002). First, in typical IRT models, latent variables are assumed to be sampled from a normal distribution with mean 0 and finite variance
 $\unicode[STIX]{x1D70E}_{\unicode[STIX]{x1D703}}^{2}$
, that is,
 $$\begin{eqnarray}\unicode[STIX]{x1D703}_{i}\sim \text{N}(0,\unicode[STIX]{x1D70E}_{\unicode[STIX]{x1D703}}^{2}),\quad \text{for }i=1,\ldots ,N.\end{eqnarray}$$
To solve the problem of scale invariance, we can simply assume that
 $\unicode[STIX]{x1D70E}_{\unicode[STIX]{x1D703}}^{2}=1$
(Jackman Reference Jackman2009, p. 460).
Second, for item parameters
 $\unicode[STIX]{x1D6FD}_{k}$
,
 $\unicode[STIX]{x1D6FC}_{k}$
, and
 $b_{k}$
from Equation (4), we assume that
 $$\begin{eqnarray}\displaystyle & \displaystyle \unicode[STIX]{x1D6FD}_{k}\sim \text{N}(1,2)\mathbf{I}(\unicode[STIX]{x1D6FD}_{k}>0),\quad \text{for }k=1,\ldots ,K, & \displaystyle\end{eqnarray}$$
 $$\begin{eqnarray}\displaystyle & \displaystyle \unicode[STIX]{x1D6FC}_{k}\sim \text{N}(0,\unicode[STIX]{x1D70E}_{\unicode[STIX]{x1D6FC}}^{2}),\quad \text{for }k=1,\ldots ,K, & \displaystyle\end{eqnarray}$$
 $$\begin{eqnarray}\displaystyle & \displaystyle b_{k}\sim \text{Uniform}(0,1),\quad \text{for }k=1,\ldots ,K, & \displaystyle\end{eqnarray}$$
where
 $\mathbf{I}(\cdot )$
denotes an indicator function and
 $\unicode[STIX]{x1D70E}_{\unicode[STIX]{x1D6FC}}^{2}$
follows the conjugate inverse gamma prior:
 $$\begin{eqnarray}\unicode[STIX]{x1D70E}_{\unicode[STIX]{x1D6FC}}^{2}\sim \text{Inverse-Gamma}(0.01,0.01).\end{eqnarray}$$
The rotation invariance problem is solved by restricting item-discrimination parameters to be positive. This is because ICCs with positive item-discrimination parameters indicate that respondents answer test items correctly if they have higher ability. This form of constraint is sometimes known as “anchoring” (Skrondal and Rabe-Hesketh Reference Skrondal and Rabe-Hesketh2004, p. 66). The truncated normal prior with mean 1 and variance 2 for
 $\unicode[STIX]{x1D6FD}_{k}$
reflects the fact that item-discrimination parameters usually take values between the interval 0.5 and 3 (Fox Reference Fox2010, p. 21). The hyper prior
 $\text{Inverse-Gamma}(0.01,0.01)$
for
 $\unicode[STIX]{x1D70E}_{\unicode[STIX]{x1D6FC}}^{2}$
is set to present noninformativeness. We assume a uniform prior between 0 and 1 for parameter
 $b_{k}$
. If the estimates of
 $b_{k}$
are different from 0, it shows evidence supporting the proposed model against the 3PL model, which implies informed guess rather than random guess.Footnote
12
Increasingly, scholars agree that it is inappropriate to simply pool DKs and incorrect responses together as a single absence-of-knowledge category (Mondak and Davis Reference Mondak and Davis2001; Mondak and Anderson Reference Mondak and Anderson2004; Miller and Orr Reference Miller and Orr2008; Gibson and Caldeira Reference Gibson and Caldeira2009). Therefore, in the estimation process, DKs are treated as missing values rather than incorrect responses.
4 Data and Analysis
The analyzed dataset is survey data conducted by the TEDS project and included in Module 4 of the Comparative Studies of Electoral Systems (CSES): the presidential and legislative elections of 2012 (TEDS2012).Footnote 13 This dataset has 1,826 samples, collected by face-to-face interview after the 2012 election (from January to March), and includes three open-ended items and four multiple-choice items about political affairs in order to investigate the Taiwanese public’s political knowledge. These knowledge questions are DK-neutral items, which makes the TEDS data opportune to investigate guessing components in the measurement of political knowledge. In the survey process, interviewers were instructed to accept but not to offer the DK option in advance. In other words, interviewers neither encouraged nor discouraged respondents to answer DK and just recorded respondents’ answers including DKs. As discussed before, this format of political knowledge items, to some extent, excludes the effects of respondents’ personality and leaves little knowledge within the DK responses. To show the generalizability of the proposed 2PL-G model, we also analyze the dataset from the American National Election Studies: Evaluations of Government and Society Study, Survey 4 (ANES-EGSS4) and present the results in Appendix A.
4.1 Descriptive statistics
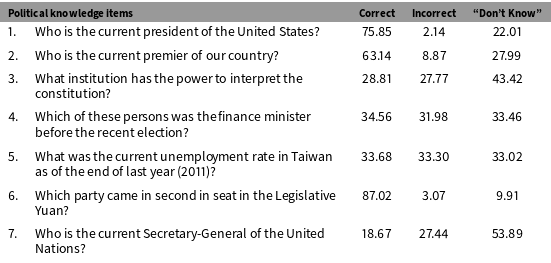
Table 2 shows the seven political knowledge items and corresponding distributions of responses. Based on the distributions of responses, these items can be roughly classified into three groups: (1) US President, Premier, and Second Legislative Party; (2) Constitutional Interpretation, Finance Minister, and Unemployment Rate; and (3) UN Secretary-General. We can observe guessing behavior in the multiple-choice items. For example, the three items of the first group are relatively easy for survey respondents to answer. The percentages of correct responses for these three items are
 $75.85\%$
,
 $63.14\%$
, and
 $87.02\%$
, respectively. Furthermore, comparing Second Legislative Party to US President and Premier, we observe a higher percentage of correct responses and a lower percentage of DKs in the multiple-choice item (Second Legislative Party) than in the open-ended ones (US President and Premier), which implies guessing behavior in the multiple-choice item.
The distributions of responses to knowledge items in TEDS2012.

Note: The first three knowledge items are open-ended while the other four are multiple-choice items. Row percentages are displayed.
Second, the percentages of correct responses for the three items of the second group are
 $28.81\%$
,
 $34.56\%$
, and
 $33.68\%$
, respectively. These items are slightly hard for the public in Taiwan to answer. In other words, respondents require some extent of political knowledge to get these items correct. Table 2 shows that one third of the respondents choose the DK option in the two multiple-choice items (Finance Minister and Unemployment Rate), which suggests that these respondents may not know the answers. Furthermore, comparing Constitutional Interpretation with Finance Minister and Unemployment Rate, the proportion of DKs is a little higher in the open-ended item (Constitutional Interpretation) than that in the multiple-choice items (Finance Minister and Unemployment Rate). This result implies that some respondents choose DK in Constitutional Interpretation, but may guess the answers in Finance Minister and Unemployment Rate.
Finally, as shown in Table 2, only 18.67% of the respondents correctly answer the question about the current Secretary-General of the UN, which implies that this is a much harder question among these seven items. This highly difficult item also results in a high percentage of DKs (53.89%). Furthermore, incorrect responses are more than correct ones, which is the evidence of guessing behavior. It indicates that, for respondents who are uncertain about the answer, some of them choose the DK option and others choose the wrong answers since it requires higher levels of political knowledge to guess the correct one.
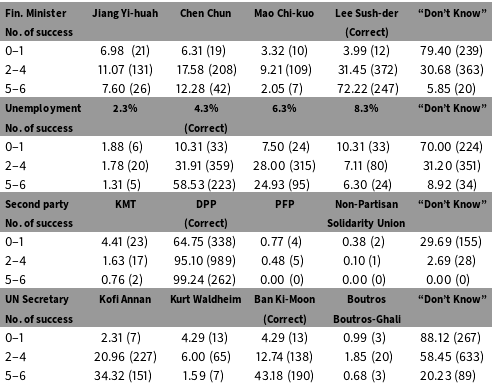
To illustrate (mis)informed guessing, in Table 3 we further display the distributions of choice options for the four multiple-choice items against the number of correct responses excluding the given item. Presumably respondents with relatively high levels of knowledge would have more correct responses and are more likely to select the correct option for a multiple-choice item and less likely to choose the DK option. For the purpose of illustration, we roughly classify respondents into three groups based on the number of correct responses (0 to 1, 2 to 4, and 5 to 6 correct responses). Consider Finance Minister as an example, first of all, for the first group in which respondents at most correctly answer one item among the remaining six items, there are only
 $3.99\%$
of correct responses while there are
 $79.4\%$
of respondents who choose DK. The percentage of correct responses rises to
 $31.45\%$
for the second group and to
 $72.22\%$
for the third group. In contrast, the percentage of DKs is
 $79.4\%$
for the first group and goes down to
 $30.68\%$
and
 $5.85\%$
for the second and third groups, respectively. For the purpose of illustration, we temporarily assume that the three groups represent uninformed/barely informed, moderately informed, and well-informed/fully informed respondents, respectively.
The distributions of choice options against the number of item success in TEDS2012.

Note: Row percentages are presented and the corresponding counts are in parentheses.
Table 3 shows that barely informed respondents do not randomly select an answer among the options, but misinformedly select wrong answers, except for the easiest item. For example, for the question of Finance Minister, the proportions of respondents with relatively low-level knowledge choosing one of the first two options are higher than that choosing the correct one. For Unemployment Rate and UN Secretary-General, although the correct answer is one of the highest chosen options, the other highest chosen one is an absurd answer. This evidence suggests that these respondents do not randomly but mistakenly choose the answer when they lack knowledge.
Table 3 also displays informed guessing for moderately informed and well-informed respondents. For example, about one fourth of moderately informed or well-informed respondents think the unemployment rate was
 $6.3\%$
in 2011 instead of
 $2.3\%$
or
 $8.3\%$
. The rate
 $6.3\%$
is a reasonable guess because unemployment was a rising issue and the unemployment rate has been between
 $4\%$
and
 $6\%$
since 2000 in Taiwan. Furthermore, for UN Secretary-General, numerous respondents can easily rule out two of the options (Kurt Waldheim and Boutros Boutros-Ghali). Some of them selected Kofi Annan as the answer to the question because they did not know Ban Ki-Moon succeeded Kofi Annan in 2007. This is the obvious evidence of informed guessing.
4.2 Results of analysis
We apply the 2PL-G model to analyzing the four multiple-choice items in the TEDS2012 dataset.Footnote 14 The model is estimated via Markov chain Monte Carlo (MCMC) methods (Albert and Chib Reference Albert and Chib1993; Fox Reference Fox2010) implemented in JAGS 4.2.0 (Plummer Reference Plummer, Hornik, Leisch and Zeileis2003) called from R version 3.3.1 (R2jags, Su and Yajima Reference Su and Yajima2012).Footnote 15 Before we investigate the guessing components in the four multiple-choice items, we compare the estimates of item parameters from three models: the 2PL model, the 3PL model in Equation (1), and the proposed 2PL-G model in Equation (4).
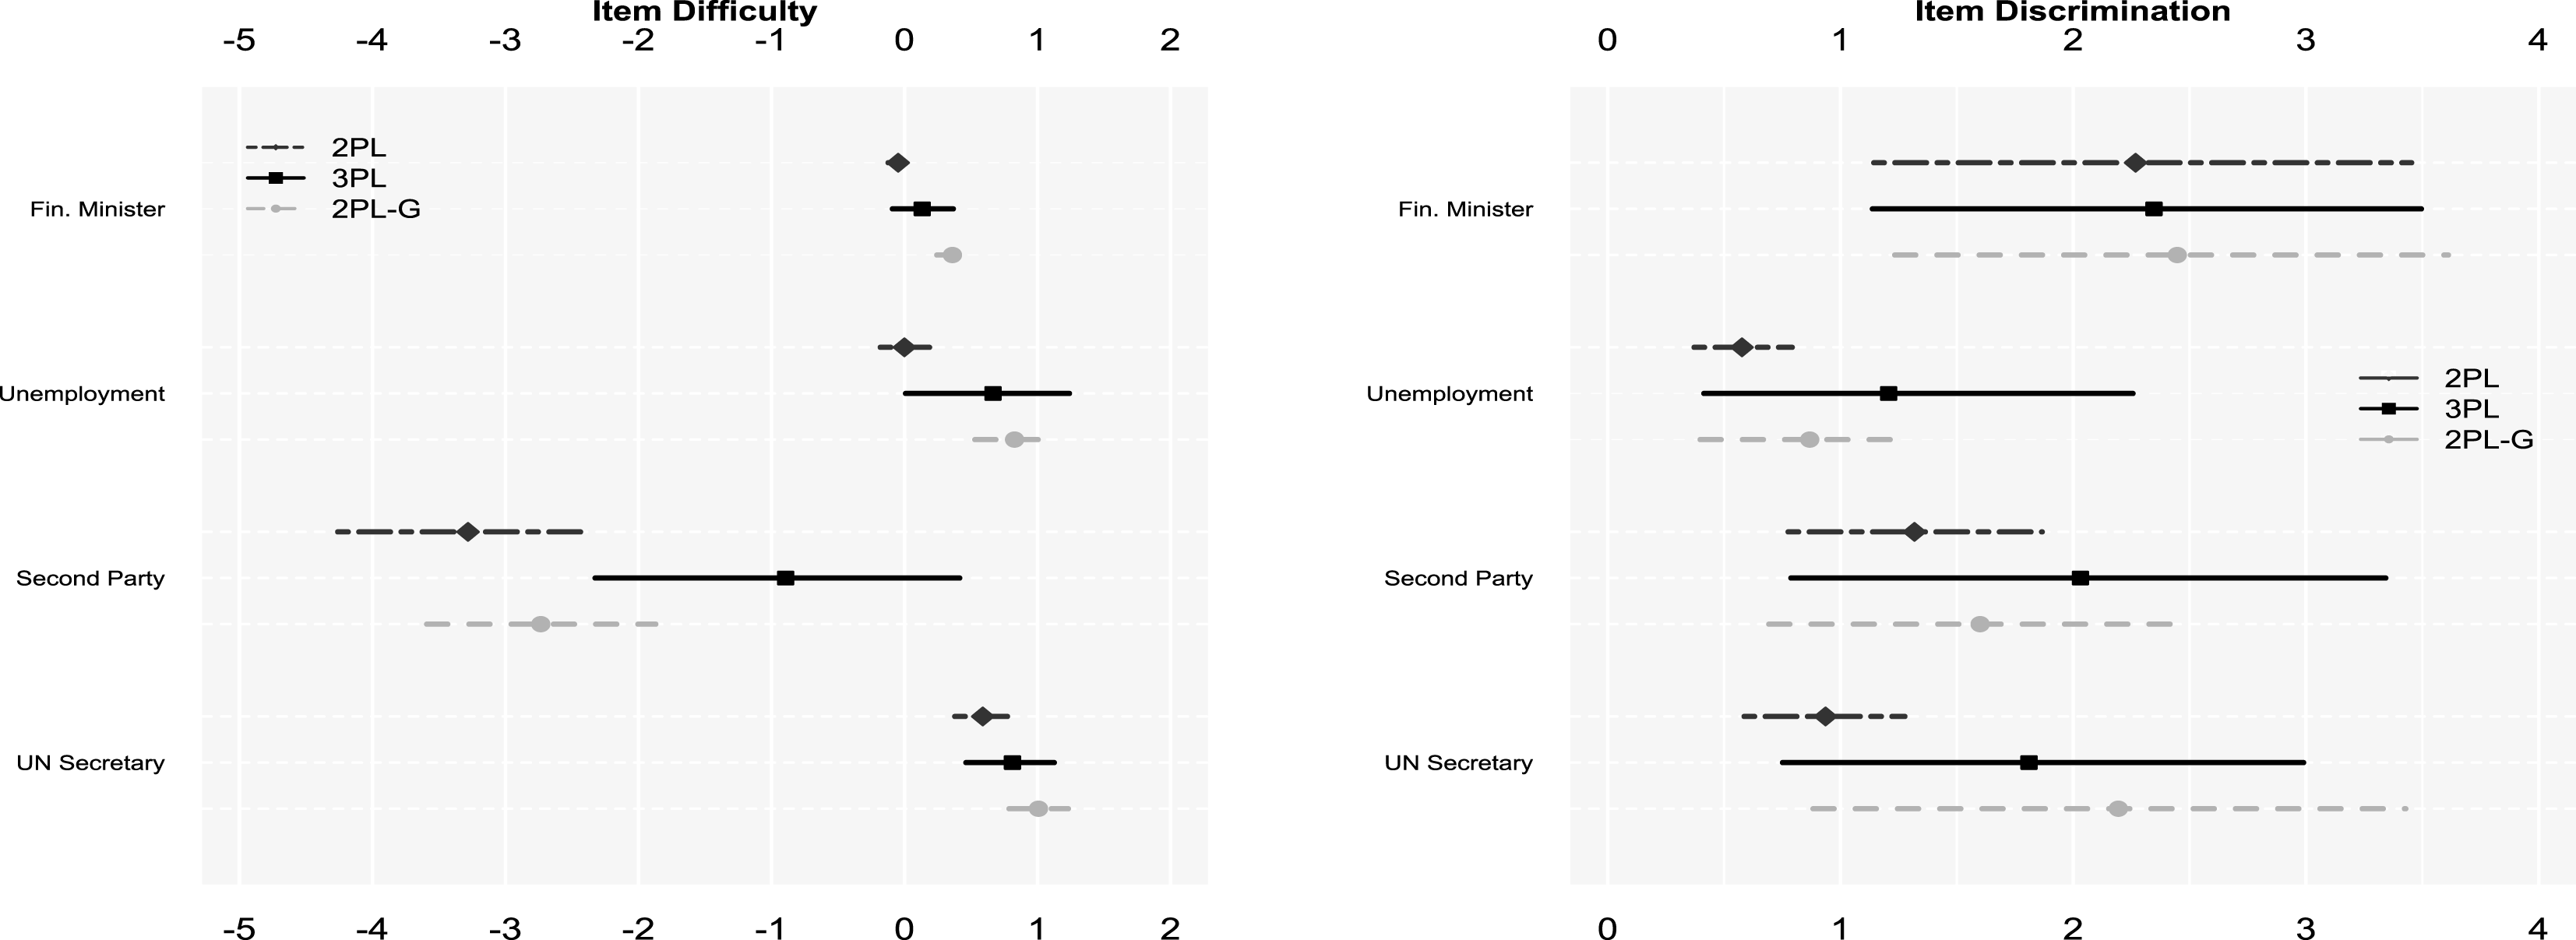
Figure 3 shows the 90% credible intervals of item-difficulty parameters on the left and those of item-discrimination parameters on the right for the four multiple-choice, political knowledge questions. As can be seen in Figure 3, the left panel shows that Second Legislative Party has the least value of item difficulty among these items, which indicates that it is a relatively easy question. On the contrary, Finance Minister, Unemployment Rate, and UN Secretary-General are relatively hard questions. According to Figure 3, the 3PL model and the 2PL-G model have relatively larger estimates of item-difficulty parameters, particularly Finance Minister and Unemployment Rate, compared to the 2PL model. This result suggests that, without considering the guessing components, the 2PL model might underestimate difficulty parameters for multiple-choice items and reflects the fact that some of the multiple-choice items are actually harder if we take potential guessed responses into account.
The 90% credible intervals of item parameters for the 2PL, 3PL, and 2PL-G models.

Compared to the 2PL-G model, the 3PL model has larger estimates of difficulty parameters for easy items but has smaller estimates of difficulty parameters for difficult items due to parameter
 $c$
. For easy items, the guessing components contribute too much to the probability of item success, which leads to a low probability of ability-based item success. Therefore, the difficulty parameters of easy items would be overestimated. By the same token, for hard questions, the guessing component does not contribute much to the probability of item success and, thus, a high probability of ability-based item success makes these items easier than they actually are. In contrast, the 2PL-G model does not suffer from this problem and provides more reasonable estimates of difficulty parameters when guessing behavior is taken into account.
The estimates of item-discrimination parameters are displayed in the right panel of Figure 3, which shows that the question Finance Minister performs well in discriminating different levels of political knowledge. Although the uncertainty of the item-discrimination parameter for Finance Minister is large, the three models show consistent results. In contrast, the estimates for the other three items are somewhat different. First, the 2PL model has less uncertainty, compared to the 3PL and 2PL-G models. Second, in terms of the means of the item-discrimination parameters, Second Legislative Party is the second best item in the 2PL and 3PL models while UN Secretary is the second best item in the 2PL-G model.
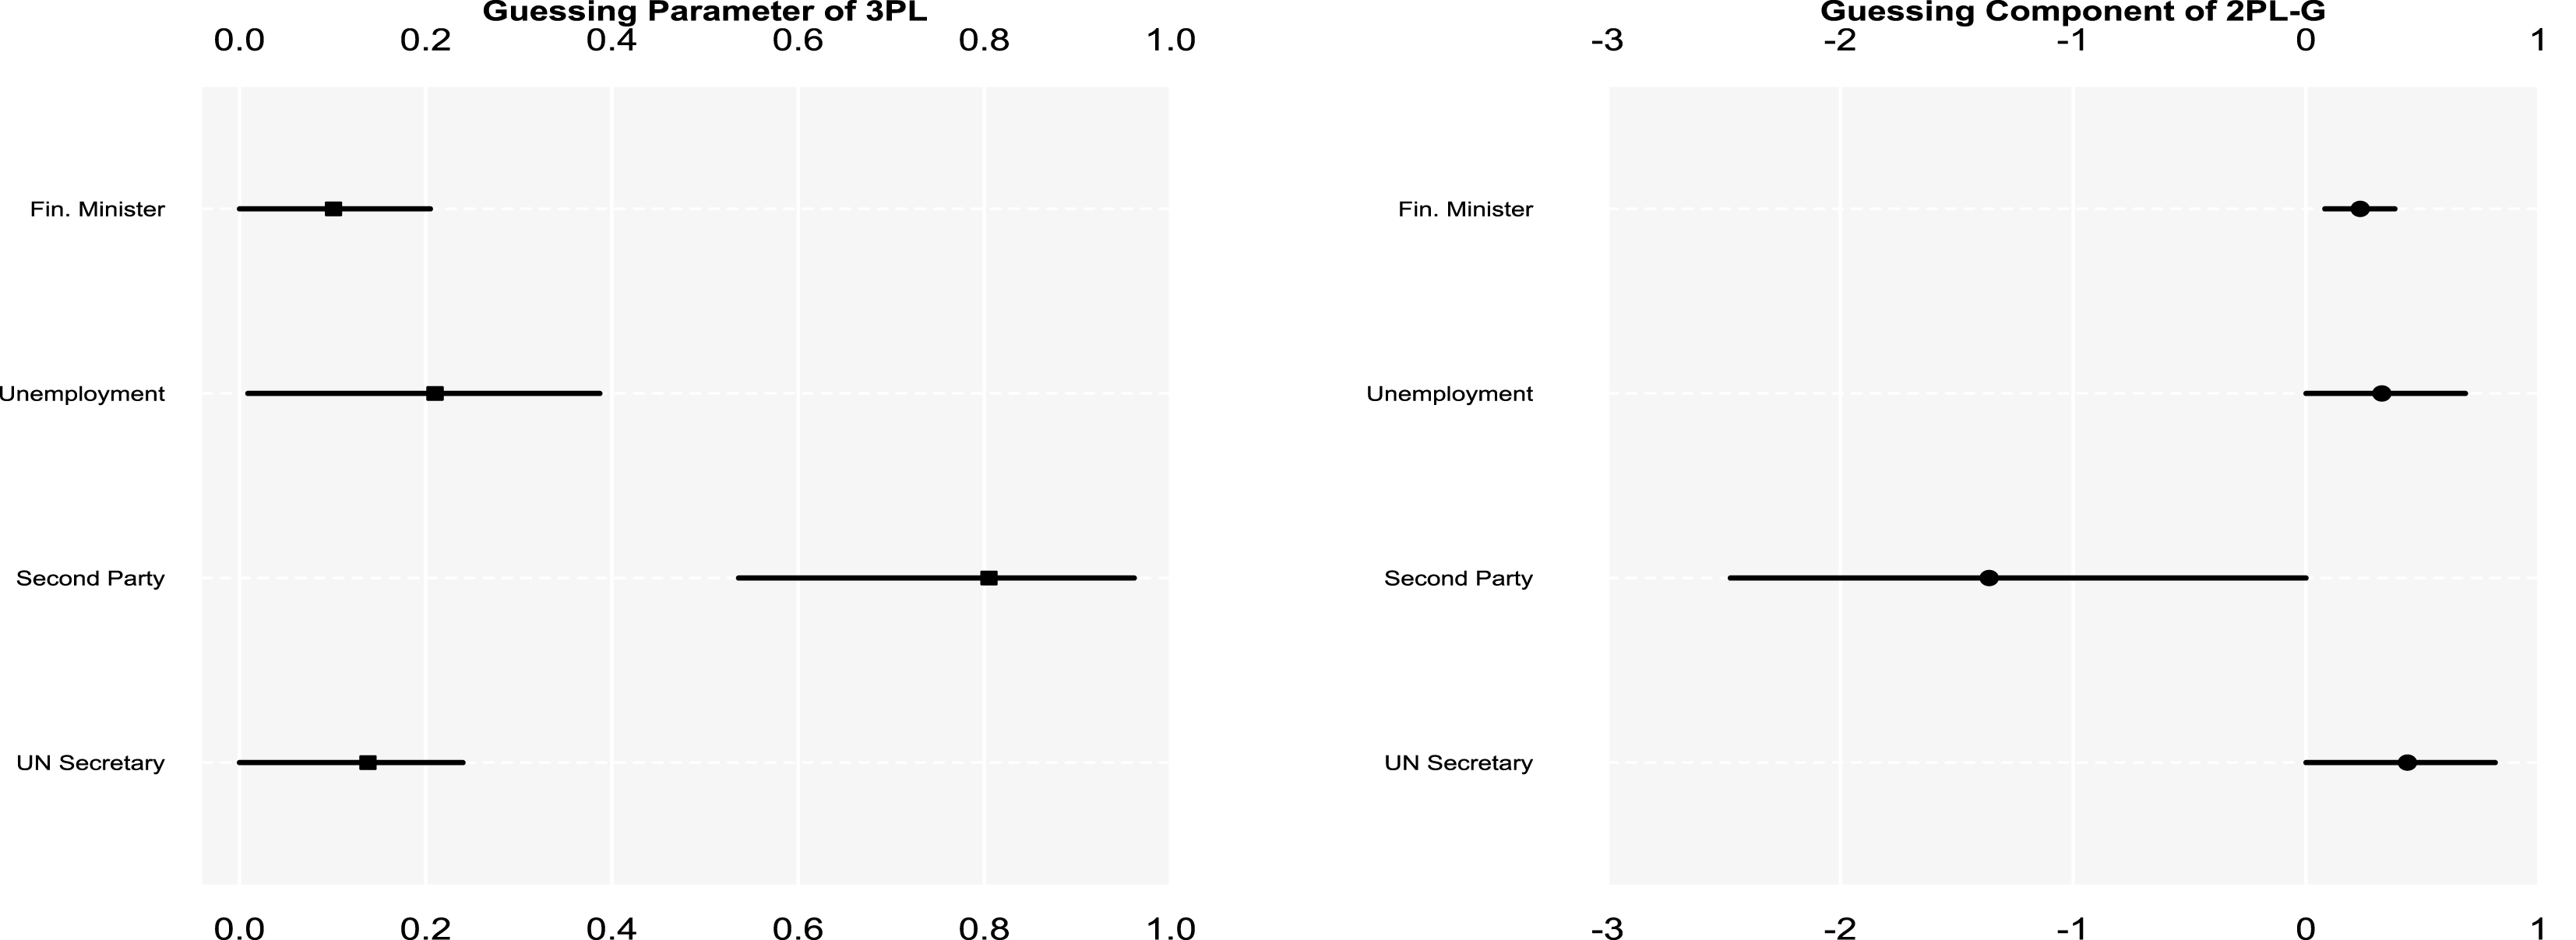
The left panel of Figure 4 shows the estimates of parameter
 $c_{k}$
for the 3PL model. The result suggests that Second Legislative Party is easy to guess for the uninformed and barely informed respondents. Regarding the 2PL-G model, because both
 $b_{k}$
and
 $\unicode[STIX]{x1D6FC}_{k}$
determine the guess components of multiple-choice items, we show the multiplication of the two parameters for each item.Footnote
16
Positive values of the multiplication mean that respondents need certain levels of knowledge to guess correctly while negative values indicate that respondents with low knowledge levels are able to have a successful guess. The result indicates that UN Secretary-General requires relatively high levels of political knowledge for respondents to correctly guess the answer.
The 90% credible intervals of guessing effects for the 3PL and 2PL-G models.

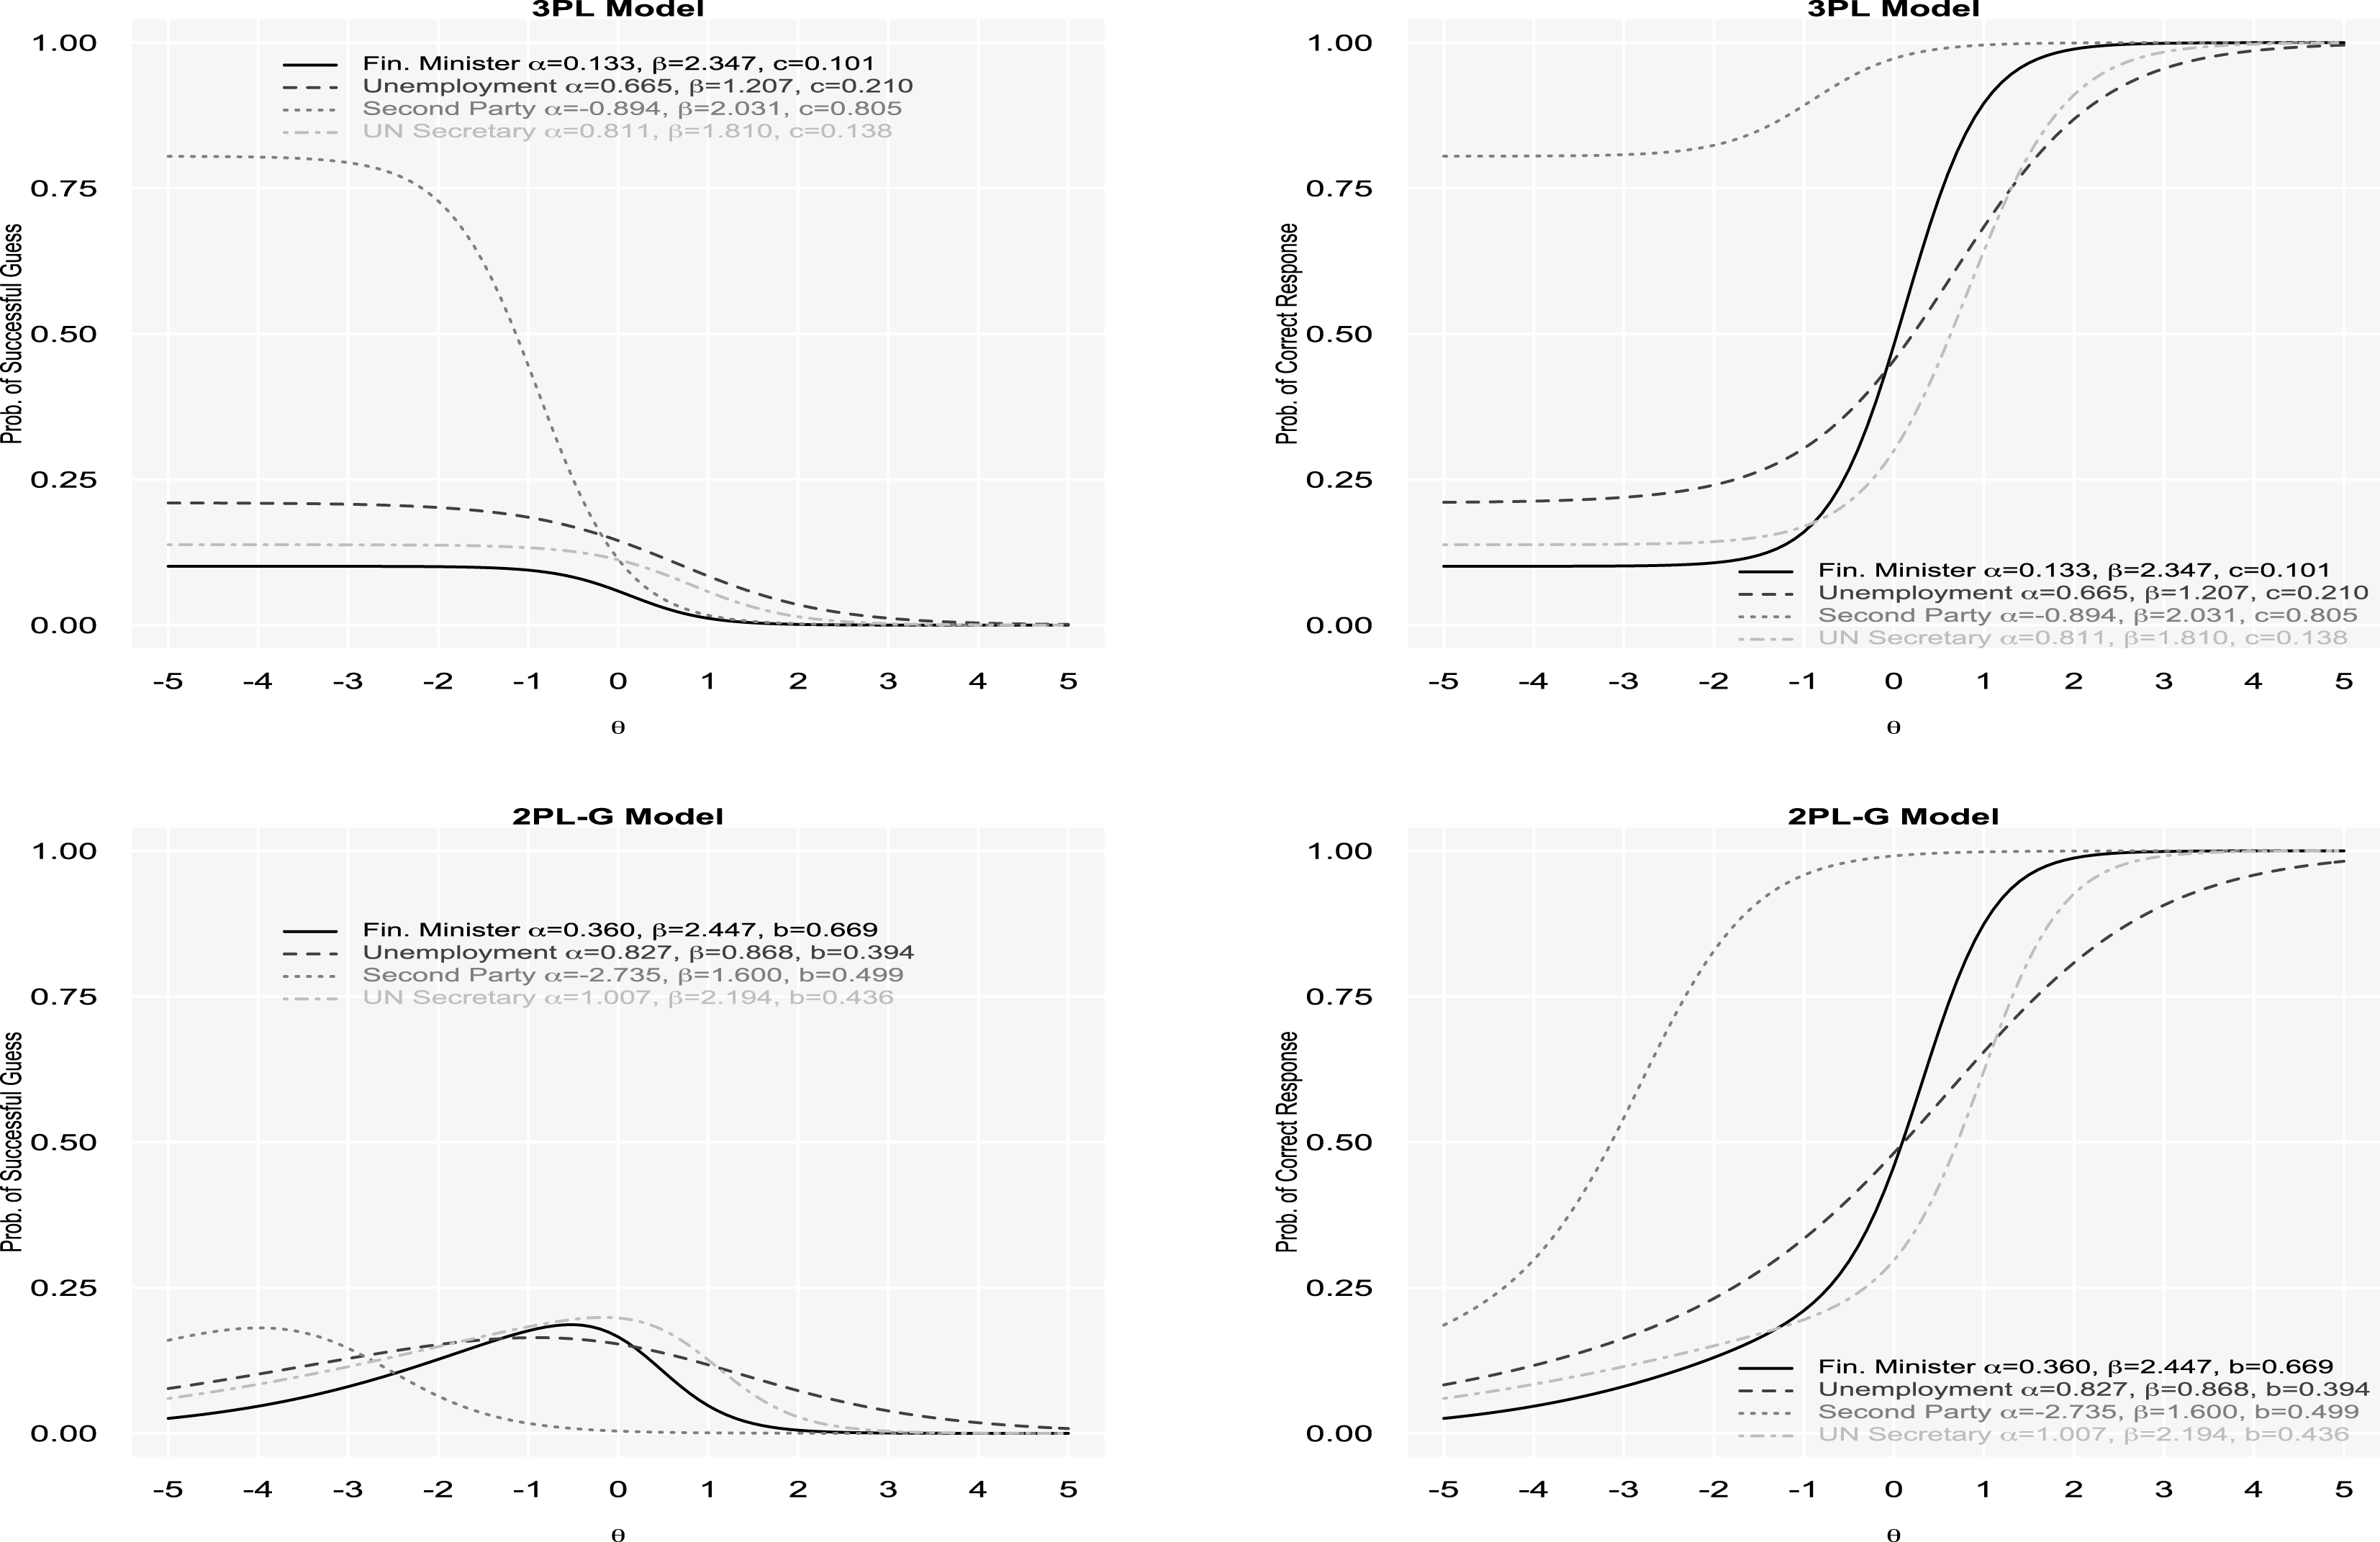
The probability of successful guesses and responses for the 3PL and 2PL-G models.

Figure 5 displays the probability of a successful guess and the probability of a correct response across different levels of political knowledge from the 3PL model (on the top) and the 2PL-G model (on the bottom) for the four multiple-choice items. The two top panels suggest that barely informed respondents have a higher probability to correctly guess the answer for multiple-choice items, compared to partially informed and well-informed respondents regardless of item difficulties. This setting is not supported by the real data shown in Table 3. Moreover, the two top panels demonstrate that the probability of a successful guess for uninformed respondents is higher than a random guess for Second Legislative Party and lower for the other three items. In contrast, the two bottom panels in Figure 5 illustrate an informed guess for items that require relatively high levels of political knowledge for respondents to guess the correct answers.
The results from the 2PL-G model are considerably consistent with the conventional wisdom about the status and amounts of Taiwanese information-obtaining channels which are associated with their levels of political knowledge. On the one hand, UN Secretary-General involves international affairs, which are relatively limited information in Taiwan’s traditional and electronic media. Therefore, respondents have to be relatively knowledgeable to correctly guess or answer who the UN Secretary-General is.
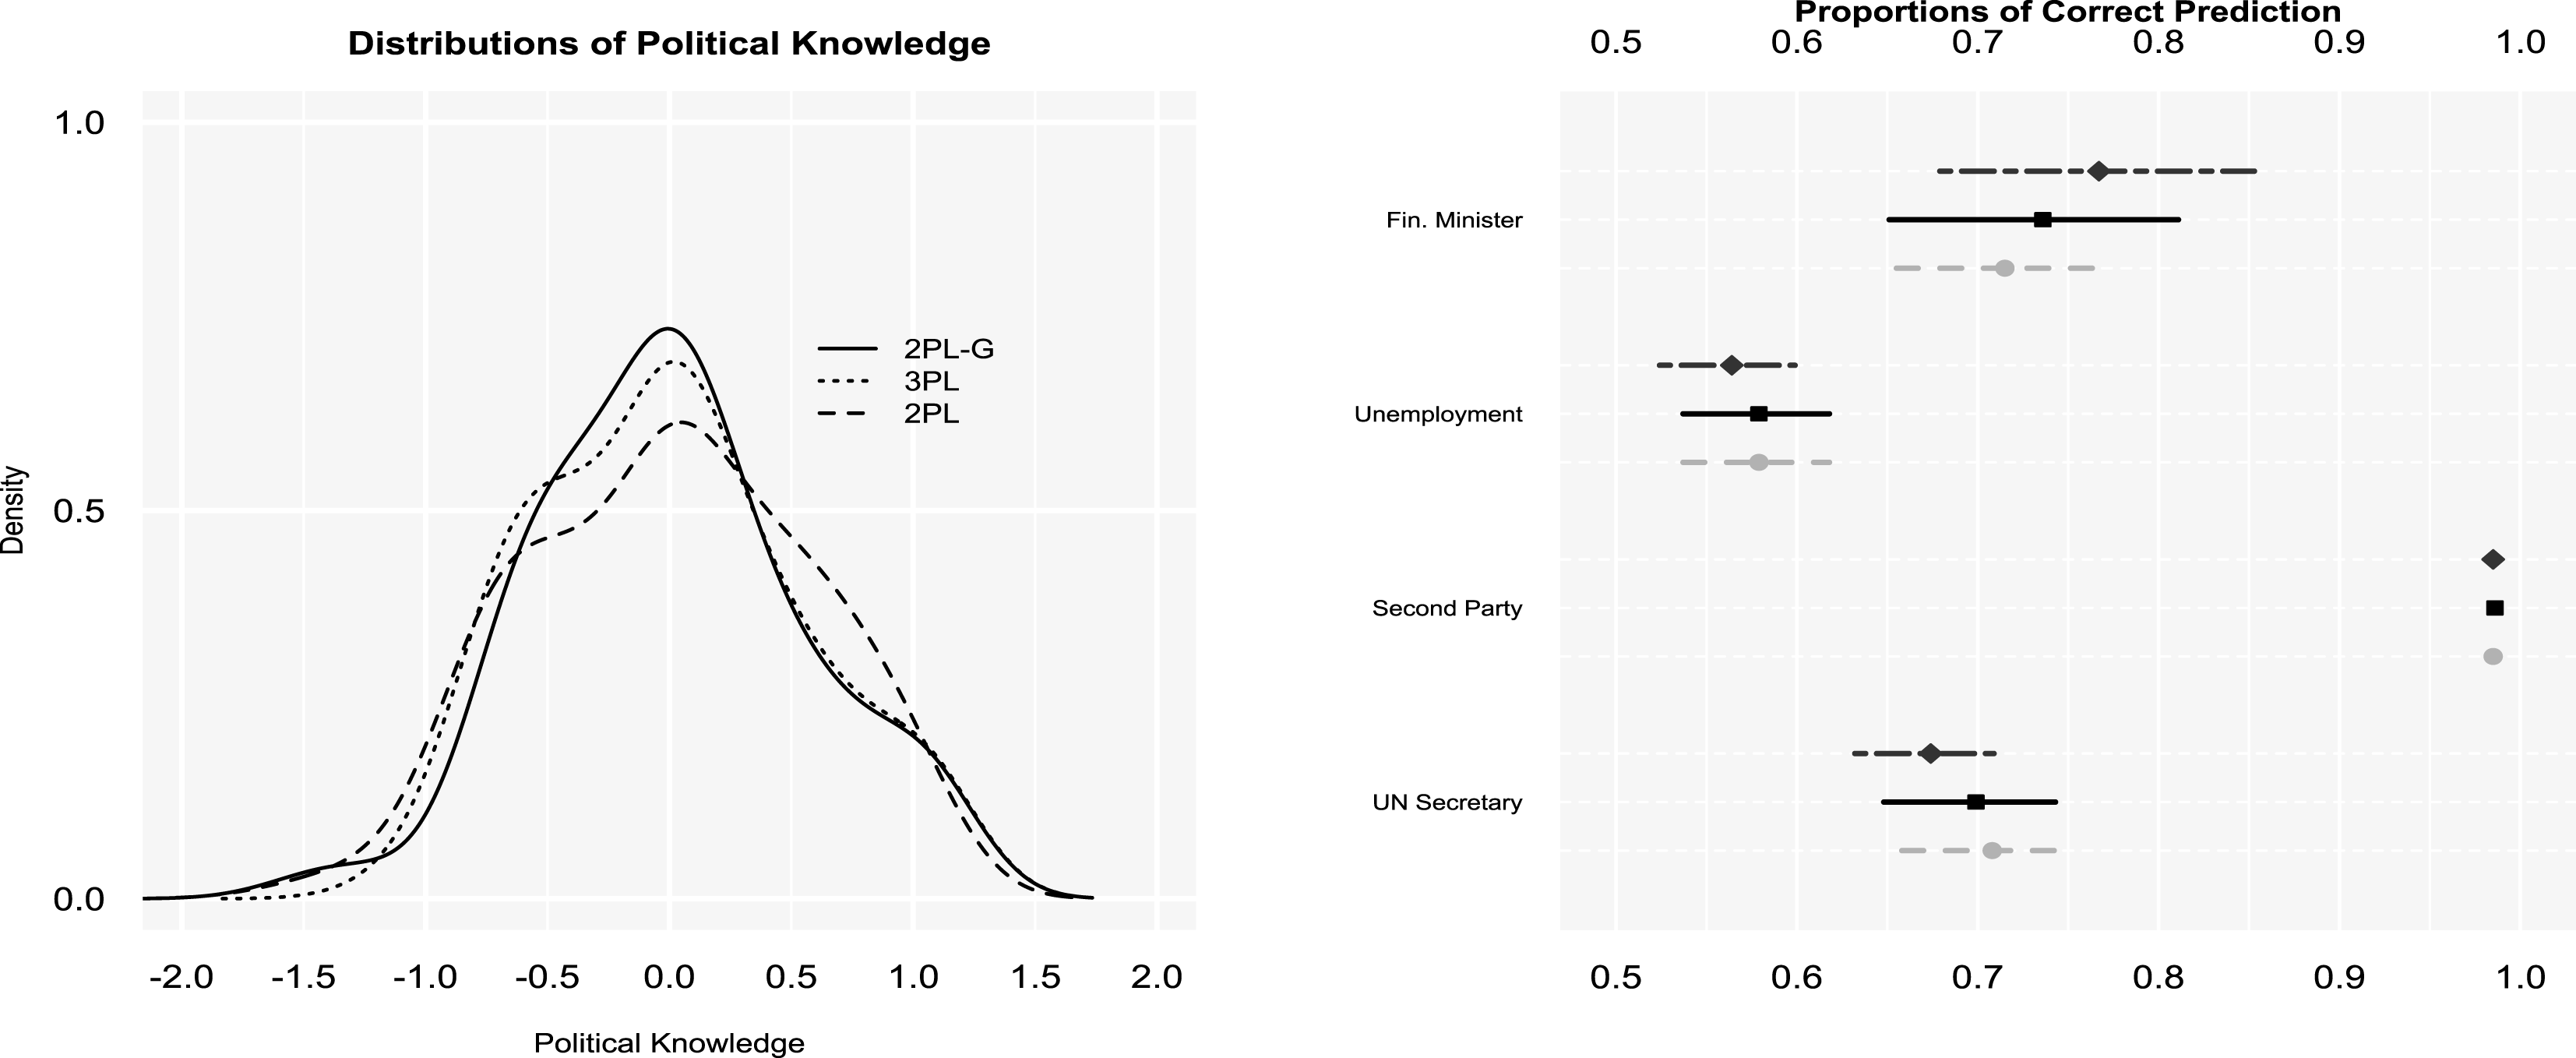
Comparisons between 2PL, 3PL, and 2PL-G. The left panel shows the distributions of political knowledge estimates. The right panel shows the 90% credible intervals of predictive accuracy.

On the other hand, Finance Minister, Unemployment Rate, and Second Legislative Party are questions about domestic politics. Second Legislative Party asks respondents which party came in the second in seats in the Legislature (Legislative Yuan). Information about party politics like this is more common in media reports and, therefore, citizens are more aware of party competition in both electoral and legislative arenas. So respondents with low-level knowledge are likely to guess/select the correct answer. Although Finance Minister and Unemployment Rate involve the fact of Taiwan’s politics, the public in Taiwan is less aware of both. The finance minister is relatively unknown than the prime minister due to limited media exposure, which explains why large proportions of barely and partially informed respondents select the two prime ministers during the survey data collection, Jiang Yi-huah (the premier from 2/18/2013 to 12/8/2014) and Chen Chun (the premier from 2/6/2012 to 2/18/2013). With regard to Unemployment Rate, the public may have partial information from the media to understand domestic economic situation but not necessarily know the exact figure of the unemployment rate. Therefore, relatively high knowledge levels are required for respondents to correctly guess or answer Finance Minister and Unemployment Rate, but not Second Legislative Party.
To see how the guessing components affect the estimates of political knowledge, we show the distributions of estimated knowledge levels in the left panel of Figure 6. As can be seen, the 2PL-G model provides more estimates of average knowledge level. This is because, when we take informed guessing into account, some respondents who are considered to have moderate levels of knowledge by the 2PL model would be estimated downwards. In other words, these respondents may be overestimated because they correctly answer questions based on informed guessing rather than certain information. Moreover, the respondents with relatively low levels of knowledge would be overestimated by the 3PL model because a high value of parameter
 $c$
leads to the overestimation of the easy item. These respondents would be estimated downwards by the 2PL-G model.Footnote
17
Finally, we asses the fit of the three models to data by the deviance information criterion (DIC) and predictive accuracy. The DIC of the 2PL-G model is 8505.4, which is much smaller than that of the 2PL (15059.7) and 3PL (12066.0) models. The result indicates that the 2PL-G fits the data better than the other two conventional IRT models. Moreover, to assess the performance of the three models in predictive accuracy, we select respondents who have at least one correct response and at most three correct responses to the four multiple-choice items because, as shown in Table 1 and the left panel of Figure 6, the differences between the three models mainly lie in the respondents who are neither uninformed nor well-informed. The right panel of Figure 6 displays the
 $90\%$
credible intervals of the proportions of correct prediction based on the 15,000 simulated samples from 1,493 respondents. As can be seen, the 2PL-G model is slightly better than the 2PL and 3PL models in Unemployment and UN Secretary, but not in Finance Minister, although there is no difference in terms of the overlapping of the 90% credible intervals.Footnote
18
4.3 Differential item functioning by gender
Individual differences in guessing may be influenced by some aggregate-level variables such as gender, education, and partisanship. For instance, some research argues that, when answering multiple-choice, political knowledge questions, men are more likely to guess while women are more likely to say “DK” due to the differences in personality (Mondak and Anderson Reference Mondak and Anderson2004; Lizotte and Sidman Reference Lizotte and Sidman2009). The differences in the propensity to guess might lead to the overestimation of men’s knowledge levels and underestimation of women’s knowledge levels, which induce the gender gap in political knowledge, because guessing increases the possibility of correct responses and DKs are conventionally treated as incorrect responses. The findings of this literature show that, when the differences in personality is taken into account, the gender gap in political knowledge decreases but does not disappear. In other words, even though the gender gap in political knowledge can be partially explained by the guessing effect, the finding that men are more knowledgeable than women is robust.
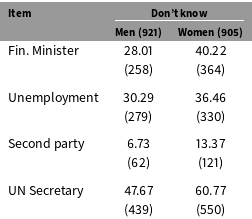
Percentages of DKs across gender in TEDS2012.

Note: Percentages are presented and counts are in the parentheses.
We find the results in the literature consistent with our argument, which is that a successful guess requires certain levels of knowledge. That is to say, if men could have a successful guess to multiple-choice items, that means they are partially knowledgeable to select the correct answers. To examine the gender gap in political knowledge in the TEDS2012 data, we first demonstrate the proportions of DK responses across gender in Table 4. As can be seen, the percentages of DK responses are higher for female respondents, which implies that women are less likely to guess. However, the differences in guessing propensity do not necessarily induce biased estimates if there is a trivial amount of knowledge concealed in DK responses (Sturgis, Allum, and Smith Reference Sturgis, Allum and Smith2008) or if a successful guess relies on partial knowledge as we argue in this article.
The differences between men and women in the propensity to guess, if not accounted for, would lead to different estimates of item parameters for different groups, which is referred to as differential item functioning (DIF) (Lizotte and Sidman Reference Lizotte and Sidman2009). In other words, if the propensity to guess is accounted for, there should be little difference between groups in the parameter estimates. Following this literature, we examine DIF by employing a multilevel framework to allow the item parameters to vary across gender.Footnote 19 A multilevel 2PL-G model is specified as follows:
 $$\begin{eqnarray}\displaystyle \Pr (y_{i,k}=1|\unicode[STIX]{x1D703}_{i},\unicode[STIX]{x1D6FC}_{j,k},\unicode[STIX]{x1D6FD}_{j,k},b_{j,k}) & = & \displaystyle \unicode[STIX]{x1D6EC}[\unicode[STIX]{x1D6FD}_{j,k}(\unicode[STIX]{x1D703}_{i}-\unicode[STIX]{x1D6FC}_{j,k})]\nonumber\\ \displaystyle & & \displaystyle +\,(1-\unicode[STIX]{x1D6EC}[\unicode[STIX]{x1D6FD}_{j,k}(\unicode[STIX]{x1D703}_{i}-\unicode[STIX]{x1D6FC}_{j,k})])\left(\frac{\exp [b_{j,k}(\unicode[STIX]{x1D703}_{i}-\unicode[STIX]{x1D6FC}_{j,k})]}{1+(M-1)\exp [b_{j,k}(\unicode[STIX]{x1D703}_{i}-\unicode[STIX]{x1D6FC}_{j,k})]}\right).\qquad\end{eqnarray}$$
And we assume that
 $$\begin{eqnarray}\displaystyle & \displaystyle \unicode[STIX]{x1D6FD}_{j,k}\sim \text{N}(1,2)\mathbf{I}(\unicode[STIX]{x1D6FD}_{j,k}>0),\quad \text{for }j=1,2;k=1,\ldots ,K, & \displaystyle\end{eqnarray}$$
 $$\begin{eqnarray}\displaystyle & \displaystyle \unicode[STIX]{x1D6FC}_{j,k}\sim \text{N}(0,\unicode[STIX]{x1D70E}_{\unicode[STIX]{x1D6FC}}^{2}),\quad \text{for }j=1,2;k=1,\ldots ,K, & \displaystyle\end{eqnarray}$$
 $$\begin{eqnarray}\displaystyle & \displaystyle b_{j,k}\sim \text{Uniform}(0,1),\quad \text{for }j=1,2;k=1,\ldots ,K, & \displaystyle\end{eqnarray}$$
where
 $j=1$
indicates male respondents and
 $j=2$
female respondents. For the identification of the multilevel 2PL-G model, the item parameters of Finance Minister are held constant, that is,
 $\unicode[STIX]{x1D6FC}_{1,1}=\unicode[STIX]{x1D6FC}_{2,1}=-3$
and
 $\unicode[STIX]{x1D6FD}_{1,1}=\unicode[STIX]{x1D6FD}_{2,1}=1.5$
. For the purpose of comparison, we also estimate a multilevel 3PL model.
First, we calculate the differences between women and men in the mean knowledge scores. The
 $90\%$
credible intervals of the mean differences for the 3PL and 2PL-G models are
 $[0.016,0.163]$
and
 $[0.008,0.156]$
, respectively. The results are consistent with the findings in the literature, which indicates that the gender gap in political knowledge still exists even after the guessing effect is accounted for.
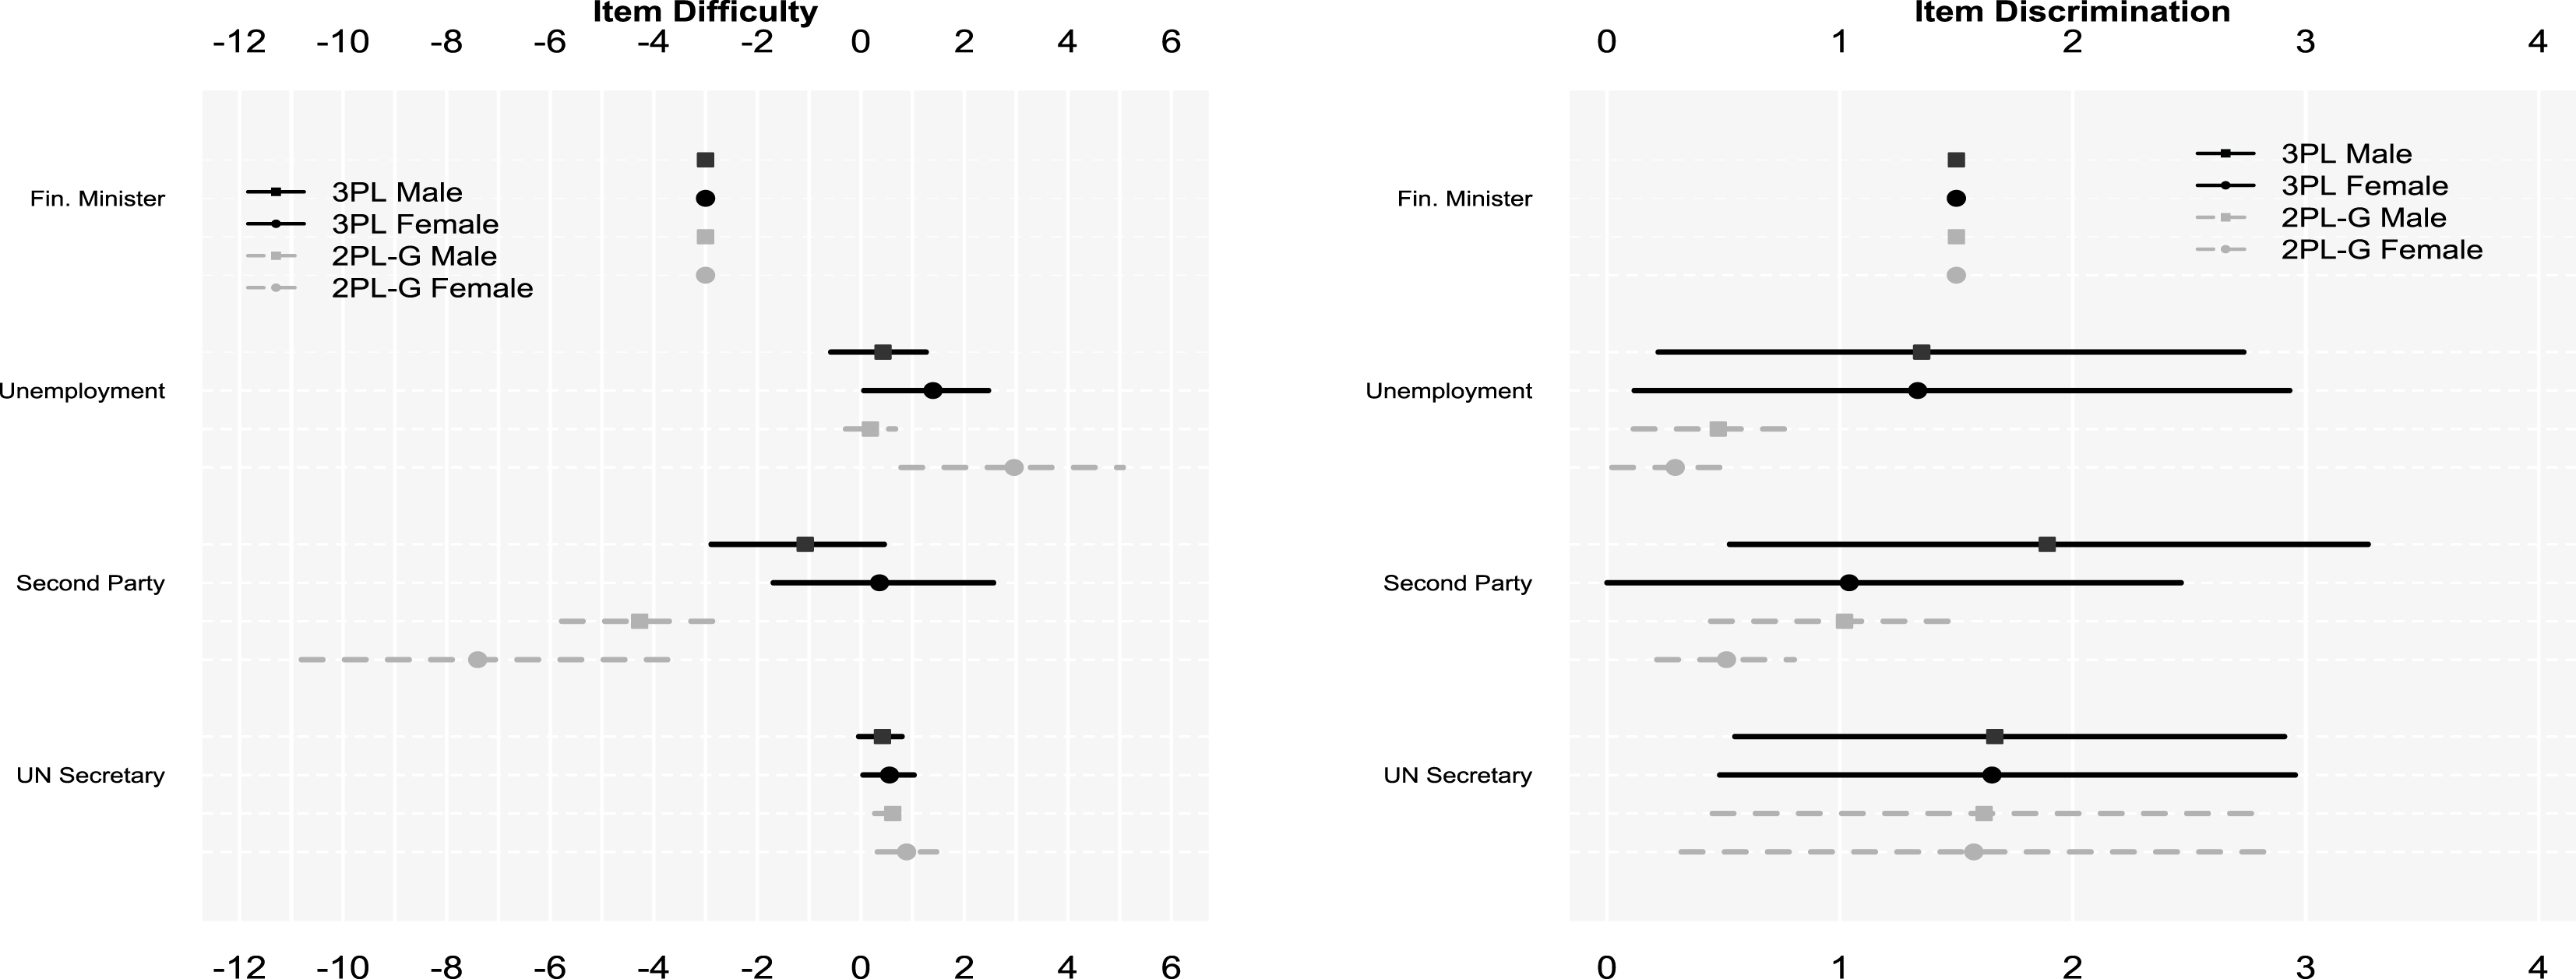
The 90% credible intervals of item parameters for the multilevel 3PL and 2PL-G models.

Next, we compare the 3PL and 2PL-G models by showing the estimates of item parameters in Figure 7. Two differences between these two models can be observed in the left panel of Figure 7. First, the 3PL model provides similar estimates of Unemployment for men and women, but the 2PL-G model provides different item-difficulty estimates between men and women. Second, in terms of the means, the 3PL model shows that Second Legislative Party is easier for men than for women while the 2PL-G model shows the opposite although they are not different with the credible intervals overlapped.
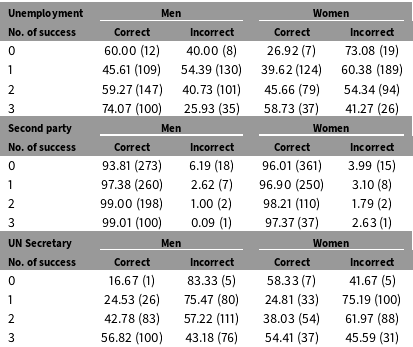
To see which model fits the data better, we present in Table 5 the distributions of correct and incorrect responses to the three unconstrained multiple-choice items against the number of item success for both men and women.Footnote
20
It is obvious that, for Unemployment, men are more likely to answer correctly than women at any level of political knowledge. Moreover, for Second Legislative Party, women have a higher rate of correct responses than men given that the number of success is 0 (
 $96.02\%>93.81\%$
). We can see that the 2PL-G model captures these facts, which is the evidence that the 2PL-G model performs better than the 3PL model.
Distributions of responses across gender in TEDS2012.

Note: DKs are excluded.
5 Conclusion
In the discipline of political science, the levels of political knowledge are measured by different item formats, including multiple-choice questions and open-ended identification items. The former are very likely to induce guessing behavior, which is associated with personal tendency to guess and blind guessing, and the latter usually lead to high proportions of DK responses, both of which affect estimates of political knowledge. Some research claims that multiple-choice items with the absence of the DK options effectively exclude respondents’ guessing propensity and motivate partially informed guessing (Mondak Reference Mondak1999, Reference Mondak2001; Miller and Orr Reference Miller and Orr2008; Luskin and Bullock Reference Luskin and Bullock2011). Because it is impossible to eliminate all guessing (Mondak and Davis Reference Mondak and Davis2001), what is important is to clarify the association between guessing behavior and knowledge levels. There have been, however, very few studies conducted to investigate informed guessing in the measurement of political knowledge.
In this article, we examine guessing behavior by focusing on multiple-choice items with the DK-neutral condition and argue that informed guessing is more common than blind guessing. To deal with the issue of informed guessing, we propose a two-parameter logistic guessing model to accommodate the guessing components of successful responses based on respondents’ levels of political knowledge and item difficulties. In particular, partially informed respondents are more likely to have a successful guess than both barely informed and well-informed ones. This is because barely informed respondents are highly seducible by the attractive distractors while well-informed ones have enough knowledge to correctly answer questions.
The proposed 2PL-G model is applied to analyzing survey data conducted in 2012 in Taiwan. The results show that the proposed model appropriately describes the characteristics of the political knowledge items, that is, a successful guess requires certain levels of knowledge depending on the difficulties of items. This article contributes to our understanding of guessing behavior in multiple-choice items. The evidence shows that informed (and/or misinformed) guessing is actually more common than blind guessing. We also examine the gender gap in political knowledge and the findings imply that men are more likely to guess than women because men are in general more knowledgeable than women. While the focus of this article is on the measurement of political knowledge, the proposed model can be applied to multiple-choice items for measuring other types of knowledge in surveys.
The results of the empirical analysis show that some problems appearing in the 2PL and 3PL models are fixed by the 2PL-G model. First, the 2PL model underestimates item-difficulty parameters due to the ignorance of the guessing effect, which leads to the overestimation of knowledge levels. Second, although the 3PL model accounts for the guessing effect, it overestimates the item-difficulty parameters of easy items while underestimating the item-difficulty parameters of hard items due to the implausible assumption of the probability of a successful guess through parameter
 $c$
. Because the overestimated item-difficulty parameters of easy items and underestimated item-difficulty parameters of hard items influence the estimates of knowledge levels in different directions, the overall effects are uncertain. Therefore, we observe that the 2PL-G model is better than the 2PL model but is indifferent from the 3PL model in the analysis without considering DIF. The better performance of the 2PL-G model than the 3PL model can be observed in the analysis which takes DIF into consideration.
Supplementary Materials
For supplementary materials accompanying this paper, please visit https://doi.org/10.1017/pan.2017.21.