


Introduction
The thermodynamic state of a glacier is subject to both seasonal and long-term climatic changes. Temperature distribution in a glacier depends on air temperature, accumulation, solar radiation, clouds, surface albedo, wind, meltwater runoff, percolation and refreezing of meltwater, ice flow and other parameters. On any given glacier, many of these parameters are known with uncertainties. On the other hand, ice cores do not provide the information that would allow us to obtain parameters related to the majority of these surface conditions. Isotopic, ionic and microparticle composition of ice cores represent past atmosphere conditions, while visual stratigraphy (melt features) and borehole temperature are related to the surface net energy balance. Solving the inverse problem (Reference MacAyeal, Firestone and WaddingtonMacAyeal and others, 1991; Reference Dahl-Jensen, Morgan and ElcheikhDahl-Jensen and others, 1999) has been used in order to reconstruct air temperatures at the glacier surface in the past from deep borehole measurements.
The amplitude of the surface temperature oscillations decreases as  where x is the vertical coordinate, k is the thermal conductivity of ice and
u
is the frequency of oscillations at the surface. The penetration depth of seasonal temperature variations, -hal, is determined by the period of variations and the properties of the glacier: density, heat capacity and thermal conductivity (Reference PatersonPaterson, 1994). Therefore, daily temperature variations are 20 times smaller at approximately 0.6m depth, and the yearly thermal wave penetrates down to 15−20m, while thermal disturbance can reach 150 m depth within approximately 160 years (corrected for ice advection). Because most mountain glaciers experience surface melting, their temperature is close to the melting point, and a small fall or rise in air temperature could have a significant impact on the heat- and mass balance at the surface and consequently in the whole glacier within a relatively short period of time.
A theoretical approach to finding temperature in a glacier requires a vast set of data that represent heat transfer at the glacier boundaries. In reality, it is difficult to obtain all the necessary data with the required precision. Furthermore, surface conditions on a glacier vary, causing spatial variations of T 10. For this reason, the few attempts to find a relationship between T a and T 10 at a specific glacier have provided inconclusive results. The most detailed and enduring study of the glacier–climate interaction was performed on White Glacier, Northwest Territories, Canada (Reference MüllerMüller, 1976; Reference BlatterBlatter, 1987). The ‘anomalous’ behavior of the high-Arctic valley White Glacier was reported by Reference MüllerMüller (1976). On White Glacier, migration of meltwater causes significant changes in surface conditions that complicate temperature transfer function (TTF) determination. The most dramatic changes take place at the equilibrium line.
The first investigation of TTF in accumulation areas of Greenland and Antarctica was conducted by Reference LoeweLoewe (1970). In this research, only air temperature and 10 m borehole data were analyzed. Then Reference Hooke, Gould and BrzozowskiHooke and others (1983) investigated TTF near and below the equilibrium line in the ablation zones of two high-latitude glaciers. They determined the effect of snow cover on ice cooling. In our study, a majority of new datasets do not include mass balance and other meteorological observations and therefore do not permit detailed theoretical investigations. However, our approach demonstrates a good match between T 10 calculated from air temperatures only and T 10 measured in a borehole.
Knowledge of the TTF could improve interpretation of the ice-core records, provide estimates of glacier temperature based on weather station data and assist in the prediction of a glacier’s response to climate change. Our goal is to investigate TTF in accumulation areas of a relatively large number of glaciers in different regions and find a general relationship between T a and T 10. Such an approach is limited by some uncertainty of TTF for glaciers subjected to intense melting and water migration. At the same time, it permits the elimination of local factors (clouds, surrounding topography, meltwater horizontal runoff, etc.) and provides general characteristics of climate–glacier interaction with reasonable accuracy. A general TTF can reveal anomalies in T 10. The latter is important for study of spatial T 10 temperature changes induced by climatic variations on ice sheets, meltwater migrations, and aiding in the selection of new ice-core drilling sites. This paper presents results of experimental and theoretical investigations of the TTF on polar and mountain glaciers, including high-elevation ice caps. A significant portion of cited T 10 data was acquired in 8–10 m deep boreholes and therefore may include an additional uncertainty. The paper describes a procedure for deriving the annual mean T s (surface temperature), T 10 and h al (thickness of the active layer or zero annual amplitude depth) based on data from a deep borehole, monthly air temperatures and the physical properties of snow–firn sequences.
The Data
We analyze original data from the accumulation areas at ten sites: five low-latitude and tropical glaciers and five polar sites. In addition, we compiled data from 13 sites new for calculation of the TTF. The majority of data were obtained over the last two decades on glaciers from different climate regimes and from 16 sites where data were collected by Reference LoeweLoewe (1970). In order to obtain a general understanding of the glacier–climate interaction and to cover a broad range of T a under different glacial conditions, we use data collected in the vicinity of boreholes where T 10 was measured during one or more years.
New Greenland data were obtained in 1998–2000 (Reference Zagorodnov, Thompson and Mosley-ThompsonZagorodnov and others, 2000). T a was measured by the automatic weather station (AWS) near the borehole only for the Dye 2 site. For the other sites (D1, D2 and D3), T a was interpolated using observations from 19 AWSs (Reference Steffen and BoxSteffen and Box, 2001). Arctic glacier data were obtained from Novaya Zemlya (Reference ChizhovChizhov and others, 1968), Franz Jozef Land (Reference GrosswaldGrosswald and others, 1973), Severnaya Zemlya (personal communication from S.M. Arkhipov, 2005) and White Glacier (Reference MüllerMüller, 1976; Reference BlatterBlatter, 1987). Spatial and temporal changes in T 10 were studied on Austfonna ice cap on Nordaustlandet (Reference Zagorodnov, Sin’kevich and ArkhipovZagorodnov and others, 1990) and on White Glacier (Reference MüllerMüller, 1976; Reference BlatterBlatter, 1987). Spatial variations of T 10 in the accumulation zone of Austfonna ice cap were investigated in 26 shallow and deep boreholes drilled in 1985 and 1987 (Reference Zagorodnov, Sin’kevich and ArkhipovZagorodnov and others, 1990).
Reference Maohuan, Zhongxiang and JiawenMaohuan and others (1982) presented high-altitude glacier data on Altai, Qilian Shan and Himalayan glaciers, obtained in 1964–78. V. Aizen (personal communication, 2005) provided us with the Inylcheck glacier (Tien Shan) data obtained in 2000. Nevado Sajama (Bolivia) 1997, Kilimanjaro (Tanzania) 2000 and Quelccaya (Peru) 2003 borehole temperatures were measured during Byrd Polar Research Center ice-coring expeditions. Air-temperature measurements with AWS at the last three sites were carried out by D. Hardy (personal communication, 2005). All measured T a and T 10 temperatures are presented in Table 1.
Mean annual air-temperature ( T a) and borehole temperature (T 10) data

The majority of T a and T 10 data were obtained from the accumulation areas of polar and high-altitude ice sheets and ice caps, where the influence of surrounding mountains and ice dynamics is very small compared to valley glaciers. Only a few sites provided multi-year T a observations. Because some non-universal instrumental protocols were used to collect meteorological and borehole temperatures, our data are of low precision.
The Model
In order to determine T 10, the heat- and mass-transfer problem has to be solved in the snow–firn sequence. The solution is possible when the following boundary conditions are known: the annual air-temperature (T a) record, radiation balance at the snow surface and turbulent fluxes of latent and sensible heat. These conditions determine the conductive heat flux that governs the temperature difference between the surface (T s) and the bottom of the active layer (T al). The typical magnitudes of the mean annual conductive heat flux do not exceed 1 Wm– 2. This value is comparable with the precision of other energy-flux measurements. Thus, determining the temperature in the active layer based on atmospheric heat fluxes is problematic. At the same time, solution of the inverse problem permits the determination of T 10 based on deep-borehole temperature data.
Since the boundary conditions are unknown, we use the measured temperature-depth profile to solve the heat conduction equation and to find the surface temperature (Reference Nagornov, Konovalov, Zagorodnov and ThompsonNagornov and others, 2001, Reference Nagornov, Konovalov and Tchijov2005; Reference Kotlyakov, Arkhipov, Henderson and Nagor-novKotlyakov and others, 2004). This is the so-called inverse problem (Reference MacAyeal, Firestone and WaddingtonMacAyeal and others, 1991; Reference Dahl-Jensen, Morgan and ElcheikhDahl-Jensen and others, 1999). Moreover, we employ the Tikhonov regularization method that minimizes the discrepancy function between measured and calculated temperature in a glacier (Reference Nagornov, Konovalov, Zagorodnov and ThompsonNagornov and others, 2001).
An alternative calculation of T 10 can be made using the following procedure. A mathematical statement of the problem involves a one-dimensional heat conduction equation determined for the vertical coordinate z e (0; H) at time t (0;tf), as well as initial and boundary conditions. Here H is the depth of the borehole and tf is the terminal time which corresponds to the borehole temperature measurements. It is common to use the one-dimensional approach in forward problems (Reference Hooke, Gould and BrzozowskiHooke and others, 1983; Reference Haeberli and FunkHaeberli and Funk, 1991; Reference Suter, Laternser, Haeberli, Frauenfelder and HoelzleSuter and others, 2001) to obtain near-surface temperatures on glaciers. As a rule, the contribution of horizontal advection is small due to insignificant horizontal temperature gradients (Reference Haeberli and FunkHaeberli and Funk, 1991). We apply a statement of the forward problem similar to that used by Reference MacAyeal, Firestone and WaddingtonMacAyeal and others (1991). The equations are:
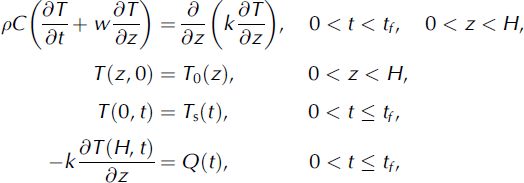
where p is the density, C is heat capacity, k is the thermal conductivity, Q(t) is the heat flux, T0(z) is initial temperature associated with the temperature in the past and w is the vertical velocity of ice. The coordinate z = 0 corresponds to the temperature T s(t). The seasonal surface temperature variations can penetrate only to the specific depth at which temperature is denoted as T a l (Reference BlatterBlatter, 1987).
The borehole temperature-depth profile θ{z) = T(z, tf) is assumed to be a response to the long-term surface temperature changes Ts(t). The solution to this problem at the terminal time can be rewritten as the operator relationship θ(z) = A{Ts}. A quasi-solution T s(t) is a function that minimizes the relation
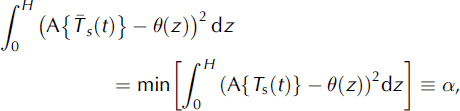
where the minimum is chosen from continuous function Ts(t). To obtain a stable solution, the Tikhonov method assumes an additional stabilizing term

where β > 0 is the regularization parameter which must be chosen according to the accuracy of the input data. The additional function

is related to the smoothness of the quasi-solution (/32 > 0). It has been proved that the procedure of minimization of Ψ is stable with respect to small perturbations of the input data, whereas the minimization of the functional relation (2) does not possess the same property. Therefore, fl plays the role of a stabilizer.
The procedure for searching for the minimum of Ψ is based on the iterative gradient method. At the beginning, the zero iteration is defined  where t
1,t
2, …, tk are nodes. The nth iteration is determined as
 where n=1 is the gradient step.
We used data from four glacier locations, Kilimanjaro, Nevado Sajama, Vavilov ice cap in Severnaya Zemlya, and South Pole, to find Ts (z = 0). Having Ts and the temperature profile for each glacier, we solve the forward problem, taking into account the calculated temperature profile and seasonal variations of air temperature at the surface. Table 2 shows calculated and observed values of hal, T s , Tal, Ta and T 10.
Calculated and observed thermodynamic parameters of the active layer

Calculated temperature at the bottom of the active layer, Tal, and temperature measured in boreholes, T10, are very close. Derived hal depth values are noticeably different from the 10m depth often used as a lower boundary of the active layer. Nevertheless, a significant difference between Tal and T10 is not found. In glaciers with intense summer melting (e.g. Kilimanjaro and Vavilov ice cap), the annual air temperature is relatively low, –17 to –7˚C, while T10 is higher than Ta. For the two glaciers where melting is absent or insignificant (Nevado Sajama and South Pole), the calculated and observed temperatures Tal and T10 differ by 0.5˚C or less.
Discussion
Observed temperatures Ta and T10 are shown in Figure 1a, where the thin dashed line represents T10 = Ta; the solid line represents linear regression of observed data T10 = 1.2Ta + 6.7, and the thick dashed line represents modeled data (Table 1) that fit the equation Tal = 1.1Ta + 5.4. Considering the small number of calculated temperatures Tal used to obtain this equation, the difference between the empirical and calculated equations is less than the precision of the data. Figure 1b shows the difference between Ta and T10. Because Ta and T10 are independently measured variables, the inverse approximation equation can be written as Ta = 0.8T10 –5.8. The data presented in Figure 1a and b demonstrate a relatively large deviation of experimental values. There are several reasons that explain the differences between T10 and Ta:
-
1. Instrumental error in most of the measurements, not exceeding 0.1–0.5˚C;
-
2. Metrology, i.e. insufficient time for borehole or thermometer equilibration and air circulation in the borehole could cause a 0.1–1.0˚C difference between real and measured temperatures; insufficient depth for T10 measurements results in an uncertainty of up to 0.5˚C;
-
3. Riming and snow precipitation could restrict air aspiration of the AWS temperature sensors;
-
4. Changing height of thermometers in AWS due to accumulation/ablation;
-
5. Meltwater migration; and
-
6. Cloudiness.
(σ) Measured (crosses; Table 1), modeled (thick dashed line) and approximated (solid line) temperatures T 10 vs T a; thin dashed line is T a = T 10. (b) Temperature differences between T a and T 10.

Most of these sources of uncertainty are applicable to all sites. Melting and meltwater migration occur on many alpine and Arctic glaciers. In Figure 1a and b the biggest data deviation can be attributed to glaciers with intense summer melt: White Glacier; Austfonna (two sites); Jackson Ice Cap, Franz Jozef Land; and summits of Novaya Zemlya ice cap and Vavilov ice cap. The most uncertain relationship between Ta and T10 is observed on White Glacier, where at the equilibrium line T10 varies between −17˚C and −12˚C during 1961−64 (Reference MüllerMuller, 1976) and from −19˚C to −13˚C in 1974−81 (Reference BlatterBlatter, 1987). Along with instrumental errors in borehole temperatures up to 0.5˚C, variable local conditions along transects cause up to 5−6˚C uncertainty in T10. Reference MüllerMuller (1976) used only multi-year averaged Ta. Annually averaged data could be used to improve the T10–Ta relationship. White Glacier is a valley glacier, and as such the temperature regime is influenced by topography, mainly due to horizontal meltwater migration. Many researchers attribute spatial and temporal T10 changes to the migration of accumulation zones over the glacier slope with the average elevation angle of 1 :11 (Reference MüllerMuller, 1976).
Less variable conditions were found on the Austfonna ice cap (Reference Zagorodnov, Sin’kevich and ArkhipovZagorodnov and others, 1990) within 2 km of the summit. Spatial variations of the active-layer temperature were studied here in the visually flat (100 x 60 m; average elevation angle 1:240) accumulation area. In 1985 and 1987 a total of 26 shallow and deep boreholes were drilled, 15 of them in the summit area. In 1985, 2 weeks before the melt season water-saturated firn was recovered from one borehole at 7 m depth. During the following melt season, meltwater was found in two other boreholes. Four weeks of observations suggested the presence of meltwater in a subsurface reservoir at the depth of the firn–ice transition. Sub-horizontal channels up to 20cm2 were discovered in ice cores at 7, 15 and 30 m depth. Only meltwater can form channels in the firn. In 1987 a network of eight boreholes was drilled in the same area. Figure 2 shows the temperature distribution in those boreholes. Two important findings as illustrated in Figure 2 are: (1) in five boreholes, T 10 varied between –1.8˚C and –5.0˚C, and (2) melting-point temperatures and water-saturated firn were detected in three of the boreholes. These observations suggest that meltwater was concentrated in a subsurface reservoir above the ice–firn transition and caused a 3.2˚C rise in T 10.
Borehole temperatures in Austfonna summit area.

Melting in this area was estimated to be 200 mmw.e. (Reference Zagorodnov, Sin’kevich and ArkhipovZagorodnov and others, 1990). Most of this water was frozen in firn pores, and the rest was concentrated, presumably below the surface, down the slope of elongated valleys. Therefore, T 10 = 0˚C was measured in the center of the subsurface valley, while T 10 was between –5˚C and –3˚C on its sides and on the ice-cap summit. Accumulation areas of Novaya Zemlya, Severnaya Zemlya and Franz Josef Land ice caps (Reference ChizhovChizhov and others, 1968; Reference GrosswaldGrosswald and others, 1973) are among other sites with high T 10 values, shown in Figure 1a and b. Intensity of melting on all of the above sites is in the range 160–800mma−1 and correlates well with the summer mean air temperatures (June–August) (T s) (Reference Krenke and KhodakovKrenke and Khodakov, 1966). In general, T 10 temperatures on those Arctic glaciers are higher than air temperatures T a by 5–10˚C. Reference OhmuraOhmura (2001) suggests that longwave atmospheric radiation and sensible heat flux are the most dominant (75%) heat sources responsible for melting.
Contrary to conditions on the Arctic ice caps, T 10 temperatures in the accumulation zones of the majority of alpine glaciers are only 5˚C higher than T a. Possibly, lateral runoff of meltwater removes the energy absorbed there. However, there are not enough data to prove this statement quantitatively. In low-latitude and tropical glaciers, where seasonal variations of air temperature T a are small (Fig. 3) (Nevado Sajama and Nevado Coropuna), T 10 = T a. Figure 3 shows monthly average air temperatures T a and ice temperatures T 10 in polar, tropical and high-altitude glaciers. These data show that when the mean summer air temperatures are above –10˚C, T 10 > T a. Visual stratigraphy of Nevado Sajama and Nevado Coropuna ice cores shows few ice layers (melt features) that can be attributed to surface melting. Borehole temperatures in Nevado Coropuna boreholes (Fig. 4) are higher than those from Nevado Sajama. The concentration of ice layers in Nevado Coropuna ice cores is higher than in Nevado Sajama cores. In the Nevado Sajama ice cores, the intensity of melting varied from 0 (the year of borehole temperature measurements) to an average of 36 mmw.e. and as much as 180 mmw.e. during the last 70 years. According to AWS measurements in 1997, the average air temperature during June–August, T 6–8, on Nevado Sajama was –7.1˚C. Using massive Arctic field data, Reference Krenke and KhodakovKrenke and Khodakov (1966) developed an empirical equation to calculate intensity of melting: W = (T 6–8 + 10)3. Using AWS data calculations with Nevado Sajama, T 6–8 data show that the intensity of melting in 1997 is close to 24 mm w.e. Our stratigraphic studies show that the concentration of melt layers in ice is close to the intensity of summer melting (Reference Zagorodnov and KotlyakovZagorodnov, 1985). Lack of signs of melting in the Nevado Sajama 1997 ice core at relatively high summer temperatures suggests that on high-altitude glaciers sublimation is the dominant mechanism of mass loss. Thus, on high-altitude glaciers the intensive sublimation may prevent ice layer formation at Ts≈−7.1˚C. However, the presence of thick ice layers (up to 70 mm, 5 mm average) in the upper 64m (70years) in the Nevado Sajama ice core indicates warmer conditions with relatively intensive melting in the past. These observations suggest that in tropical and low-latitude glaciers, surface ablation/ melting occurs at T a≥−10˚C.
Monthly and annual mean (solid line) air and borehole T 10 (dashed line) temperatures at (σ) Kilimanjaro (2001–05); (b) Nevado Sajama (1997–98); (c) Novaya Zemlya (1958–59); (d) Greenland (Summit, 1996–2003); (e) Severnaya Zemlya (1978–88); and (f) South Pole (2002).

Nevado Coropuna and Nevado Sajama borehole temperatures.

Ablation on Kilimanjaro may not be dominated by air temperature (Reference Mölg and HardyMolg and Hardy, 2004) but rather governed by surface albedo. The key difference between Nevado Sajama and Kilimanjaro glaciers is mass balance. The latter has been losing mass over the last few decades, which has exposed the ice surface between snowfalls, while the former is permanently covered with snow. Consequently, the surface albedo on Kilimanjaro varies between 0.45 (bare ice) and 0.9 (fresh snow) (Reference Mölg and HardyMolg and Hardy, 2004), while on Nevado Sajama it is close to 0.85 (fresh and old snow) year-round. Increased precipitation or an air-temperature drop of 3˚C may drastically increase accumulation and, consequently, the surface albedo on Kilimanjaro and lower the T 10 temperature. On Kilimanjaro, T 10 and Ta values match the general TTF. With permanent snow cover on the northern ice field of Kilimanjaro, we would expect that the polar type of TTF (T 10 = Ta), similar to Nevado Sajama, would be a better match.
Conclusions
The general relationship between annual mean air temperature ( T a) and the ice temperature at the bottom of the active layer (T 10) is T 10 = 1.2T a + 6.7 (inverse notation: Ta = 0.8T 10 −5.8); Ta ranges from −60˚C to −7˚C. At air temperatures between −55˚C and −20˚C, the TTF is T 10 = Ta (scatter interval ±2˚C). Thus, in high-latitude glaciers, sensible surface melting occurs when Ta is above −17˚C and results in a T 10 rise of up to 5−16˚C above Ta. Migration and concentration of meltwater in subsurface reservoirs leads to an additional rise in ice temperatures of 3˚C. In high latitudes, temperate glaciers can exist at mean annual air temperature Ta above −15˚C. On tropical and low-latitude glaciers a noticeable surface melting occurs at T a>−10˚C, below which the TTF is T 10 = T a. Melting on tropical and low-latitude glaciers can cause a 5˚C increase in ice temperature (T 10) above T a. Thus, in the tropics and low latitudes, temperate glaciers can exist at T a above –7˚C.
Acknowledgements
D. Hardy provided us with unique data from high-altitude glaciers. His work encouraged us to investigate modern climate and glacier interaction more deeply. P. Ginot, P. Wagnon, V. Aizen and J. Box contributed valuable data. This is Byrd Polar Research Center contribution No. 1323.



