Introduction
Smectite‑group minerals are layered aluminosilicates, the structure of which is a single octahedral sheet enclosed between two tetrahedral sheets; various cations and water molecules occupy the interlayer space. Due to this structural arrangement, they exhibit multiple forms of structural and chemical heterogeneity (Wolters and Emmerich, Reference Wolters and Emmerich2007; Krupskaya et al., Reference Krupskaya, Zakusin, Zakusina, Belousov, Pokidko, Morozov, Zaitseva, Tyupina and Koroleva2025). According to Bergaya and Lagaly (Reference Bergaya and Lagaly2013), smectite‑group minerals feature two types of octahedral sheets, distinguished by the positioning of OH groups in the structure: cis‑vacant and trans‑vacant. In a trans‑vacant octahedral sheet, two hydroxyl groups are located at opposite corners. The cis- configuration is defined by two hydroxyl groups situated on the same edge of the octahedron. Identification of these smectite structural variants is performed using thermal analysis. cis-vacant smectites are characterized by higher dehydroxylation temperatures; the boundary between cis- and trans-smectites is considered to be 600°C (Derkowski and Kuligiewicz, Reference Derkowski and Kuligiewicz2022).
The significance of studying the structure of smectite octahedral sheets lies in their differing stabilities under thermochemical treatment. According to Krupskaya et al. (Reference Krupskaya, Zakusin, Tyupina, Dorzhieva, Zhukhlistov, Belousov and Timofeeva2017, Reference Krupskaya, Zakusin, Tyupina, Dorzhieva, Chernov and Bychkova2019, Reference Krupskaya, Zakusin, Zakusina, Belousov, Pokidko, Morozov, Zaitseva, Tyupina and Koroleva2025) and Morozov et al. (Reference Morozov, Krupskaya, Koroleva, Pokidko and Zakusin2025) bentonites dominated by trans‑vacant smectite exhibit lower resistance to various external influences compared with those with cis‑vacant smectite. Consequently, bentonites containing trans‑vacant smectite have limited applicability in material production, e.g. in the manufacture of iron ore pellets (Belousov, Reference Belousov2013).
Although a large number of studies on the synthesis of smectite‑group minerals has been reported in the literature, the formation of cis-trans-vacant smectites remains controversial. In a study on the synthesis of beidellite (Lantenois et al., Reference Lantenois, Muller, Bény, Mahiaoui and Champallier2008), predominantly trans-vacant smectite varieties were noted to form when the synthesis temperature and pressure were reduced (280°C), while increases in T and P led to the formation of cis-vacant varieties.
The aim of the present study was to explore the factors influencing the formation of cis- and trans-vacant structures in montmorillonite using hydrothermal synthesis. The study of synthesized smectites is relevant in the quest to obtain materials with desirable properties.
Materials and methods
Smectite was synthesized using hydrothermal synthesis in metal autoclaves with fluoroplastic liners (150 and 250°С) and in titanium autoclaves (350°С). Three different silica precursors were used: tetraethoxysilane (TEOS), a commercial silica sol Nanosil‑40M (Silicon LLC, Ekaterinburg, Russia), and an aminosilicate (AS) solution, obtained by dissolving amorphous silicon dioxide (LLC Himbaza, Moscow, Russia; 83% SiO₂) in an aqueous methylamine solution (Koroleva et al., Reference Koroleva, Pokidko, Morozov, Nesterenko, Kortunkova, Chernov, Ksenofontov and Krupskaya2025). The sources of aluminum and magnesium were aluminum nitrate nonahydrate Al(NO3)3·9H2O (JSC Khimreaktivsnab, Ufa, Russia) and magnesium acetate, respectively. The components were calculated to synthesize montmorillonite with the following formula: Na0.33Al1.67Mg0.33Si4O10(OH)2H2O and beidellite: Na0.33Al2Si3.67Al0.33O10(OH)2H2O.
An amorphous magnesium alumosilicate gel was obtained by polycondensation of a precursor solution in an alkaline medium (addition of an ammonia solution to neutral pH) (Kloprogge et al., Reference Kloprogge, Komarneni and Amonette1999; Koroleva et al., Reference Koroleva, Pokidko, Morozov, Nesterenko, Kortunkova, Chernov, Ksenofontov and Krupskaya2025). The resulting gel was dried and calcined at 550°C to remove organic matter and ammonium nitrate and then placed in an autoclave and heated in a muffle furnace at temperatures of 150, 250, and 350°С, under varying pressures (controlled by the autoclave liquid fill factor) of 30, 100, 240, 1000, and 2340 bar. The synthesis was carried out for periods of 2, 5, 10, and 20 days. A period of 30 days was used for synthesis at 150°C.
Mineral composition analysis was performed using X‑ray diffraction (XRD) with a DX Haoyan diffractometer (Dandong, China), equipped with a Cu anode (40 kV, 30 A). The measurement parameters were as follows: scanning range: 3–65°2θ, step size = 0.02°2θ, and counting time = 5 s. Phase identification was carried out using the Jade 6.5 software (MDI) from the International Center for Diffraction Data. Reference mixtures of charge material and smectite were prepared to estimate the amorphous phase content (Fig. 1). The diffraction profiles were processed using the Le Bail method (Le Bail et al., 1988) and this approach was applied subsequently in quantitative mineralogical analysis via the Rietveld method (Post and Bish, Reference Post and Bish1989) using the Profex software (version 5.2.8, https://www.profex-xrd.org/) (Doebelin and Kleeberg, Reference Doebelin and Kleeberg2015).
Comparison of the calculation of artificial mixtures based on almost pure smectite (smectite and quartz) and the starting material for synthesis (the charge). Mixtures of 70/30, 50/50, and 30/70 – smectite/charge material.

Figure 1. Long description
A stacked bar chart with the y-axis labeled Mineral composition, wt. % ranging from 0 to 100 in increments of 10. The x-axis is labeled Mixtures. A legend at the bottom left identifies three components: Smectite (blue), Charge (gray), and Quartz (teal).
From left to right, the bars represent:
* 100% Sme: Almost entirely blue (Smectite) with a thin teal sliver (Quartz) at the top.
* 70% Sme - real: Blue reaches approximately 67, gray (Charge) reaches 97, and teal fills the remainder to 100.
* 70% Sme - calc: Blue reaches 70, gray reaches 97, and teal fills the remainder to 100.
* 50% Sme - real: Blue reaches 48, gray reaches 98, and teal fills the remainder to 100.
* 50% Sme - calc: Blue reaches 50, gray reaches 99, and teal fills the remainder to 100.
* 30% Sme - real: Blue reaches 29, gray reaches 99, and teal fills the remainder to 100.
* 30% Sme - calc: Blue reaches 32, gray reaches 99, and teal fills the remainder to 100.
* 0% Sme: Entirely gray (Charge).
Infrared (IR) spectra were acquired using a Perkin Elmer Spectrum One FTIR spectrometer (Perkin Elmer Inc., Waltham, MA, USA) equipped with an InGaAs detector. Measurements were performed in the mid‑infrared range of 4000–400 cm–1. For analysis, KBr pellets were prepared by compressing a mixture of 0.5 mg of sample and 200 mg of KBr. After the initial measurement, the pellets were heated at 120°С for 24 h and subsequently re‑measured.
The cation exchange capacity (CEC) was determined via adsorption of the copper–triethylenetetramine complex (Cu‑trien) (Lorenz et al., Reference Lorenz, Meier and Kahr1999; Dohrmann et al., Reference Dohrmann, Genske, Karnland, Kaufhold, Kiviranta, Olsson, Plötze, Sandén, Sellin, Svensson and Valter2012).
Thermal analysis was performed using a TGA/DSC 3+ synchronous thermal analyzer (Mettler Toledo, Greifensee, Switzerland), equipped with an o‑DTA sensor that does not require a reference sample. The ratio of cis‑ to trans‑vacant smectite was calculated according to the method described by Drits et al. (1998).
Scanning electron microscopy (SEM) images were acquired using a JSM‑IT500 instrument (JEOL, Japan) in secondary electron mode. The analysis was performed at an accelerating voltage of 20 kV, a working distance of 10 mm, and under high-vacuum (HV) conditions. The samples were sputter‑coated with gold prior to imaging.
The proportion of tetrahedral charge was evaluated by an adsorption method. According to the proposed methodology, the proportion of layers was estimated as the ratio of the CEC of the Li-form to the CEC of the Na⁺-form of the fractions, evaluated after heating both fractions at 250°C for 14 h.
The JEOL JEM-2100F transmission electron microscope (TEM, in Tokyo, Japan) was employed to observe the structure of synthesized smectite.
Results and Discussion
The influence of silica sources
According to the positions of the reflections in the XRD patterns (Fig. 2), as well as the position of the reflection d 060 at 1.498 Å, as a result of synthesis using various silica precursors, analogues of dioctahedral smectites (d = 12.5–13.1, 6.25, 4.50, 3.15, 2.57, 1.70, 1.498 Å) were obtained.
XRD patterns (left) and IR spectra (right) of the smectite samples synthesized.

Figure 2. Long description
The figure contains two panels.
Left panel: An X R D diffractogram. The x-axis is labeled C u K alpha (degrees 2 theta) ranging from 0 to 70. The y-axis represents intensity. Three stacked patterns are shown. From bottom to top, they are labeled Nanosil (black), T E O S (blue), and A S (red). All three show a prominent basal peak at 13.1 angstroms. Other labeled peaks include 7.2, 6.25, 4.50, 3.56, 3.15, 2.57, 1.70, and 1.498 angstroms. The peaks are broad, indicating small crystallite size.
Right panel: An I R spectrum. The x-axis is labeled Wavenumber (cm super minus 1) and is split into two regions: 3800 to 3000 and 1800 to 400. The y-axis represents absorbance. The same three samples are stacked vertically. In the high-frequency region, peaks are noted at 3633 and 3448. In the lower-frequency region, a small peak appears at 1641. The main silicate band shows a peak at 1042 for A S and T E O S, while Nanosil peaks at 1051. Additional labeled features include 1164 asterisk, 921, 885 asterisk, 845, 797, 628, 527, and 470.
During the synthesis process using TEOS and aminosilicate precursors, a 1:1 aluminosilicate phase was formed alongside smectite confirmed by the characteristic diffraction peaks at 7.2 and 3.57 Å. The 1:1 phase (kaolinite/lizardite) formation during synthesis was observed when the initial pH before synthesis was <9–9.5, according to 20 conducted experiments. For the charge based on the Nanosil precursor, the initial pH before synthesis was >9–9.5 without additional alkalinization of the solution, so no formation of 1:1 aluminosilicates was observed.
Furthermore, all samples exhibit the presence of an amorphous phase, corresponding to unreacted precursor material. This phase was identified using a number of analytical methods: XRD – manifested as a broad halo in the 18–32°2θ range; IR spectroscopy – shown by characteristic absorption bands at 1113, 799, 779 and 470 cm−1; SEM – clearly observable in the micrographs (Fig. 3).
SEM images of samples synthesized at 250°C: (a) Nanosil, 10 days; (b) AS, 10 days, smectite; (c) AS, 10 days, amorphous material.

Figure 3. Long description
The three panels are arranged horizontally from left to right.
* Panel a shows a dense network of highly folded, wavy, and interconnected thin sheets. The texture is uniform across the field of view, resembling a crumpled fabric or coral-like structure. A scale bar at the bottom left indicates 1 micrometer.
* Panel b displays a more heterogeneous surface. It features larger, flatter plate-like structures and thin, curved flakes emerging from a darker, smoother background. The density of the folded structures is lower compared to panel a. A scale bar at the bottom left indicates 1 micrometer.
* Panel c reveals a porous, sponge-like amorphous material. The structure consists of a complex web of interconnected voids and solid filaments. The top and bottom edges of the panel show smoother, less porous regions, while the central band is highly cavernous. A scale bar at the bottom left indicates 1 micrometer.
Based on the charge composition, the 7 Å phase in the samples could belong to either the kaolinite or serpentine groups. However, IR spectroscopy revealed no characteristic kaolinite bands that would indicate a kaolinite content ≥0.5% (as per the detection threshold established by Madejová and Komadel, 2005). Therefore, the 1:1 aluminosilicate phase observed in the TEOS and AS samples corresponds to lizardite. Notably, the diagnostic IR bands of lizardite are probably obscured by overlapping bands from the smectite phase also present.
Temperature influence
For samples synthesized at other temperatures, despite the similar smectite content determined by quantitative XRD analysis, differences in the CEC values were observed (the values increased with increasing temperature of synthesis). On the one hand, this difference can be attributed to the inherent challenges of quantifying the mineral composition of complex mixtures in the presence of an amorphous phase, and, on the other hand, to changes in the smectite structure. The latter assumption was supported directly by the results of adsorption measurements; according to the analysis of tetrahedral charge, samples synthesized at 250°C had either no tetrahedral substitution or only a small percentage (3%), whereas those synthesized at 350°C showed ~20% tetrahedral substitution. This led to an increase in the CEC value (Table 1).
Mineralogical compositions and CEC values of the samples synthesized

Table 1. Long description
The table details the mineralogical content in weight percent and C E C values (measured in meq 100 g super minus 1) for three precursors.
1. T E O S Precursor:
- At 250 degrees Celsius (5 days): 52% Smectite, 3% 1:1 Alumino-silicate, 45% Amorphous. C E C is 44.0; recalculated C E C is 35.6.
- At 350 degrees Celsius (5 days): 51% Smectite, 5% 1:1 Alumino-silicate, 44% Amorphous. C E C is 50.4; recalculated C E C is 42.2.
2. Nanosil Precursor:
- At 150 degrees Celsius (30 days): 24% Smectite, 76% Amorphous. C E C is 36.3; recalculated C E C is 22.1.
- At 250 degrees Celsius (2 days): 11% Smectite, 89% Amorphous. C E C is 18.5; recalculated C E C is 2.1.
- At 250 degrees Celsius (5 days): 42% Smectite, 58% Amorphous. C E C is 45.9; recalculated C E C is 35.1.
- At 250 degrees Celsius (10 days): 65% Smectite, 35% Amorphous. C E C is 63.8; recalculated C E C is 57.3.
- At 250 degrees Celsius (20 days): 70% Smectite, 30% Amorphous. C E C is 67.6; recalculated C E C is 62.0.
- At 350 degrees Celsius (5 days): 67% Smectite, 26% Amorphous, 7% Corundum. C E C is 69.7; recalculated C E C is 64.8.
3. A S Precursor:
- At 250 degrees Celsius (5 days): 41% Smectite, 1% trace 1:1 Alumino-silicate, 58% Amorphous. C E C is 35.0; recalculated C E C is 24.2.
- At 350 degrees Celsius (5 days): 46% Smectite, 2% 1:1 Alumino-silicate, 51% Amorphous, 1% Corundum. C E C is 45.3; recalculated C E C is 35.8.
Note: Tau represents the period of the experiment. Recalculated C E C values subtract the contribution of amorphous material.
τ = period of the experiment; *recalculated taking into account the subtraction of the contribution of the amorphous material in the sample to the CEC.
According to (Bokii, Reference Bokii1954), an increase in temperature favors the formation of structures with lower coordination numbers and Al is located in tetrahedral sheets (Yang et al., Reference Yang, Downs, Finger, Hazen and Prewitt1997). A similar situation was observed by Yamada et al. (Reference Yamada, Nakazawa, Yoshioka and Fujita1991), where, with an increase in the synthesis temperature, beidellite was formed instead of montmorillonite with the same charge composition.
Calculating the crystal chemical formula of the resulting smectite was complicated by the presence of the amorphous substance with a similar or virtually identical chemical composition to the smectite itself. For the sample synthesized at 250°C, the formula was calculated using TEM analysis: Na0.31Al1.70Mg0.30Si4O10(OH)2H2O (Fig. 4).
TEM image of the sample synthesized at 250°C from a Nanosil precursor, over a 10-day period.

Figure 4. Long description
The main T E M micrograph displays a cluster of semi-transparent, dark, crumpled nanosheets against a lighter, hazy background. These sheets exhibit sharp, needle-like edges and overlapping folds that create a complex, web-like morphology. A thin black circle is drawn around the upper portion of the central cluster to indicate a region of interest. In the bottom-left corner, a white scale bar is labeled 100 n m.
In the bottom-right corner, a rectangular inset shows a Selected Area Electron Diffraction S A E D pattern. This pattern features a bright central spot obscured by a beam stopper, surrounded by several concentric, diffuse rings on a dark background. A small scale bar at the bottom of the inset is labeled 2 1/n m. Two thin black lines connect the circular region of interest in the main micrograph to the corners of the S A E D inset, indicating the source of the diffraction data.
The following endoeffects were observed on the DTG curves of three samples of synthetic smectites based on three different precursors (Fig. 5a): 99°C, attributed to the loss of adsorbed water; 156°C, indicative of residual initial material (charge); 430–485°C and 645–650°C, associated with the dehydroxylation of smectite‑group minerals, trans- and cis-vacant, respectively. The presence of a 1:1 phase at 550°C was also noted for the TEOS-based sample. For all samples synthesized at 250°С, thermal effects corresponding to both trans‑vacant and cis‑vacant smectite varieties were detected (Fig. 5a).
DTG curves of the smectites: (a) synthesized from three different precursors at 250°C; and (b) of the synthesized smectites using Nanosil as the only precursor at three different temperatures.

Figure 5. Long description
Two line graphs, labeled a and b, plot the derivative thermogravimetric D T G signal against Temperature in degrees Celsius from 0 to 1000.
Panel a compares three precursors at 250 degrees Celsius for 5 days. All curves show a sharp initial peak near 99 degrees. The Nanosil curve (green) shows small inflections at 430 and 650 degrees. The T E O S curve (blue) shows a distinct sharp peak at 550 degrees and a broader one at 645 degrees. The Aminosilicate curve (brown) shows a peak at 485 degrees.
Panel b compares Nanosil at different temperatures.
- Initial Nanosil charge (black) shows a peak at 159 degrees.
- Nanosil at 150 degrees for 30 days (blue) has peaks at 84, 405, and 610 degrees.
- Nanosil at 250 degrees for 5 days (green) has peaks at 430 and 650 degrees.
- Nanosil at 350 degrees for 5 days (red) has peaks at 100, 460, and 675 degrees.
In both panels, the primary mass loss occurs below 200 degrees, with secondary dehydroxylation peaks occurring between 400 and 700 degrees.
Further synthesis was carried out at various pressures and temperatures using only the precursor Nanosil, with no formation of 1:1 aluminosilicate enabling a correct estimation of cis- and trans-vacant smectites.
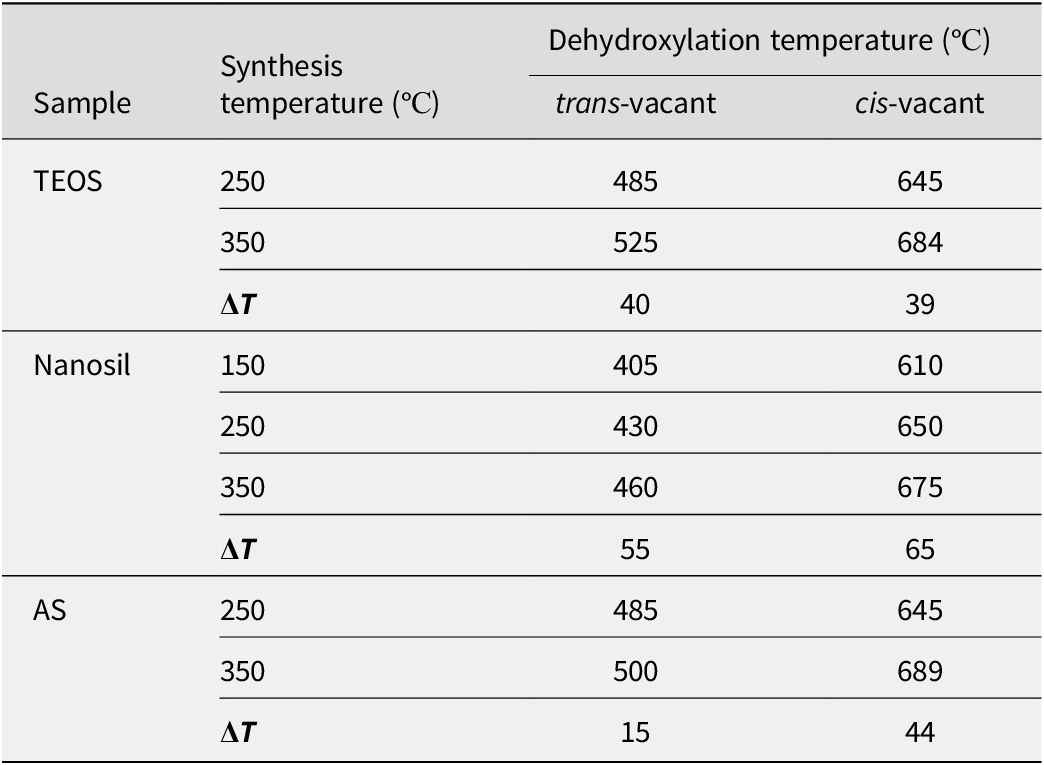
When the synthesis temperature was increased from 150 and 250 to 350°C, trans‑vacant smectite varieties were retained in the samples (Fig. 5b); in the study by Lantenois et al. (Reference Lantenois, Muller, Bény, Mahiaoui and Champallier2008), only cis‑vacant smectites (beidellites) were reported under similar conditions. With the increase in synthesis temperature, the dehydroxylation temperatures of both endothermic effects increased by 15–65°С (Table 2). An increase in the dehydroxylation temperature may be associated with a change in the particle size of the smectite synthesized.
Changes in temperature of the endothermic effects of dehydroxylation of synthesized smectites

Table 2. Long description
The table is organized into four columns: Sample, Synthesis temperature in degrees Celsius, and Dehydroxylation temperature in degrees Celsius, which is further divided into trans-vacant and cis-vacant sub-columns.
* T E O S Sample group:
- At 250 degrees Celsius synthesis: trans-vacant is 485, cis-vacant is 645.
- At 350 degrees Celsius synthesis: trans-vacant is 525, cis-vacant is 684.
- Delta T: trans-vacant is 40, cis-vacant is 39.
* Nanosil Sample group:
- At 150 degrees Celsius synthesis: trans-vacant is 405, cis-vacant is 610.
- At 250 degrees Celsius synthesis: trans-vacant is 430, cis-vacant is 650.
- At 350 degrees Celsius synthesis: trans-vacant is 460, cis-vacant is 675.
- Delta T: trans-vacant is 55, cis-vacant is 65.
* A S Sample group:
- At 250 degrees Celsius synthesis: trans-vacant is 485, cis-vacant is 645.
- At 350 degrees Celsius synthesis: trans-vacant is 500, cis-vacant is 689.
- Delta T: trans-vacant is 15, cis-vacant is 44.
Pressure influence
A notable increase in the yield of the smectite phase was observed, from 56 to 74%, with the increase in pressure. According to thermal analysis, all samples consisted of a mixture of cis‑ and trans‑vacant smectites (Fig. 6). No dependence of the smectite variety (cis‑ or trans‑vacant) on formation pressure was detected, which contrasts with the work of Lantenois et al. (Reference Lantenois, Muller, Bény, Mahiaoui and Champallier2008).
DTG curves of smectites made from a Nanosil precursor synthesized under various pressures (a) and for various durations (b).

Figure 6. Long description
Two panels, a and b, show D T G curves with Temperature in degrees Celsius on the x-axis ranging from 100 to 1000.
Panel a displays four curves for pressures of less than 100 bar, 240 bar, 1000 bar, and 2340 bar. All curves follow a similar path with three distinct troughs. The first trough is at 165 degrees. The second, shallower trough is at 415 degrees. The third trough is at 645 degrees, where the depth of the trough increases significantly as the pressure increases from less than 100 bar to 2340 bar.
Panel b displays four curves for durations of 2 days, 5 days, 10 days, and 20 days. The curves show significant evolution over time.
- The 2-day curve has a deep trough at 174 degrees and a second trough at 410 degrees, but lacks the high-temperature trough.
- The 5-day curve shows a trough at 174 degrees, a trough at 450 degrees, and the emergence of a trough at 655 degrees.
- The 10-day and 20-day curves show a decrease in the depth of the 174 and 450 degree troughs while the trough at 655 degrees becomes the most prominent feature, deepening as duration increases.
As the pressure increased, the solubility of the aluminosilicate gel increased, thereby increasing the rate of smectite synthesis. At the same time, the pressure was in the range in which smectite can be synthesized without the formation of additional phases.
Influence of synthesis duration
When the duration of the synthesis, using Nanosil silica sol as the precursor, was extended from 2 to 20 days, a change in the ratio of cis‑ and trans‑vacant smectites was observed (Fig. 7). Initially, trans‑vacant smectite formed predominantly, with a trans‑to‑cis ratio of 4:1. In subsequent days of synthesis, cis‑vacant smectite became dominant, resulting in a final trans‑to‑cis ratio of 1:9.
Analysis of dehydroxylation endothermic effects of the smectites synthesized from the Nanosil precursor to calculate the trans:cis ratio after: (a) 2 days, (b) 5 days, (c) 10 days, and (d) 20 days.

Figure 7. Long description
A multi-panel figure with four vertically stacked line graphs labeled a through d. Each graph plots intensity on the y-axis against temperature on the x-axis, ranging from approximately 300 to 750 degrees. The data is represented by a jagged black line fitted with a smooth red curve and several light gray component curves.
* Panel a, 2 days: A large broad trough is centered near 450 degrees labeled trans - 79 percent. A smaller trough near 650 degrees is labeled cis - 21 percent.
* Panel b, 5 days: The trough at 450 degrees has decreased in depth and is labeled trans - 50 percent. The trough near 650 degrees has deepened significantly and is labeled cis - 50 percent.
* Panel c, 10 days: The 450-degree trough continues to flatten, labeled trans - 25 percent. The 650-degree trough is now the dominant feature, labeled cis - 75 percent.
* Panel d, 20 days: The 450-degree trough is nearly flat, labeled trans - 13 percent. The 650-degree trough is very deep and sharp, labeled cis - 87 percent.
Arrows in each panel point from the labels to the specific component curves they represent, showing a clear shift in dominance from the lower-temperature trans peak to the higher-temperature cis peak over time.
Synthesized beidellite (Na0.33Al2Si3.67Al0.33O10(OH)2), under the same synthesis conditions as montmorillonite, can form with only a cis-vacant structure, as described by Lantenois et al. (Reference Lantenois, Muller, Bény, Mahiaoui and Champallier2008), whereas in montmorillonite, in all the syntheses performed, a trans-vacant variety was present alongside the cis-vacant smectite (Fig. 8).
DTG curves of montmorillonite and beidellite synthesized from a Nanosil precursor, temperature = 350°C.

Figure 8. Long description
The x-axis represents Temperature in degrees Celsius, ranging from 0 to 1000 in increments of 100. The y-axis represents the derivative thermogravimetric signal. Two curves are plotted: a red line for Montmorillonite at 350 degrees Celsius and a blue line for Beidellite at 350 degrees Celsius.
* Both curves show a sharp, deep initial trough centered around 100 degrees Celsius.
* Between 400 and 500 degrees Celsius, the red Montmorillonite curve exhibits a broad, shallow trough labeled with the number 460.
* Between 600 and 800 degrees Celsius, both curves show a significant trough. The blue Beidellite curve drops much deeper than the red curve, reaching its minimum at a point labeled 690.
* Beyond 800 degrees Celsius, both lines stabilize and converge near the top of the graph.
These results are supported by calculations by Marchel and Stanjek (Reference Marchel and Stanjek2012), which noted that the formation of a trans-vacant Al structure is a less energetically favorable process and the formation of cis-vacant smectites is more likely than trans‑vacant ones. The incorporation of Mg does not require a dehydroxylation step, which enables the formation of trans-vacant smectite. Similar correlations were observed in natural samples, e.g. in the work by McCarty and Reynolds (Reference McCarty and Reynolds1995) where it was noted that in illite-smectites, the proportion of trans-vacant layers increases with increasing Mg and Fe content in the octahedral sheet.
Thus, the presence of Mg is one of the key factors determining the appearance of trans-vacant admixture in montmorillonites, and the formation of the trans-vacant structure occurs first.
Conclusions
According to the experiments conducted, no pattern was revealed in the formation of cis- and trans-vacant montmorillonite structures when varying the temperature and pressure of synthesis. The synthesized montmorillonites obtained were mixtures of trans- and cis-vacant structures, regardless of the conditions. With increasing synthesis duration, the proportion of the cis‑vacant structure increased. At the same time, beidellite, which does not contain magnesium in the octahedral sheet, was noted to form exclusively in a cis‑vacant configuration, consistent with Lantenois et al. (Reference Lantenois, Muller, Bény, Mahiaoui and Champallier2008). In all the synthesized montmorillonite samples containing magnesium, a systematic admixture of trans‑vacant layers was present alongside the cis‑vacant phase. Thus, the formation of cis‑ or trans‑vacant layers in montmorillonite depended primarily on the cationic composition of the octahedral sheet and not on the synthesis conditions (temperature, pressure).
At a higher synthesis temperature (350°C), aluminum tended to occupy the tetrahedral sheet of smectite, whereas at 250°C Al is virtually absent from the tetrahedral sheet. This is consistent with crystal chemistry, as higher temperatures favor Al coordination in structures with lower coordination numbers. Such changes in structure led to an increase in the CEC values of smectite synthesized at 350°C.
The presence of uncrystallized material complicated the calculation of the formulae for the smectites obtained, which will be taken into account when planning further experiments.
Data availability statement
Data will be made available on reasonable request.
Acknowledgments
The authors express their gratitude to Dr B.R. Tagirov (IGEM RAS) for assistance in conducting the synthesis, to M.D. Kachalina (IGEM RAS) for the IR spectroscopy analysis, to Dr M.S. Chernov (Geology Faculty, Lomonosov Moscow State University) for preparing samples for analysis by SEM, to M.I. Pyatova (Faculty of Soil Science, Lomonosov Moscow State University) for conducting the thermal analysis, and to Dr M.A. Rudmin (Tomsk Polytechnic University) for TEM analysis.
Author contribution
T. Koroleva: processing of analytical data received, graphic material preparation, writing the article; B. Pokidko: experimental process – synthesis; I. Morozov: XRD analysis, writing the article; V. Krupskaya: XRD analysis and project administration.
Financial support
This research was funded under a state assignment performed by IGEM RAS.
Competing interests
The authors of this work declare that they have no competing interests.