





Introduction
Weedy rice (Oryza spp.), also known as red rice, is a globally problematic weed in rice (Oryza sativa L.)-producing regions, including the United States (Gealy et al. Reference Gealy, Saldain and Talbert2000). It has been reported across 40% to 75% of rice cultivation acreage in Europe and 40% to 80% in major rice-producing countries in Central and South America (Fogliatto et al. Reference Fogliatto, Vidotto and Ferrero2010). In California, weedy rice was first reported during the 1920s, likely introduced through contaminated seed from the southern United States (Smiley Reference Smiley1922) and led to significant infestations. The widespread adoption of certified seed programs by rice growers in the 1950s effectively managed the problem for nearly five decades (De Leon et al. Reference De Leon, Karn, Al-Khatib, Espino, Blank, Andaya, Andaya and Brim-DeForest2019; Espino Reference Espino2019). Recently, however, weedy rice has made a resurgence in California rice production systems, with detections on more than 2,000 acres in 2020 (Brim-DeForest et al. Reference Brim-DeForest, Linquist, Al-Khatib, Espino and Leinfelder-Miles2022). Studies have reported yield losses ranging between 49% and 90%, dependent on specific weedy rice biotype, rice cultivar, and cultivation method (Cao et al. Reference Cao, Li, Song, Cai and LU2007; Dai et al. Reference Dai, Dai, Song, Lu and Qiang2014; Karn et al. Reference Karn, De Leon, Espino, Al-Khatib and Brim-DeForest2020a). In addition to reducing yields, weedy rice infestation can reduce the market value of harvested rice by adversely affecting grain quality and causing contamination from discolored kernels, reducing its milling quality (Durand-Morat and Nalley Reference Durand-Morat and Nalley2019; Shivrain et al. Reference Shivrain, Burgos, Scott, Gbur, Estorninos and McClelland2010).
The persistence of weedy rice is amplified by its ecological advantages over cultivated rice. weedy rice biotypes readily shatter seeds at maturity, ensuring a consistent replenishment of the soil seedbank before harvest. In the United States and regions of Asia, compared with cultivated rice, weedy rice often exhibit greater nitrogen use efficiency, accumulating 63% of applied nitrogen within 2 wk of application, 55% higher shoot biomass, 62% greater leaf area, and greater tolerance to abiotic stresses such as heat, water stress, and soil salinity (Balbinot et al. Reference Balbinot, da Rosa Feijó, Fipke, Gehrke, Agostinetto, Kruse, Ziska, Camargo and de Avila2022; Burgos et al. Reference Burgos, Norman, Gealy and Black2006; Chauhan and Johnson Reference Chauhan and Johnson2010b; Fogliatto et al. Reference Fogliatto, Ferrero and Vidotto2020; Ziska and McClung Reference Ziska and McClung2008). These traits, combined with phenotypic plasticity, suggest that weedy rice may become an even more formidable weed under future climate scenarios. The primary driver of weedy rice persistence is the production of seeds with innate or environmentally induced dormancy. Primary dormancy is an innate physiological state present at seed maturation that prevents germination under otherwise favorable conditions. Secondary dormancy is acquired after dispersal when a previously nondormant seed enters dormancy in response to prolonged environmental stress such as soil anoxia or extreme temperature cycling (Finch-Savage and Leubner-Metzger Reference Finch-Savage and Leubner-Metzger2006). The seed dormancy trait, controlled by a suite of genes, allows weedy rice seeds to remain viable in the soil for extended periods (Balbinot et al. Reference Balbinot, da Rosa Feijó, Fipke, Gehrke, Agostinetto, Kruse, Ziska, Camargo and de Avila2022; Pipatpongpinyo et al. Reference Pipatpongpinyo, Korkmaz, Wu, Kena, Ye, Feng and Gu2020). Foundational studies in the southern United States demonstrated that while cultivated rice lost viability within the first year, some weedy rice ecotypes retained viability in greater than 20% of the population after 3 yr and could remain viable up to 7 yr. Other studies, however, found most weedy rice seeds perished or germinated within 2 to 3 yr, highlighting variability based on biotype and environment (Baker et al. Reference Baker, Baldwin, Bourgeois, Cox, Craigmiles, Dishman, Eastin, Helpert, Hill, Huey, Klosterboer and Sonnier1980). The variability of seed dormancy is contingent upon biotype-specific traits in some cases, such as the presence of awns and black hulls (Fogliatto et al. Reference Fogliatto, Vidotto and Ferrero2012; Tseng et al. Reference Tseng, Burgos, Shivrain, Alcober and Mauromoustakos2013). Moreover, weedy rice seeds persist longer under irrigated conditions found in Texas and Arkansas than in California (Goss and Brown Reference Goss and Brown1939).
Cultural control strategies often target the seedbank by manipulating seed burial depth through tillage. Emergence from depth is not a photoblastic response, as light penetrates only a few millimeters, but is rather a function of seed energy reserves (Chung and Paek Reference Chung and Paek2003). In the southern United States, weedy rice biotypes were reported to emerge from soil depths of 7.5 cm (Gealy et al. Reference Gealy, Saldain and Talbert2000), though no emergence was observed from 16 cm (Helpert Reference Helpert1981). In Asia, seedling emergence from 8 cm was not observed in more than 0.5% of the population (Chauhan Reference Chauhan2012). This variability in emergence vigor is linked to biotype characteristics; Gealy et al. (Reference Gealy, Saldain and Talbert2000) found that a Louisiana ecotype that emerged from 7.5 cm at rates 1.5 times greater than other ecotypes also possessed a significantly greater seed and seedling dry weight (4.6 mg per seed vs. 3.8 mg for an Arkansas ecotype), suggesting larger energy reserves facilitated emergence from deeper layers of soil.
Winter flooding is another important method for controlling weeds in California-grown rice. Winter flooding can facilitate weed seed decay and create hypoxic conditions that suppress germination (Chauhan and Johnson Reference Chauhan and Johnson2010a). For example, in Italy, continuous winter flooding over 3 yr reduced the viable weed seedbank by more than 95% compared with dry winter conditions (Fogliatto et al. Reference Fogliatto, Vidotto and Ferrero2010). The depth of the flood is critical; in the Philippines, flooding to a depth of 2 cm reduced weedy rice emergence by 46%, and this reduction increased to 96% at 8 cm under controlled conditions (Chauhan Reference Chauhan2012). Winter flooding also attracts waterfowl, which feed on weed seeds, including the larger seeds of weedy rice, during the winter months (Delouche and Labrada Reference Delouche, Burgos, Gealy, Zorrilla de San Martín and Labrada2007). The efficacy of these management practices is highly dependent on specific biotypes present. In California, Karn et al. (Reference Karn, De Leon, Espino, Al-Khatib and Brim-DeForest2020b) found five distinct weedy rice biotypes (biotypes 1, 2, 3, 4, and 5; identified as B1, B2, B3, B4 and B5 hereafter) based on their morphology. These biotypes vary significantly in their seed dormancy traits. Biotypes B1, B3, and B4 show high innate seed dormancy (3.7% to 26.7% germinating in 7 d), whereas biotypes B2 and B5 showed low innate seed dormancy (70.6% to 80.0% germination in 7 d). Limited information is available on controlling these weedy rice biotypes in California. A recent study on summer emergence found that burying these weedy rice biotypes at 2.5 cm reduced emergence by 43% to 90%, and no emergence was observed from a 5-cm depth (Galvin et al. Reference Galvin, Inci, Mesgaran, Brim-DeForest and Al-Khatib2022). However, this study did not evaluate the overwintering persistence of these biotypes, nor did it investigate the combined influence of fall burial (tillage) and winter flooding.
Given the resurgence of weedy rice in California and the lack of a registered selective herbicide, effective cultural control strategies like fall tillage and winter flooding targeting the overwintering seedbanks are critical. To address this knowledge gap, field experiments were conducted from 2019 to 2022 to understand and quantify the effects of fall burial and winter flooding on weedy rice seeds. The objectives of this study were to (1) quantify the effect of fall burial and winter flooding on weedy rice seed secondary dormancy and mortality and (2) determine whether these effects differ among common California weedy rice biotypes and a cultivated rice variety.
Materials and Methods
Seed Procurement and Initial Viability Testing
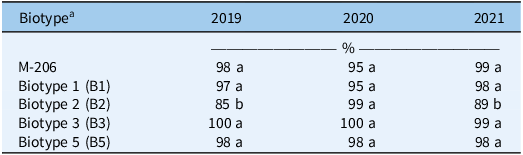
Seeds for weedy rice biotypes B1, B2, B3, and B5 were sourced from field-collected populations at experimental sites at the University of California, Davis (38.543333°N, 121.763333°W). These biotypes were the most widely distributed types in California at the time of the experiment (Karn et al. Reference Karn, De Leon, Espino, Al-Khatib and Brim-DeForest2020b). Biotype B4, also described by Karn et al. (Reference Karn, De Leon, Espino, Al-Khatib and Brim-DeForest2020b), was excluded because sufficient seed was not available at collection time to fulfill 3-yr experimental requirements. Seed of commercial rice cultivar ‘M-206’ was added for comparison purposes and was sourced from the California Rice Experiment Station (CRES) (39.4639616°N, 121.7326040°W). Initial germination tests were conducted every year to test the germinability of all seeds before use in the experiments. For each biotype and variety (B1, B2, B3, B5, and M-206), 400 seeds (100 seeds per replication; 4 replications) were placed evenly in a folded paper towel inside of a clear plastic bag and then VWR International Low Temperature Diurnal Illumination incubator (model 2015, Sheldon Manufacturing, Cornelius, OR, USA) at 30 C and kept moist for 14 d. Germination counts for each biotype were recorded on the 14th day (Table 1).
Viability of weedy rice Oryza spp. biotypes were sourced from field-collected and commercial M-206 variety before use in experiments from 2019 to 2021.

Table 1. Long description
The table presents the germination percentages of different rice biotypes (M-206, Biotype 1, Biotype 2, Biotype 3, and Biotype 5) over the years 2019, 2020, and 2021. The table has 6 rows and 4 columns. The columns are labeled as Biotype, 2019, 2020, and 2021. The row labels are M-206, Biotype 1, Biotype 2, Biotype 3, and Biotype 5. The values in the table are percentages. Row 1: M-206, 2019: 98 percent, 2020: a, 2021: 99 percent. Row 2: Biotype 1, 2019: 97 percent, 2020: a, 2021: 98 percent. Row 3: Biotype 2, 2019: 85 percent, 2020: b, 2021: 89 percent. Row 4: Biotype 3, 2019: 100 percent, 2020: a, 2021: 99 percent. Row 5: Biotype 5, 2019: 98 percent, 2020: a, 2021: 98 percent.
a Average germination of 100 seeds per replication, four replications per biotype. Means followed by same letter within the column are statistically similar based on Tukey’s honest significant difference (HSD) test at α = 0.05.
Experimental Design
The experiment was conducted in a natural outdoor environment on Colusa County property in Colusa, CA (39.206380°N, 121.997323°W) over 3 yr. The study was initiated in the fall of 2019 through the spring of 2020 and repeated across the same span of seasons in 2020 to 2021 and 2021 to 2022. The experiment could not be conducted in a grower’s field due to constraints from the rice industry (prevention of weedy rice spread), so a fenced, locked location was used for this experiment. The experiment was conducted in wading pools (18-cm tall and 115-cm in diameter). Homogenized rice-field soil (20% sand, 33% silt, 47% clay, and 1 to 2.5% organic matter) was collected from the CRES and placed into the wading pools about 7.5-cm deep (Soil Survey Staff 2025). The experiment was designed as a split-plot design with a factorial arrangement of treatments. The main plot factor evaluated in this study was the flooding regime, which included: (1) no-flood treatment, where the soil surface was exposed to ambient weather conditions (holes were drilled into the tubs to prevent flooding and simulate percolation); and (2) flooding treatment with 10 cm of water applied externally in November, with water levels maintained through February. The subplot factors consisted of a factorial combination of (1) two burial depths (2-cm and 6-cm deep); (2) seed type (B1, B2, B3, B5, and M-206); and (3) three burial durations (30, 60, and 90 d). During November of each experimental year (November 26, 2019; November 13, 2020; and November 17, 2021), approximately 100 seeds of each weedy rice biotype were placed in mesh bags and tagged with ID numbers for correct identification. Six mesh bags of each biotype were buried at two depths in each wading pool (three bags per depth level). Each wading pool was considered one replication. Each treatment (a combination of flooding and burial depth) was replicated eight times in 2019 and four times in 2020 and 2021. Oryza spp. seeds that were not buried in the soil were dry-stored at room temperature in the laboratory (24 C) to serve as reference controls for initial viability of seeds from the same seed source. One bag was removed at 30, 60, and 90 d after burial (corresponding to December, January, and February, respectively) from each treatment combination to understand the influence of burial duration.
Seed Mortality and Dormancy Estimation
Seeds were placed evenly in a folded paper towel inside of a clear plastic bag and were immediately moved to an incubator at 30 C and kept constantly moist, and germination counts were taken 14 d after transfer. After 14 d, non-germinated seeds were estimated for mortality or dormancy. To assess seed mortality, non-germinated seeds were gently pressed, and seeds that were soft and hollow on gentle compression were counted as “dead” (Pace et al. Reference Pace, Alexander, Emry and Mercer2016). To assess seed dormancy, remaining seeds that were firm (not dead) were cut in half lengthwise and placed in a 1% 2,3,5-triphenyltetrazolium chloride solution (MP Biomedicals, Solon, OH, USA). Approximately 24 h later, seeds with stained embryos were considered dormant, and those without stained embryos were counted as dead (Pace et al. Reference Pace, Alexander, Emry and Mercer2016). Annual and monthly precipitation and temperature data were collected from a nearby weather station (California Department of Water Resources 2022; Table 2).
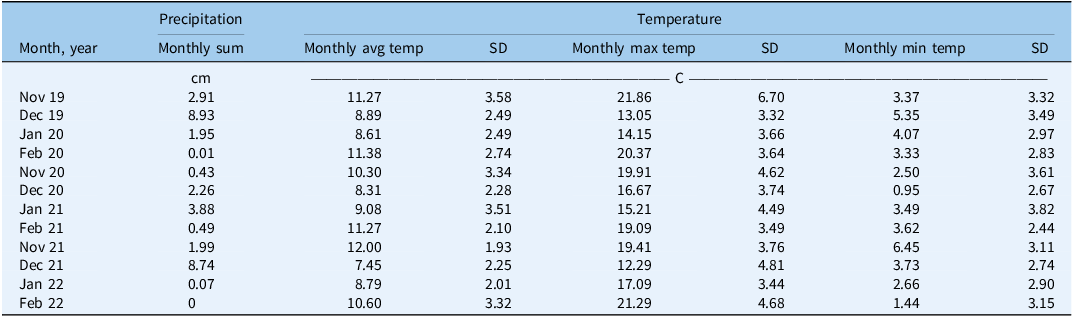
Monthly precipitation and temperature from 2019 to 2022 at Colusa, CA.

Table 2. Long description
A table comparing monthly precipitation and temperature data from 2019 to 2022. The table has 24 rows and 10 columns. Column headers are: Precipitation, Temperature, Month, year, Monthly sum, Monthly avg temp, SD, Monthly max temp, SD, Monthly min temp, SD. Row labels are months and years from Nov 19 to Feb 22. Row 1: Nov 19, 2.91, 11.27, 3.58, 21.86, 6.70, 3.37, 3.32. Row 2: Dec 19, 8.93, 8.89, 2.49, 13.05, 3.32, 5.35, 3.49. Row 3: Jan 20, 1.95, 8.61, 2.49, 14.15, 3.66, 4.07, 2.97. Row 4: Feb 20, 0.01, 11.38, 2.74, 20.37, 3.64, 3.33, 2.83. Row 5: Nov 20, 0.43, 10.30, 3.34, 19.91, 4.62, 2.50, 3.61. Row 6: Dec 20, 2.26, 8.31, 2.28, 16.67, 3.74, 0.95, 2.67. Row 7: Jan 21, 3.88, 9.08, 3.51, 15.21, 4.49, 3.49, 3.82. Row 8: Feb 21, 0.49, 11.27, 2.10, 19.09, 3.49, 3.62, 2.44. Row 9: Nov 21, 1.99, 12.00, 1.93, 19.41, 3.76, 6.45, 3.11. Row 10: Dec 21, 8.74, 7.45, 2.25, 12.29, 4.81, 3.73, 2.74. Row 11: Jan 22, 0.07, 8.79, 2.01, 17.09, 3.44, 2.66, 2.90. Row 12: Feb 22, 0, 10.60, 3.32, 21.29, 4.68, 1.44, 3.15.
Data Analysis
Seed mortality and dormancy were each expressed as the proportion of total seeds recovered per experimental unit. Both response variables were analyzed using R statistical software v. 4.5.3 (R Core Team 2026). Seed mortality and dormancy data were analyzed separately as response variables using generalized linear mixed models (GLMMs) with a binomial distribution and logit link function fit with the lme4 package (Bates et al. Reference Bates, Mächler, Bolker and Walker2015).
The GLMM fit for each response was:
 $\eqalign{ & {\rm{logit}}\left( {\rm{p}} \right) = {\rm{Year}} + {\rm{Flooding}} + {\rm{Biotype}} + {\rm{Depth}} + {\rm{Timing}} \cr & \ \ \ \ \ \ \ \ \ + {\rm{(all two - way\ through\ four - way\ interactions\ among}} \cr & \ \ \ \ \ \ \ \ \ \ {\rm{flooding, biotype, burial\ depth, and\ burial\ duration)}} \cr & \ \ \ \ \ \ \ \ \ + {\rm{Year:Flooding}} + {\rm{Year:Biotype}} + {\rm{Year:Timing}} \cr & \ \ \ \ \ \ \ \ \ + \left( {1{\rm{|Year:Replication}}} \right) \cr}$
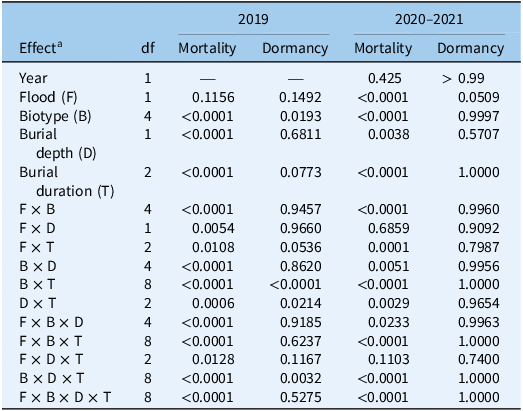
where Year was treated as a fixed factor and replication nested within Year (Year:Replication) was the random effect (Blouin et al. Reference Blouin, Webster and Bond2011; Stroup Reference Stroup2015). Type III Wald chi-square tests were used to assess the significance of all main effects and interactions with the car package (Fox and Weisberg Reference Fox and Weisberg2020); a full ANOVA table is provided in Supplementary Data Table 1. Significant Year × Flooding (P < 0.0001), Year × Biotype (P < 0.0001), Year × Depth (P < 0.0001), and Year × Timing (P < 0.0001) interactions (Supplementary Data Table 1) indicated that treatment responses were not uniform across years. A pooled model would confound within-year treatment biology with between-year environmental variation. To account for this heterogeneity, year-stratified GLMMs were fit separately for 2019 and for pooled 2020 to 2021 data, enabling within-year treatment interpretation without the complexity of five-way interactions (Stroup Reference Stroup2015). Stratification was supported by markedly different climatic conditions of the 2019 to 2020 winter. Seeds buried on November 26, 2019, experienced consecutive subzero minimum air temperatures (−0.5, −1.2, and −2.8 C) during the first 3 d after burial (November 27 to 29), before metabolic quiescence was likely established (Supplementary Data Table 2), coinciding with above-average seasonal precipitation relative to subsequent winters (13.8 cm vs. 7.1 cm in 2020 to 2021 and 10.8 cm in 2021 to 2022; Supplementary Data Table 2). Data from 2020 and 2021 were pooled because the Year main effect within the 2020 to 2021 sub-model was not significant for seed mortality (P = 0.425) or dormancy (P > 0.99), and treatment effects operated in the same direction in both years (Table 3). The 2019 model included Flooding, Biotype, Depth, and Timing as fixed factors with all interactions and Replication as the random effect. The 2020 to 2021 model retained Year (2020 vs. 2021) as a fixed factor with all Year × treatment interactions and Year:Replication as the random effect. Therefore, year-stratified ANOVA results are reported (Table 3). Estimated marginal means were calculated using the emmeans package (Lenth and Piaskowski Reference Lenth and Piaskowski2025). Pairwise comparisons among treatment means within each flooding panel (no flood and continuous flood) were made using Tukey’s honest significant difference (HSD) at α = 0.05, and compact letter displays were generated using the multcomp package (Hothorn et al. Reference Hothorn, Bretz and Westfall2008). Comparisons were not made across flooding panels because flooding was a primary treatment factor.
Type III Wald chi-square test results from binomial generalized linear mixed models (GLMMs) fit separately to 2019 data and to pooled 2020–2021 data.

Table 3. Long description
The table presents Type III Wald chi-square test results from binomial generalized linear mixed models (GLMMs) fit separately to 2019 data and to pooled 2020-2021 data. It has 12 rows and 6 columns. The columns are labeled ‘Effect’, ‘df’, ‘2019 Mortality’, ‘2019 Dormancy’, ‘2020-2021 Mortality’, and ‘2020-2021 Dormancy’. The rows list different effects such as Year, Flood (F), Biotype (B), Burial depth (D), Burial duration (T), and their interactions. Each cell contains p-values indicating the significance of these effects on mortality and dormancy. Notable trends include significant p-values for most effects and interactions, indicating their impact on the studied outcomes.
a Year effect is reported only for the 2020–2021 sub-model; the 2019 model was fit to a single year and has no year term.
Results and Discussion
Across all treatments, biotype, burial depth, and burial duration significantly affected seed mortality in both year strata (P < 0.0001 for all; Table 3), whereas flooding had no significant main effect in 2019 (P = 0.12) but significantly increased overall seed mortality in 2020 to 2021 (24% no flood vs. 32% flood; P < 0.0001; Table 3). In 2019, averaged across flooding and burial treatments, M-206 had the highest seed mortality (73%), followed by B2 (34%), B5 (20%), B1 (20%), and B3 (13%); shallow burial (41%) produced greater mortality than deep burial (28%), and mortality increased with burial duration from 30 d after burial (DAB; 19%) to 60 DAB (39%) to 90 DAB (46%). In 2020 to 2021, M-206 remained the most susceptible biotype (50%, averaged across flooding treatments), followed by B2 (30%), B5 (17%), B3 (11%), and B1 (10%). Deep burial (30%) produced greater mortality than shallow burial (26%), averaged across biotypes and flooding treatments, and mortality increased from 30 DAB (13%) to 90 DAB (44%).
Seed Mortality of M-206 and Weedy Rice Biotypes
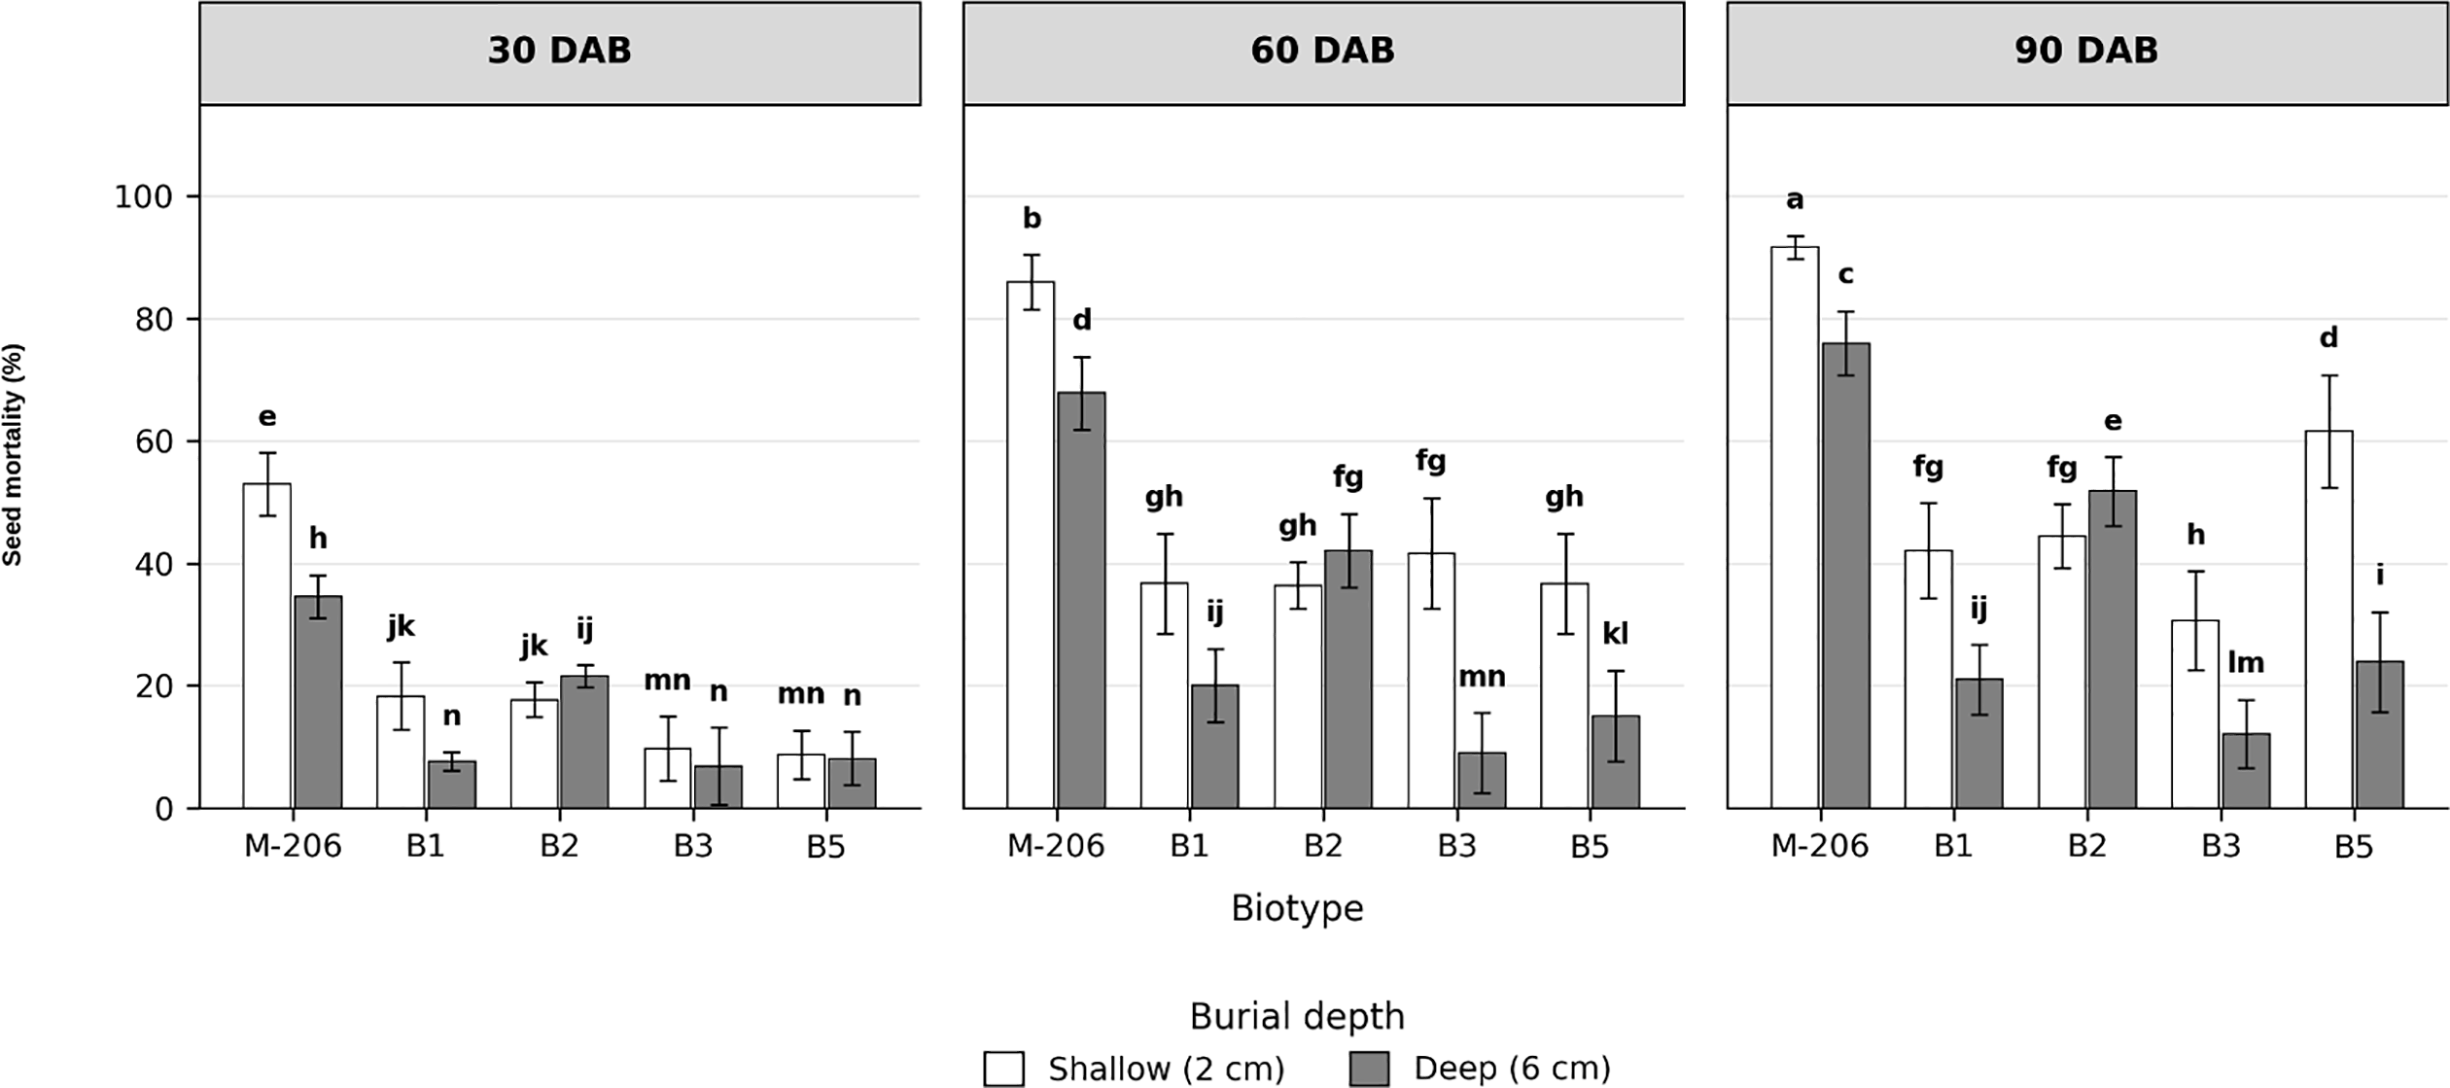
In 2019, seed mortality was affected by biotype, burial depth, burial duration, all two-way interactions, three of the three-way interactions (flooding by biotype by depth, flooding by biotype by timing, biotype by depth by timing) (Figure 1), and the four-way flooding by biotype by burial depth by burial duration interaction (Table 3). In 2020 to 2021, seed mortality was affected by biotype, burial depth, burial duration, flooding, and all two-, three-, and four-way interactions, excluding flooding by depth and flooding by depth by duration interactions (Table 3). The flooding by biotype interaction was significant in both year strata (Table 3) and was the primary driver of the higher-order interactions, as the biotype-specific flooding response interacted with burial depth and duration to generate the significant three- and four-way effects. Flooding increased seed mortality for M-206 and B2, reduced it for B1, and reversed direction for B5 across year strata (Table 4), a biotype-dependent pattern that drives the four-way interaction. The biotype by depth interaction reflected divergent depth responses across biotypes, most strongly expressed in B1 and B2; in 2019, B1 seed mortality averaged across burial durations and flooding treatments was 32% under shallow burial compared with 16% under deep burial, whereas B2 showed an inverted depth response (33% shallow vs. 39% deep) (Figure 2). The biotype by timing interaction indicated that mortality accumulation with burial duration differed substantially among biotypes under continuous flooding in 2019. M-206 reached 46%, 76%, and 83% mortality at 30, 60, and 90 DAB, respectively, whereas B1 accumulated mortality slowly (10%, 14%, and 18%, respectively), and B3 showed most accumulation between 30 and 60 DAB (2%, 18%, and 19%, respectively) (Figure 2). Descriptions of biotype-level responses follow.
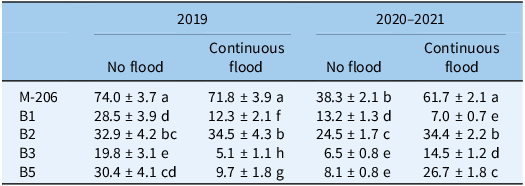
Seed mortality (%) response (means ± SE) of five weedy rice biotypes as influenced by flooding in outdoor experiments conducted in 2019 and 2020–2021 in Colusa, CA a

Table 4. Long description
A table comparing seed mortality percentages across different biotypes and flooding conditions in 2019 and 2020-2021. The table has 6 rows and 4 columns. Column headers are 2019 No flood, 2019 Continuous flood, 2020-2021 No flood, and 2020-2021 Continuous flood. Row labels are M, 38.3, B1, B2, B3, and B5. Row 1: M, 206, 74.0 ± 3.7, 71.8 ± 3.9. Row 2: 38.3, 2.1, 61.7 ± 2.1, a. Row 3: B1, 28.5 ± 3.9, 12.3 ± 2.1, 13.2 ± 1.3, 7.0 ± 0.7. Row 4: B2, 32.9 ± 4.2, 34.5 ± 4.3, 24.5 ± 1.7, 34.4 ± 2.2. Row 5: B3, 19.8 ± 3.1, 5.1 ± 1.1, 6.5 ± 0.8, 14.5 ± 1.2. Row 6: B5, 30.4 ± 4.1, 9.7 ± 1.8, 8.1 ± 0.8, 26.7 ± 1.8.
a Means were compared among different biotypes across flooding treatments within each response variable. Letters indicate significant differences among biotypes within each response variable based on Tukey’s honest significant difference (HSD) at α = 0.05.
Seed mortality (%) of overwintering weedy rice (Oryza spp.) biotypes as influenced by burial depth and burial duration in an outdoor experiment conducted in 2019 in Colusa, CA. Bars with the same letters are statistically similar within the burial duration panel based on Tukey’s honest significant difference (HSD) at α = 0.05. Error bars are standard errors of the mean. DAB, days after burial.

Figure 1. Long description
Panel A: A bar graph comparing seed mortality percentages of different weedy rice biotypes at 30 days after burial (D A B). The horizontal axis represents biotypes (M 206, B 1, B 2, B 3, B 5) and burial depths (shallow 2 centimeters, deep 6 centimeters). The vertical axis represents seed mortality percentages ranging from 0 to 100 percent. Bars are labeled with letters indicating statistical similarity. Panel B: A bar graph comparing seed mortality percentages of different weedy rice biotypes at 60 D A B. The horizontal axis represents biotypes and burial depths, and the vertical axis represents seed mortality percentages. Bars are labeled with letters indicating statistical similarity. Panel C: A bar graph comparing seed mortality percentages of different weedy rice biotypes at 90 D A B. The horizontal axis represents biotypes and burial depths, and the vertical axis represents seed mortality percentages. Bars are labeled with letters indicating statistical similarity.
Seed mortality (%) of overwintering weedy rice (Oryza spp.) biotypes as influenced by burial depth and burial duration in an outdoor experiment conducted from 2019 in Colusa, CA. Bars with the same letters are statistically similar within the flooding treatment based on Tukey’s honest significant difference (HSD) at α = 0.05. Error bars are standard errors of the mean. DAB, days after burial.

Figure 2. Long description
Panel A: A bar graph showing seed mortality percentages at 30 days after burial (D A B) for different biotypes under no flood conditions. The horizontal axis represents biotypes (M 206, B 1, B 2, B 3, B 5) and burial depths (shallow 2 centimeters, deep 6 centimeters). The vertical axis represents seed mortality percentage. Panel B: A bar graph showing seed mortality percentages at 60 D A B for different biotypes under no flood conditions. The horizontal axis represents biotypes and burial depths. The vertical axis represents seed mortality percentage. Panel C: A bar graph showing seed mortality percentages at 90 D A B for different biotypes under no flood conditions. The horizontal axis represents biotypes and burial depths. The vertical axis represents seed mortality percentage. Panel D: A bar graph showing seed mortality percentages at 30 D A B for different biotypes under continuous flood conditions. The horizontal axis represents biotypes and burial depths. The vertical axis represents seed mortality percentage. Panel E: A bar graph showing seed mortality percentages at 60 D A B for different biotypes under continuous flood conditions. The horizontal axis represents biotypes and burial depths. The vertical axis represents seed mortality percentage. Panel F: A bar graph showing seed mortality percentages at 90 D A B for different biotypes under continuous flood conditions. The horizontal axis represents biotypes and burial depths. The vertical axis represents seed mortality percentage.
M-206 seed mortality was not affected by flooding and had the highest mortality in 2019 under both flooding regimes (74.0 ± 3.7% no flood, 71.8 ± 3.9% flood; Table 4). Burial depth affected M-206 seed mortality under no-flood treatment. Shallow burial (2 cm) produced M-206 seed mortality of 54%, 90%, and 94% at 30, 60, and 90 DAB, respectively, compared with 32%, 65%, and 78% at deep (6 cm) burial (Figure 2). Under continuous flood treatment, the depth effect was attenuated. M-206 seed mortality was 91% (shallow) and 77% (deep) at 90 d (Figure 2). Burial duration increased M-206 seed mortality from 30 to 90 d under all flooding and depth combinations (Figure 2). In 2020 to 2021, continuous flood treatment significantly increased M-206 seed mortality compared with no-flood treatment (38.3 ± 2.1% no flood vs. 61.7 ± 2.1% flood; Table 4). Deep burial under continuous flood at 90 d produced the highest 2020 to 2021 M-206 mortality (78%; Figure 3). The differential response from no flooding effect in 2019 to a positive flooding effect in 2020 to 2021 could be attributed to a ceiling imposed by freeze–thaw imposed surface mortality due to consecutive subzero minimum air temperatures (−0.5, −1.2, and −2.8 C) on the first 3 d after seed burial, before metabolic quiescence was likely established (Connolly and Orrock Reference Connolly and Orrock2015; Supplementary Data Table 2), where shallow no-flood mortality reached 94%, additional lethal mechanisms cannot raise it further. Under normal winter conditions, continuous flood treatment is the primary driver of M-206 seed mortality. M-206 lacks dormancy mechanisms, and nondormant seeds that initiate germination under winter submergence exhaust carbohydrate reserves without completing seedling emergence, resulting in hypoxic death (Ismail et al. Reference Ismail, Ella, Vergara and Mackill2009).
Seed mortality (%) of overwintering weedy rice (Oryza spp.) biotypes as influenced by burial depth and burial duration in an outdoor experiment conducted in 2020 and 2021 in Colusa, CA. Bars with the same letters are statistically similar within the flooding treatment based on Tukey’s honest significant difference (HSD) at α = 0.05. Data are pooled across years, and error bars are standard errors of the mean. DAB, days after burial.

For fields with confirmed B1 presence, continuous winter flooding is counterproductive. It suppresses seed mortality and simultaneously induces secondary dormancy. Seeds buried close to the soil surface under no-flood conditions for 90 d consistently experienced approximately 65% mortality across years and represent the more effective management approach. Flooding reduced B1 seed mortality in both year strata, contrasting with the mortality-promoting flooding effect on M-206 in 2020 to 2021. In 2019, continuous flood treatment reduced B1 mortality from 28.5 ± 3.9% (no flood) to 12.3 ± 2.1% (flood; Table 4). Under no-flood treatment, burial depth was the primary driver: shallow (2 cm) burial produced 65% seed mortality at 90 d, while deep (6 cm) burial produced only 23% seed mortality (Figure 2), contrary to the positive depth–mortality relationship generally documented for weedy rice seedbanks (Tian et al. Reference Tian, Pang, Jiang and Lu2024; Zhang et al. Reference Zhang, Gao, Dai, Song, Hu and Qiang2019). This reversal suggests deeply buried B1 seeds remained metabolically quiescent rather than expending energy reserves on failed emergence attempts. Under continuous flood treatment in 2019, depth effects were abolished; B1 seed mortality was 17% at both shallow and deep burial at 90 d, and the burial duration effect was substantially attenuated relative to no-flood treatment (Figure 2). In 2020 to 2021, flooding continued to reduce B1 mortality (13.2 ± 1.3% no flood vs. 7.0 ± 0.7% flood; Table 4). Under no-flood conditions in 2020 to 2021, the steep depth gradient of 2019 was not apparent, with both depths producing high mortality at 90 d (65% shallow, 55% deep; Figure 3). Under continuous flood treatment in 2020 to 2021, B1 mortality remained suppressed at both depths (27% shallow, 29% deep at 90 d; Figure 3). B1 seeds likely enter an anaerobic quiescent state under prolonged submergence that protects them from hypoxic death, though the specific molecular mechanisms were not investigated here. This response has been documented in other weedy and wild rice genotypes and is associated with anaerobic respiration pathways that maintain embryo viability while suppressing germination (Benvenuti and Macchia Reference Benvenuti and Macchia1995; Jiang et al. Reference Jiang, Zhu and Lu2022).
For fields with confirmed B2 presence, continuous winter flooding with deep burial (≥6 cm) over 90 d is the clear recommendation. Unlike all other biotypes, B2 seed mortality was consistently higher at deep (6 cm) burial than at shallow (2 cm) burial. In 2019, under no-flood treatment, B2 seed mortality at 90 d was 53% (deep) compared with 46% (shallow); under continuous flood treatment, 52% (deep) compared with 43% (shallow; Figure 2). The biotype by depth interaction was significant in both year strata (Table 3), with B2 exhibiting an inverted depth response; unlike all other biotypes, B2 seed mortality was higher at deep (6 cm) burial than at shallow (2 cm) burial averaged across flooding treatments and burial durations (39% vs. 33% in 2019; Figure 2). The flooding by depth interaction was significant in 2019 but not in 2020 to 2021 (Table 3), indicating that the amplifying effect of flooding on depth-driven B2 mortality was specific to 2019 conditions. In 2020 to 2021, B2 seed mortality under continuous flood treatment at deep burial reached 79% at 90 d, the highest recorded for any biotype under any treatment (Figure 3). Deep burial under no-flood treatment in 2020 to 2021 also outpaced shallow burial (52% vs. 41% at 90 d; Figure 3), and the overall flooding effect increased (24.5 ± 1.7% no flood vs. 34.4 ± 2.2% flood; Table 4). Many annual weed species show greater mortality at shallow burial through temperature oscillation and desiccation–rewetting cycles, while deep burial provides buffered conditions that reduce mortality (Benvenuti and Macchia Reference Benvenuti and Macchia1995). B2 inverts this pattern: it likely cannot enter metabolic quiescence or induce dormancy under anaerobic conditions at depth, making deep burial under continuous flooding the most lethal treatment combination for this biotype.
B3 had the lowest overall seed mortality of any biotype across years, and winter cultural strategies alone are insufficient to reduce B3 seedbanks to agronomically meaningful levels. In 2019, continuous flood treatment reduced B3 seed mortality (19.8 ± 3.1% no flood vs. 5.1 ± 1.17% flood; Table 4), consistent with the freeze–thaw protection pattern observed for other biotypes under flooding that year (Connolly and Orrock Reference Connolly and Orrock2015; Supplementary Data Table 2). In 2020 to 2021, continuous flood treatment modestly increased B3 seed mortality (6.5 ± 0.8% no flood vs. 14.5 ± 1.2% flood; Table 4). Deep burial under continuous flood treatment at 90 d produced only 34% seed mortality in 2020 to 2021 (Figure 3). Burial duration contributed to B3 seed mortality in 2019, with mortality increasing from 30 to 60 DAB but showing minimal additional accumulation by 90 DAB; burial depth also influenced B3 mortality in 2019, with shallow burial producing greater mortality than deep burial under continuous flooding. Sequential programs integrating stale-seedbed practices targeting spring emergence flushes, in-season herbicide applications, and multiyear management will be necessary to suppress this biotype.
For B5-dominated fields, no single winter flooding treatment reliably maximizes seed mortality across years; shallow dry fallow during winters with documented subzero temperature events produces the most consistent depletion, while deep-flood burial may augment depletion in winters without temperature extremes. In 2019, shallow burial under no-flood treatment at 90 d provided 82% B5 seed mortality, second only to M-206 (Figure 2). Flooding dramatically reduced B5 seed mortality in 2019 (30.4 ± 4.1% no flood vs. 9.7 ± 1.8% flood; Table 4). Under continuous flood treatment in 2019, B5 seed mortality at 90 d was 40% (shallow) and 16% (deep), substantially below the no-flood treatment at comparable depths (Figure 2). The flooding by biotype by burial depth by burial duration interaction in 2019 (Table 3) was driven in part by the collapse of the depth-dependent B5 mortality gradient under continuous flooding: the 53 percentage point shallow-vs.-deep contrast under no-flood treatment (82% shallow vs. 29% deep at 90 d) was reduced to a 24 percentage point gap under continuous flooding (40% shallow vs. 16% deep) (Figure 2). In 2020 to 2021, the flooding response reversed direction, whereby continuous flooding increased B5 seed mortality (8.1 ± 0.8% no flood vs. 26.7 ± 1.8% flood, averaged across burial depth and duration; Table 4), and deep burial under continuous flood at 90 d reached 49% (Figure 3). No-flood mortality was substantially lower in 2020 to 2021 (28% shallow, 18% deep at 90 d) than in 2019. This directional reversal across year strata is consistent with a freeze–thaw mechanism where B5 seeds buried on November 26, 2019, were exposed to consecutive subzero minimum air temperatures (−0.5, −1.2, and −2.8 C) during the first 3 d after burial, before metabolic quiescence was likely established (Supplementary Data Table 2). The coincident above-average seasonal precipitation (13.8 cm vs. 7.1 cm in 2020 to 2021 and 10.8 cm in 2021 to 2022; Table 2) likely maintained elevated soil moisture at burial, potentially hastening seed imbibition and increasing cellular water content, conditions that can amplify susceptibility to freeze-induced cellular damage (Gusta et al. Reference Gusta, Gao and Benning2006). Flooding buffered those temperature extremes and reduced mortality (Connolly and Orrock Reference Connolly and Orrock2015; Supplementary Data Table 2). In 2020 to 2021, seeds were buried approximately November 13; the season’s first subzero events did not occur until 9 d after burial, by which time surface seeds had likely equilibrated; without early freeze–thaw stress, prolonged flooding imposed anaerobic conditions lethal to B5 rather than protective. Although flooding imposes anaerobic stress on B5 seeds regardless of year, the net effect in 2019 to 2020 was protective, because early-burial freeze mortality in unprotected surface seeds represented the larger threat; once that freeze risk was absent in 2020 to 2021, anaerobic stress from prolonged flooding became the dominant driver of B5 mortality. Collectively, these biotype-specific mortality responses confirm that biotype identity is the primary determinant of seedbank fate under winter management, superseding the individual main effects of flooding, depth, and timing. The opposing flood effects on M-206 and B2 (mortality promoting) versus B1 (mortality suppressing) create a fundamental management trade-off that cannot be resolved by any single winter treatment when these biotypes co-occur.
Pre-burial germination exceeded 90% for all biotypes in each experimental year (Table 1), indicating seeds were essentially nondormant at burial; elevated dormancy at retrieval therefore represented secondary dormancy induced by treatments. In 2019, seed dormancy was affected by the biotype by depth by timing interaction (P = 0.0032; Table 3), with B1 exhibiting the greatest response under continuous flooding at deep burial; dormancy was not significantly affected by any treatment in 2020 to 2021 (Table 3).
Integrated Management and Limitations
Winter flooding and fall burial together provided biotype-specific seed mortality responses, and the direction and magnitude of these effects differed significantly across biotypes and year strata, underscoring that no single combination is commonly optimal across California weedy rice populations. Burial duration was the most consistent driver of seed mortality across biotypes and years, with 90 DAB producing substantially greater mortality than 30 DAB for M-206 and B2; however, extended burial duration provided only modest additional benefit for B3 and B1, regardless of flooding treatment. Across all biotypes in 2020 to 2021, continuous flooding increased overall seed mortality (32%) compared with no-flood treatment (24%), but this main effect masked opposing biotype responses where flooding promoted mortality for M-206, B2, and B5 while suppressing it for B1, with no single flooding management strategy simultaneously increasing seed mortality for all five biotypes evaluated. These results reveal a fundamental challenge for California rice producers managing fields with mixed weedy rice populations. The treatment combination that most effectively depletes B2 seedbanks (continuous winter flood with deep burial) is the same combination that preserves B1 seeds through anaerobic quiescence and secondary dormancy induction. Field surveys in California rice production have documented that multiple weedy biotypes frequently co-occur within a single paddy (Fogliatto et al. Reference Fogliatto, Vidotto and Ferrero2010; Galvin et al. Reference Galvin, Inci, Mesgaran, Brim-DeForest and Al-Khatib2022), and no single winter management strategy satisfies the competing requirements of all biotypes simultaneously.
For B2-dominated fields, continuous winter flood with deep burial (≥ 6 cm) over 90 d is the clear recommendation. Seed mortality of B2 under continuous flood deep burial treatment was 52% in 2019 and 79% in 2020 to 2021, the highest values recorded for B2 under any treatment. For B1-dominated fields, winter flooding should be avoided; shallow (2 cm) no-flood fallow for 90 d produced 65% seed mortality consistently across years without inducing dormancy. B3 is essentially unresponsive to all winter cultural strategies evaluated and requires supplemental in-season management regardless of winter conditions. Fields with confirmed mixed B1 and B2 populations present the most difficult management scenario; no uniform treatment simultaneously optimizes depletion of both biotypes. Effective decisions in those fields require biotype identification before implementing winter practices. Morphological keys using pigmentation, awn presence, and panicle architecture, supplemented by molecular markers for ambiguous cases, provide a practical field-level approach (De Leon et al. Reference De Leon, Karn, Al-Khatib, Espino, Blank, Andaya, Andaya and Brim-DeForest2019; Karn et al. Reference Karn, De Leon, Espino, Al-Khatib and Brim-DeForest2020b). In mixed-biotype situations, a zone-based approach like deep-flood management in paddies with confirmed B2 dominance and shallow dry fallow in paddies with confirmed B1 dominance may reduce whole-field seedbank persistence more effectively than any uniform treatment. The biotype-specific ecophysiological responses documented here complement the phenotypic characterization of these same California biotypes by Karn et al. (Reference Karn, De Leon, Espino, Al-Khatib and Brim-DeForest2020b), who identified substantial morphological diversity in pericarp color, awn development, and other adaptive traits. The present findings establish that this morphological diversity is accompanied by equally pronounced diversity in seedbank survival strategy under winter management, reinforcing that biotype identity, not just weed presence, should inform management decisions (Karn et al. Reference Karn, De Leon, Espino, Al-Khatib and Brim-DeForest2020a, Reference Karn, De Leon, Espino, Al-Khatib and Brim-DeForest2020b).
These experiments were conducted under simulated winter management conditions using outdoor wading pool mesocosms, which controlled flooding depth and duration but precluded interactions with rice root systems, soil organic matter dynamics, and natural seed predation. Field-scale hydrology, including variability in drainage and surface topography, may alter effective burial depth and flooding duration relative to the conditions evaluated here. The biotype responses reported are specific to the California Sacramento Valley climate, and B1’s anaerobic quiescence response may differ under warmer winter temperatures experienced in subtropical rice production regions.
Supplementary material
To view supplementary material for this article, please visit https://doi.org/10.1017/wsc.2026.10155.
Data availability
The data supporting the findings of this study are available from the corresponding author upon reasonable request.
Acknowledgments
Thank you to Colusa County and the University of California Cooperative Extension Colusa for allowing the usage of the space. Ryan Hall, Puja Upadhayay, Marco Giron, Kayla Minehan, Taylor Richardson, and Amelia Zepeda assisted with the lab and fieldwork.
Funding statement
Funding for this work was provided by an endowment from the UC Cooperative Extension Presidential Chair for California Grown Rice (from the California Rice Research Board and the University of California Division of Natural Resources). It was also funded by grants from the California Rice Research Board.
Competing interests
The authors declare no conflicts of interest.


 Open access

