Implications
High-yielding dairy cows on confined total mixed ration systems improve their profitability as they improve reproductive performance, which determines higher milk production, more calves, lower replacement costs and lower relative reproduction costs. Overall reproductive performance can be measured by average pregnancy rate in 21-day intervals, which ranges between 10% and 40%. Most farms rely on a combination of oestrous detection and synchronisation ovulation control programme, which seems to be economically effective. Use of alternative pregnancy diagnosis such as earlier blood chemical tests could be economically feasible if accurate. Opportunities for cow-level reproductive management exist within herd defined reproductive programmes.
Introduction
Herd net return on high yielding confined total mixed ration (TMR) systems is strongly associated with reproductive performance (Giordano et al., Reference Giordano, Kalantari, Fricke, Wiltbank and Cabrera2012; Galvao et al., Reference Galvao, Federico, De Vries and Schuenemann2013). Efficient reproductive programme regulate herd population dynamics and herd structure allowing cows to take advantage of the most efficient part of the lactation curve (Ferguson and Galligan, Reference Ferguson and Galligan1999), while maximising production of on-farm replacements (Giordano et al., Reference Giordano, Kalantari, Fricke, Wiltbank and Cabrera2012), minimising costs associated with replacements and mortality (Giordano et al., Reference Giordano, Fricke, Wiltbank and Cabrera2011 and Reference Giordano, Kalantari, Fricke, Wiltbank and Cabrera2012; Galvao et al., Reference Galvao, Federico, De Vries and Schuenemann2013), and minimising the relative costs associated with reproduction (Giordano et al., Reference Giordano, Kalantari, Fricke, Wiltbank and Cabrera2012). Most of high-yielding dairy farms in the United States use a combination of synchronisation/ovulation control protocols and oestrous detection (OD) for their reproductive management (Caraviello et al., Reference Caraviello, Weigel, Fricke, Wiltbank, Florent, Cook, Nordlund, Zwald and Rawson2006; Giordano et al., Reference Giordano, Kalantari, Fricke, Wiltbank and Cabrera2012; Galvao et al., Reference Galvao, Federico, De Vries and Schuenemann2013). Although there are a number of metrics for reproductive performance (e.g. herd days open or calving interval), the 21-day pregnancy rate (21-d PR; Ferguson and Galligan, Reference Ferguson and Galligan1999), which measures the rate at which eligible cows become pregnant in successive 21-day periods, integrates many other reproductive performance parameters and seems to be the best single parameter to measure, standardise and benchmark reproductive performance among herds (Giordano et al., Reference Giordano, Fricke, Wiltbank and Cabrera2011 and Reference Giordano, Kalantari, Fricke, Wiltbank and Cabrera2012; Galvao et al., Reference Galvao, Federico, De Vries and Schuenemann2013). Managers of modern US commercial dairy farms monitor their herd’s reproductive performance using the 21-d PR index. However, it is difficult for them to assess the overall economic impacts of reproductive programme. A series of simulation studies in recent years (Giordano et al., Reference Giordano, Fricke, Wiltbank and Cabrera2011, Reference Giordano, Kalantari, Fricke, Wiltbank and Cabrera2012 and Reference Giordano, Fricke and Cabrera2013; Galvao et al., Reference Galvao, Federico, De Vries and Schuenemann2013) attempt to provide responses to these difficult questions and are the main subject of this review paper. Some of these studies also provide decision support tools that could be customised for herd-specific economic assessments related to reproduction. New technologies such as OD devices or early blood chemical pregnancy diagnosis tests, are being adopted by modern high-yielding herd operations, and could make significant differences on the management and outcomes of reproductive programmes. Therefore, these should also be included in the economic analysis of reproductive programme (Giordano et al., Reference Giordano, Fricke and Cabrera2013). Once the dairy farm manager finds the best reproductive programme for the herd, there are still opportunities to further fine-tune reproductive performance by executing cow-level reproductive decisions. The concept of the economic value of a cow (Cabrera, Reference Cabrera2012) or its equivalent retention pay-off (RPO; De Vries, Reference De Vries2006) and all their associated metrics (e.g. the value of a new pregnancy, the cost of a pregnancy loss, and the cost of a day open) could be used to differentiate and optimise cow-specific reproductive management, which will ultimately determine optimal herd value (Kalantari and Cabrera, Reference Kalantari and Cabrera2012).
The economic value of improving reproductive performance
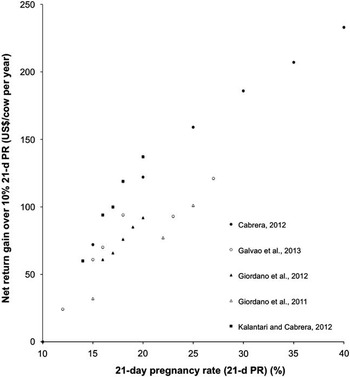
A series of studies demonstrate consistently that improving reproductive performance improves the cow and the herd economic net returns (Giordano et al., Reference Giordano, Fricke, Wiltbank and Cabrera2011 and Reference Giordano, Kalantari, Fricke, Wiltbank and Cabrera2012; Cabrera, Reference Cabrera2012; Kalantari and Cabrera, Reference Kalantari and Cabrera2012; Galvao et al., Reference Galvao, Federico, De Vries and Schuenemann2013). These gains follow the law of diminishing returns and, therefore, economic gains are greater with a lower initial 21-d PR. A curve of reproductive performance (i.e. 21-d PR) v. economic net return (i.e. US$/cow per year) can be described as a quadratic function with diminishing net returns at higher 21-d PR. Nonetheless, economic gains still exist even above 40% 21-d PR (Figure 1). Reproductive performance indicating a 21-d PR of between 30% and 40% are outstanding (Ferguson and Skidmore, Reference Ferguson and Skidmore2013) considering that the US average might be below 16% (Raleigh DRMS, 2012). Increasing the 21-d PR by 1 percentage point increases the economic net return (US$/cow per year) between $14.4, $10, $7.4, $5.4, $4.2 and $3.2 when the 21-d PR increases within 10% to 15%, 15% to 20%, 20% to 25%, 25% to 30%, 30% to 35% and 35% to 40%, respectively (Figure 1, Cabrera, Reference Cabrera2012). These values are highly dependent on economic variables (e.g. milk price or reproductive costs), however, gains with increased reproductive performance and the decreasing trend at lower reproductive capacity are consistent among studies (Giordano et al., Reference Giordano, Fricke, Wiltbank and Cabrera2011 and Reference Giordano, Kalantari, Fricke, Wiltbank and Cabrera2012; Cabrera, Reference Cabrera2012; Kalantari and Cabrera, Reference Kalantari and Cabrera2012; Galvao et al., Reference Galvao, Federico, De Vries and Schuenemann2013). Variability in the net return gain (US$/cow per year per 1% increased 21-d PR) was between $18 and $7 for reproductive programmes between 10% and 26% 21-d PR (Galvao et al., Reference Galvao, Federico, De Vries and Schuenemann2013); $9 and $7 for reproductive programmes between 14% and 20% 21-d PR (Giordano et al; Reference Giordano, Kalantari, Fricke, Wiltbank and Cabrera2012); $17 and $13 for programmes between 14% and 20% 21-d PR (Kalantari and Cabrera, Reference Kalantari and Cabrera2012); and $9 and $6 for programmes between 15% and 25% 21-d PR (Giordano et al., Reference Giordano, Fricke, Wiltbank and Cabrera2011).
Approximate economic net return gain (US$/cow per year) of improving reproductive efficiency by 10 percentage points of a 21-day pregnancy rate (21-d PR) compiled from different studies. Quadratic fit on Cabrera (Reference Cabrera2012) was net return gain (US$)=−0.1881(21-d PR2)+16.783(21-d PR)−143.36 (R 2=0.995).

Components of reproductive economic value
Economic gains of improving reproductive performance occur because of higher milk productivity and consequent increase in milk sales and potentially higher milk income over feed cost, greater calf sales, lower replacement and mortality costs and lower relative reproductive costs. These factors seem to be the most important determinants of economic reproductive efficiency (Giordano et al., Reference Giordano, Kalantari, Fricke, Wiltbank and Cabrera2012; Galvao et al., Reference Galvao, Federico, De Vries and Schuenemann2013). However, the overall value of improving reproductive efficiency is a combination of all economic factors interacting with no single factor being defined as the most important in all situations. For example, at low reproductive performances (e.g. between 10% and 15% 21-d PR), the most important factor could be the savings of decreasing culling (reproductive or involuntary culling) and mortality, but at higher reproductive performances (e.g. between 25% and 30% 21-d PR) the most important factors could be milk and calf sales. Nonetheless, large variations occur among studies and specific conditions of studied herds. The dairy herd is a complex interrelated system, which is dynamically affected by changes in reproductive performance.
Milk productivity, milk sales and milk income over feed cost
As milk productivity increases, feed costs also increase and although some studies found that the milk income over feed cost increased with reproductive performance (Giordano et al., Reference Giordano, Kalantari, Fricke, Wiltbank and Cabrera2012; Kalantari and Cabrera, Reference Kalantari and Cabrera2012), other studies reported that the milk income over feed cost could, at times, decrease slightly as reproductive performance increases (Cabrera, Reference Cabrera2012; Galvao et al., Reference Galvao, Federico, De Vries and Schuenemann2013). The relationship between milk production and feed consumption is complex and interacts with many factors such as the herd structure, feeds prices and the shape and persistence of lactation curves. Cabrera (Reference Cabrera2012) and Galvao et al. (Reference Galvao, Federico, De Vries and Schuenemann2013) reported a combined synergistic and antagonistic effect of reproductive performance and milk income over feed cost at varying levels of 21-d PR. The gain in income over feed cost (US$) varied between +$9 (Giordano et al., Reference Giordano, Fricke, Wiltbank and Cabrera2011) and −$2.4 (Galvao et al., Reference Galvao, Federico, De Vries and Schuenemann2013) per 1% increase in 21-d PR. It is difficult to identify the specific reasons for these differences, but it can be speculated that they are due to a series of factors interacting as discussed below. In all cases, milk production was simulated as a function of the state of the cow’s lactation following a standard lactation curve, which determined the feed requirements. Therefore, the main driver of milk production and milk income over feed cost was the herd structure, which responded to reproductive performance. The understanding is that better reproductive programmes will determine that cows, and therefore, more cows in a herd, spend more time in the best part of their milk production curve, in which the ratio between milk produced and feed consumed is greater, generating greater milk income over feed costs. However, this relationship depends on the level and persistence of the lactation curves. Using the Cabrera (Reference Cabrera2012) model at different levels of production, and, therefore, different shapes and persistence of lactation curves, it was demonstrated that milk income over feed costs could remain static, decrease or increase with increased reproductive performance. Highly persistent lactation curves, as they are common in high-yielding dairy farms in confined systems using TMR, could indicate that there is an opportunity, in some cases, to slightly delay the voluntary waiting period (the time to start breeding postpartum) to improve milk income over feed cost. Indeed, this fact was earlier detected and reported by De Vries (Reference De Vries2006), who indicated that the value of a pregnancy could become negative if established early in lactation if the lactation curve is highly persistent. Galvao et al. (Reference Galvao, Federico, De Vries and Schuenemann2013) offered additional insights in this dilemma, indicating that another factor with an important role in the milk income over feed costs is the herd structure related to the number of cows producing milk in the herd in relationship to the reproductive programme and its associated reproductive performance. Galvao et al. (Reference Galvao, Federico, De Vries and Schuenemann2013) argued that in their study of a herd of 1000 cows, there were between 36 and 39 fewer cows producing milk (dry cows) in the best reproductive performance programme (26.8% 21-d PR) compared two the worst programme (10.9% 21-d PR), which counteracted the increased productivity in milk on a per cow basis.
Relationship between herd milk productivity and the economic value of reproductive programmes
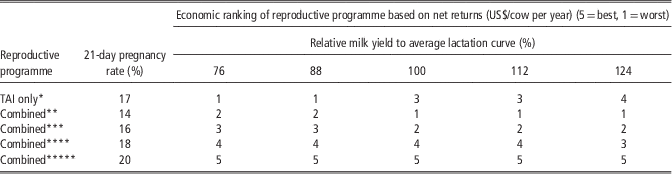
Further evidence of interaction between herd milk productivity and economic value of reproductive programmes was revealed by Kalantari and Cabrera (Reference Kalantari and Cabrera2012), who included herd milk productivity level as an additional variable in the model. Defined programmes included a timed artificial insemination (TAI) programme only and four combined (TAI with OD) programmes (Table 1). These were analysed at four levels of milk production relative to an average (76%, 88%, 100%=average, 112% and 124%). With the exception of the best performing reproductive programme (combined having 20% 21-d PR), all other reproductive programmes changed their economic performance rankings according to the expected herd milk yield. For example, the pure TAI programme with the lowest ranking programme at lower milk production levels, was above average at average milk yield and at 112% relative milk yield and the second highest when relative milk yield was 124%. It is clear then that economic decisions regarding reproductive programmes should be performed according to farm-specific levels of milk production and the shape of lactation curves. It could even be further speculated that reproductive programmes, over time, would impact on productivity and, therefore, there will be a complex interaction between reproductive performance and productivity, which had not yet formally been studied. Hence, a sensible recommendation is to re-evaluate the economic impact of reproductive programmes periodically as farm conditions change.
Relationship between milk productivity and best economic value of reproductive programmes as reported by Kalantari and Cabrera (Reference Kalantari and Cabrera2012)

TAI=timed artificial insemination; OD=oestrous detection; CR=conception rate.
Reproductive programmes are a subset of those defined in Giordano et al. (Reference Giordano, Kalantari, Fricke, Wiltbank and Cabrera2012).
* TAI only programme having a Presynch-Ovsynch with 42% CR for first service and Ovsynch resynchronisations with 30% CR for subsequent services.
** TAI+OD with 70% OD rate and 25% CR to OD breeding; and 32% CR to first TAI breeding and 28% CR to subsequent TAI breeding.
*** TAI+OD with 50% OD rate and 30% CR to OD breeding; and 36% CR to first TAI breeding and 30% CR to subsequent TAI breeding.
**** TAI+OD with 30% OD rate and 35% CR to OD breeding; and 40% CR to first TAI breeding and 30% CR to subsequent TAI breeding.
***** TAI+OD with 80% OD rate and 35% CR to OD breeding; and 30% CR to first TAI breeding and 28% CR to subsequent TAI breeding.
Calf sales
Greater reproductive performance determines faster rate of pregnancy establishment and, therefore, greater production of calves, which is translated into greater net return. Previous research consistently agreed that greater calf sales or greater value of offspring are a consequence of improved reproductive efficiency (Cabrera, Reference Cabrera2012; Giordano et al., Reference Giordano, Kalantari, Fricke, Wiltbank and Cabrera2012; Kalantari and Cabrera, Reference Kalantari and Cabrera2012; Galvao et al., Reference Galvao, Federico, De Vries and Schuenemann2013). Cabrera (Reference Cabrera2012) used a combined value per calf (weighted average of male and female offspring) of $100. Results from Cabrera (Reference Cabrera2012) conforms to the following quadratic function: Net return gain (US$/cow per year)=−0.0352 (21-d PR)2+2.8476 (21-d PR)+18.93 (R 2=0.996). This function indicates a net return gain (US$/cow per year) of between $3 and $1 per 1% increase in 21-d PR for low and high initial 21-d PR, between 10% and 40%, respectively. Galvao et al. (Reference Galvao, Federico, De Vries and Schuenemann2013) using a weighted average calf value of $140 also reported a net return (US$) of between $1 and $3 per 1% increase in 21-d PR. However, the correlations of higher gains for lower 21-d PR and lower gains for higher 21-d PR reported by Galvao et al. (Reference Galvao, Federico, De Vries and Schuenemann2013), were not identified. This probably happened due to the specific reproductive programmes that were defined in that study. Giordano et al. (Reference Giordano, Kalantari, Fricke, Wiltbank and Cabrera2012) using a weighted calf value of $90, reported net return gains (US$) of between $2 and $1 per 1% increase in 21-d PR for the levels of 21-d PR with a range of 14% and 20%.
The number and availability of replacements (a function of calves produced) on a farm could impact the farm management with regard to replacement decisions. For example, in a closed herd, farmers having a large influx of replacements (because of improved reproductive performance) might decide to aggressively cull cows more to balance the relationship between replacement demand and supply. Indeed, there are some indications that farmers might perform more aggressively with more selective culling in a herd with better reproductive performance (Souza et al., Reference Souza, Carvalho, Shaver, Wiltbank and Cabrera2013). Also, farmers might try to balance the replacement demand and supply by decreasing the opportunities of breeding more eligible cows. This would imply the culling of non-pregnant cows sooner when the overall reproductive performance is better, as it was proposed by Giordano et al. (Reference Giordano, Kalantari, Fricke, Wiltbank and Cabrera2012). The baseline scenario in Giordano et al. (Reference Giordano, Kalantari, Fricke, Wiltbank and Cabrera2012) stopped breeding at 300 days postpartum (DIM; cut-off) in all reproductive programmes examined. As expected, superior reproductive programmes had a surplus of heifers and vice versa, with the highest surplus related to the best reproductive programme. They manipulated the cut-off in an attempt to mimic a reasonable farmer decision to balance demand and supply of replacements: decrease it (<300 DIM) if there was a surplus and increase it (>300 DIM) if there was a deficit. Simulations in Giordano et al. (Reference Giordano, Kalantari, Fricke, Wiltbank and Cabrera2012) showed that all reproductive programmes having a 21-d PR⩾16% had a surplus of heifer replacements when the cut-off was 300 DIM, which varied (for a herd size of 1000 adult cows) between 11 at 16% 21-d PR and 48 at 20% 21-d PR. These superior reproductive programmes were simulated to balance their heifer supply and demand resulting in about 281 and 235 DIM cut-off time for 16% and 20% 21-d PR, respectively. Interestingly, the overall net return (US$/cow per year) yet increased in all the cases in which a replacement heifer surplus originally existed (21-d PR⩾16% 21-d PR) and a more aggressive cut-off (lower cut-off DIM for services) was required to balance the heifer replacement demand and supply. The opposite was also true, lower performing reproductive programmes (<16% 21-d PR) that required an increased cut-off DIM to balance the heifer supply and demand, decreased even more their estimated net returns. It is clear that best reproductive performance farms could have additional means to further improve herd economic gains.
Replacement and mortality costs
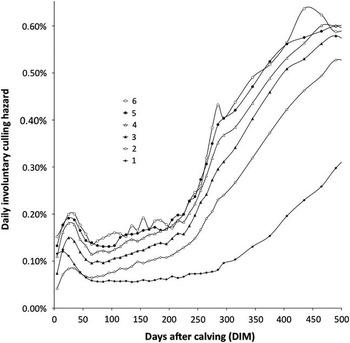
Replacement and mortality costs are an integral part of the dairy farm business. Sooner or later cows are replaced whether they are culled for involuntary reasons, culled for reproductive failure or died. Improved reproductive efficiency will ensure that fewer animals are culled earlier for reproductive failure. Cows becoming pregnant earlier have a significantly lower culling risk than their non-pregnant herd mates. Indeed, pregnant cows could have about 25% the culling risk compared with similar non-pregnant cows (De Vries et al., Reference De Vries, Olson and Pinedo2010). Involuntary culling risk follows a typical pattern (Figure 2) in which there is slightly higher culling risk early in lactation, decreases to a lower plateau after the transition period, increases slowly between mid and late lactation, and then increases dramatically later in lactation (>250 DIM). Therefore, it is clear that the longer the cow remains open in lactation, the higher the risk of the cow of being culled. Mortality risk follows a similar curve and can be expressed as a proportion of the culling risk (e.g. 17% of culling risk as used in Giordano et al., Reference Giordano, Kalantari, Fricke, Wiltbank and Cabrera2012) and, therefore, it has a similar pattern with reproduction. Earlier culling and mortality are expensive events in a dairy herd as these include the cost of replacing the animal. Immediate replacement is a standard assumption (De Vries, Reference De Vries2006; Giordano et al., Reference Giordano, Kalantari, Fricke, Wiltbank and Cabrera2012; Galvao et al., Reference Galvao, Federico, De Vries and Schuenemann2013). The transaction cost of a discarded animal is the difference between the cost of a replacement (heifer at or about at first calving) and the salvage value of the discarded cow. This cost was estimated in Cabrera (Reference Cabrera2012) to be about US$1300−US$496=U$804 for a cow weighing 596 kg live weight and receiving US$0.83/kg live weight salvage value. The cost of mortality is even higher as dead cows have no salvage value. In the above example, this would be US$1300. Using those values for culling and salvage, Cabrera (Reference Cabrera2012) reported a lower cost of culling and mortality of between $4 and $1 per 1% increase of 21-d PR between 10% and 40% 21-d PR, respectively. Consistently, Giordano et al. (Reference Giordano, Kalantari, Fricke, Wiltbank and Cabrera2012) using a replacement cost of $1302 and a salvage value of $1.16/kg live weight found a decrease in costs of replacement and mortality of between $4 and $3 for 1% change in 21-d PR between 14% and 18%, respectively. A much higher cost decrease was reported in Galvao et al. (Reference Galvao, Federico, De Vries and Schuenemann2013) of between $27 and $4 for each 1% change in 21-d PR. Results from Galvao et al. (Reference Galvao, Federico, De Vries and Schuenemann2013) were not consistent showing the trend of higher benefits with lower initial 21-d PR. For example, the greater gains occurred at between 19% and 20% 21-d PR. Possible causes of differences between studies can be attributed to: (1) substantially higher salvage value and replacement cost set in Galvao et al. (Reference Galvao, Federico, De Vries and Schuenemann2013) at US$1.65/kg live weight and US$1600/heifer, respectively, and (2) significant differences in probabilities used to simulated culling and mortality. Galvao et al. (Reference Galvao, Federico, De Vries and Schuenemann2013) used a fixed daily culling and death rate of 0.1% and 0.05% for the first 60 DIM and 0.03% and 0.0076%, for the remainder of the lactation, respectively. Cabrera (Reference Cabrera2012) and Giordano et al. (Reference Giordano, Kalantari, Fricke, Wiltbank and Cabrera2012) implemented culling and mortality rates following daily changing culling and mortality risks, distinguishing lactations and reduced risks for pregnant cows following similar curves to those presented in Figure 2.
Daily involuntary culling risks for open cows by parity in 727 large US herds. Extracted from De Vries et al. (Reference De Vries, Olson and Pinedo2010).

Reproductive costs
Reproductive costs can be defined as all those management costs incurred with the purpose of getting cows pregnant. Those would normally include labour for OD or pro-rated investment on OD devices, labour for synchronisation treatment, cost of hormones, labour for insemination, cost of semen and cost of first and repeated pregnancy diagnosis tests. With the exception of repeated pregnancy diagnosis, all other costs only apply to presumed non-pregnant and breeding eligible cows and are lower when they shorten the inter-breeding interval (IBI). Therefore, improving reproductive efficiency without additional investments will reduce reproductive costs per cow and per herd. However, improved reproductive efficiency may require additional investments. The relationship between additional investments and cost of reproduction seems to be inconsistent. It will depend on the economic association between the gains from reproductive efficiency and the amount of additional investment required to achieve these gains. All the costs listed above were included in both Giordano et al. (Reference Giordano, Kalantari, Fricke, Wiltbank and Cabrera2012) and Galvao et al. (Reference Galvao, Federico, De Vries and Schuenemann2013) studies. In both studies prices for PGF2α and GnRH hormones were similar between US$2.3 and US$2.65 and US$2.4 and US$2.6/cow treated, respectively. Also the labour cost was similar at US$15/h. However, the cost incurred in labour for OD and hormone treatment differed because this was set on a per cow basis in Galvao et al. (Reference Galvao, Federico, De Vries and Schuenemann2013), whereas it depended on the population dynamics in the study of Giordano et al. (Reference Giordano, Kalantari, Fricke, Wiltbank and Cabrera2012). The cost of pregnancy diagnosis that was set at US$3/pregnancy diagnosis in Galvao et al. (Reference Galvao, Federico, De Vries and Schuenemann2013), whereas it was $105/h in Giordano et al. (Reference Giordano, Kalantari, Fricke, Wiltbank and Cabrera2012). Finally, the cost of AI was set to US$15 in Galvao et al. (Reference Galvao, Federico, De Vries and Schuenemann2013), whereas it was set to $10 in Giordano et al. (Reference Giordano, Kalantari, Fricke, Wiltbank and Cabrera2012). Results of these studies show increases and decreases in the overall reproductive costs (US$/cow per year) as a response to different reproductive programmes and different reproductive performances. Overall, changes per 1% increase in 21-d PR varied between −$4 and $4/cow per year. It is important to note that important differences in reproductive programmes were defined in these studies and, therefore, it is not possible to generalise these impacts, which would depend on the interaction among current reproductive programme, proposed changes and farm-specific conditions including productive and economic parameters. A tool, based on the study of Giordano et al. (Reference Giordano, Kalantari, Fricke, Wiltbank and Cabrera2012) that performs farm-specific assessments within a daily Markov chain structure − the Wisconsin-Cornell Dairy Repro tool − is available at the University of Wisconsin Dairy Management Website (http://DairyMGT.info) and could be used effectively to perform these assessments according to farm-specific conditions in a rapid and efficient way.
OD, synchronisation programmes or a combination
Most high-yielding herds in the United States use a combination of OD and some type of synchronisation or ovulation control programme (TAI). Caraviello et al. (Reference Caraviello, Weigel, Fricke, Wiltbank, Florent, Cook, Nordlund, Zwald and Rawson2006) reported that in large and high yielding commercial US dairy herds, 78% of farms used OD and 87% used hormonal synchronisation. A common reproductive management practice is to follow a synchronisation protocol and perform inseminations at detected oestrus in between-timed services. Giordano et al. (Reference Giordano, Fricke, Wiltbank and Cabrera2011) included OD or TAI only programmes as the main core of their analyses, but offered sensitivity analyses of the impacts of their combinations. Two other recent studies by Giordano et al. (Reference Giordano, Kalantari, Fricke, Wiltbank and Cabrera2012) and Galvao et al. (Reference Galvao, Federico, De Vries and Schuenemann2013) examined commonly used reproductive protocols that included Presynch-Ovsynch for first AI (Moreira et al., Reference Moreira, Orlandi, Risco, Mattos, Lopes and Thatcher2001) followed by Ovsynch protocol for re-synchronisation (Pursley et al., Reference Pursley, Mee and Wiltbank1995). Although both studies included the option of a TAI only programme and Galvao et al. (Reference Galvao, Federico, De Vries and Schuenemann2013) also analysed a pure OD programme, the core of the analyses in both studies was focused on the combination of TAI and OD.
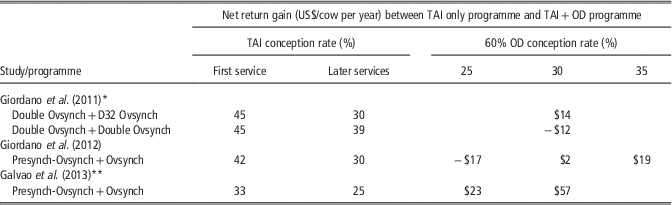
In Giordano et al. (Reference Giordano, Fricke, Wiltbank and Cabrera2011) three reproductive programmes were analysed. Two were TAI only and the other was OD only. One of the TAI programmes was Double-Ovsynch followed on day 32 (D32) by Ovsynch re-synchronisation and the other TAI was a Double-Ovsynch followed by Double-Ovsynch re-synchronisation. Conception rate (CR) for the Double-Ovsynch programme was set at 45% for the first service and 39% for subsequent services, whereas Ovsynch was set at 30% CR for subsequent services (Table 2). CR for the only OD programme was set at 33% for the first service and 30% for later services. Results showed that the TAI only programmes had higher net return (US$/cow per year) than the OD programme: $45/cow per year greater for the programme using Ovsynch for the second and later services and $69/cow per year greater for the programme only using Double-Ovsynch (best economic programme in the study). Such study provided a sensitivity analysis of between 10% and 80% OD at 30% CR in between TAI for second and subsequent. Interestingly, the net return of the reproductive programme was favoured when combining TAI with OD when the CR of second and subsequent TAI was similar to the CR following OD (30%, Ovsynch). The opposite was also true the net return of the reproductive programme was poorer when combining TAI with OD when the CR following TAI was greater than that following OD (39%, Double-Ovsynch). At a reasonable OD rate of 60%, a gain of about $14/cow per year in the Ovsynch re-synchronisation programme and a loss of about $12/cow per year in the Double-Ovsynch re-synchronisation programme would be expected when including OD (30% CR) in the TAI programme (Table 1).
Economic effect of combining TAI for synchronisation to ovulation with OD

TAI=timed artificial insemination; OD=oestrous detection; CR=conception rate.
* OD included only after first TAI.
** Mean values of Monte Carlo simulation outcomes for TAI conception rates and approximated 60% OD conception rates from average conception rate for all services: 24.3% for 25% and 29.5 for 30%. TAI only programme had 95% compliance, combined programme with approximated 25% CR had 85% OD accuracy and 85% TAI compliance, and combined programme with approximated 30% CR had 95% OD accuracy and 95% TAI compliance.
Giordano et al. (Reference Giordano, Kalantari, Fricke, Wiltbank and Cabrera2012) set a baseline of 100% TAI reproductive programme with 42% CR for first TAI and 30% for subsequent TAI. They then studied the implementation of OD before and after the first TAI at three levels of performance, 25%, 30%, 35% CR under variable levels of OD rate (30% to 80% at 10% intervals). Also, CR was assumed to decrease 2 percentage for every 10 percentage increase in OD after 30% before first TAI and to have 2 percentage less after 50% OD after first TAI. Compared with the pure TAI programme, combined programmes having 25% CR for OD had lower economic values in all cases. Combined programmes having 30% CR for OD had comparable or slightly better economic values, and combined programmes having 35% CR for OD had much better economic values. With 30% and 35% OD and CR, respectively, combined programmes outperformed the TAI only programme with higher values at increased levels of OD. The study concluded that with a reasonable OD rates of 50% to 60% (Lima et al., Reference Lima, Rivera, Narciso, Oliveira, Chebel and Santos2009; Chebel and Santos, Reference Chebel and Santos2010), it would be recommendable to use OD only if the expected CR was greater than 30% (greater than the expected TAI CR). In agreement with previous findings (Giordano et al., Reference Giordano, Fricke, Wiltbank and Cabrera2011), that study also found that inseminating cows detected in oestrus before completion of a synchronisation protocol and expecting a low CR has a negative effect on the overall reproductive and economic performance. This occurs because cows completing synchronisation have a better chance of becoming pregnant than those inseminated at oestrus and not becoming pregnant are subject to a longer IBI until they are re-enrolled in a subsequent synchronisation programme. Combined programmes with 35% CR to OD outperformed pure TAI by $10 and $32/cow per year, with an improved value of $19/cow per year at 60% level of OD (Table 2). Combined programmes with 30% CR to OD outperformed TAI only by $1 to $10/cow per year (Table 2). Combined programme with 25% CR to OD underperformed relative to TAI only by −$15 to −$8/cow per year with a decline value of −$17/cow per year at 60% level of OD (Table 2). In all cases, cows inseminated at oestrus after first TAI had a greater chance of conceiving and shorter IBI than the cows completing the synchronisation protocol. Therefore, it can be argued that the estimated net return gain would have been even greater if the introduction of OD had been applied after the first TAI (Giordano et al., Reference Giordano, Fricke, Wiltbank and Cabrera2011).
Galvao et al. (Reference Galvao, Federico, De Vries and Schuenemann2013) studied three types of reproductive programmes, OD only at two levels of OD rates (40% and 60%), TAI only, and a combination of both. The authors also introduced a factor for the accuracy in the OD (85% and 95%) and a factor of compliance – level of fulfilment − with the synchronisation protocol (85% and 95%). They consistently found that combining TAI with OD was always better than either TAI or OD alone and that both the accuracy of OD and compliance to TAI were important factors in delivering overall reproductive performance and, therefore, critical for the expected net return gains. They concluded that having high accuracy to OD or high compliance to TAI might be more profitable than combining both methods. Galvao et al. (Reference Galvao, Federico, De Vries and Schuenemann2013) concluded that the reproductive programme that produced best economic gains was a combination of OD and TAI with a 60% OD, 95% OD accuracy and 95% TAI compliance, which produced a $57/cow per year greater net return than the TAI only at the same level of compliance (Table 2) and a $30/cow per year greater net return than the OD only at the same level of OD and OD accuracy. The worst reproductive programme was the TAI only at 85% compliance that had $166/cow per year less net return than the best programme.
Being aware that the cost of hormones for reproductive programmes could vary largely among places, we conducted a simple sensitivity analysis using the decision support tool based on Giordano et al. (Reference Giordano, Kalantari, Fricke, Wiltbank and Cabrera2012). We tested the impact of higher hormonal prices in Europe compared with the United States. We set the prices of hormones ($/dose) to $2.4 for PGF2α and $2.3 for GnRH to represent US conditions and to $7.0 for PGF2α and $9.6 for GnRH to represent European conditions. All other variables were kept equal. We found that total reproductive costs incremented $19.5/cow per year and, therefore, the value of the reproductive programme decreased an equivalent amount. We concluded that, on average, $1 increment in hormones costs decreased the value of the reproductive program by $3.28/cow per year. It is expected some level of interaction of these costs, reproductive programme, farm characteristics and market prices. Consequently, it is advised to use decision support tools such as the Wisconsin-Cornell Dairy Repro tool (available at the University of Wisconsin Dairy Management Website; http://DairyMGT.info) to perform analysis that are more relevant to specific conditions.
New reproductive technologies such as chemical test for pregnancy
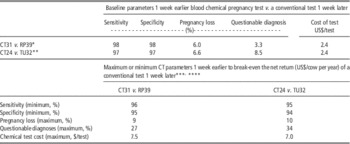
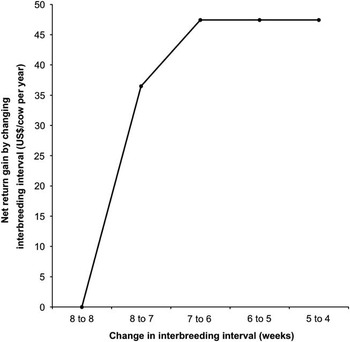
Having shorter IBI in non-pregnant inseminated cows would increase the economic value of a reproductive programme. One constraint to faster re-breeding is the time period needed to correctly diagnose pregnancy (or non-pregnancy) after an insemination. Overall, the shorter the IBI, the higher the economic gain would be (Giordano et al., Reference Giordano, Fricke and Cabrera2013). Using a Presynch-Ovsynch protocol for first TAI and an Ovsynch protocol for subsequent TAI, Giordano et al. (Reference Giordano, Fricke and Cabrera2013) demonstrated that the net return increased (US$) between $37 and $47/cow per year for each week shorter the IBI when comparing IBI between 8 and 4 weeks (Figure 3). These important economic gains due to decreased IBI can only be realised when cows are detected early enough as non-pregnant and are quickly re-submitted to the next resynchronisation. An important advantage of blood or milk-based chemical tests for pregnancy diagnosis is that these could potentially be effective when used earlier than conventional methods (e.g. less than 30 days after AI). Nonetheless, an earlier pregnancy diagnosis test would have two important drawbacks: (1) it could be less accurate in diagnosing pregnancy than conventional methods and (2) detecting very early pregnancies implies that a larger proportion of pregnancies will be subsequently lost, which is a natural occurrence (Vasconcelos et al., Reference Vasconcelos, Silcox, Lacerda, Pursley and Wiltbank1997). Regarding the first drawback, compared with conventional methods of rectal palpation or transrectal ultrasound, early chemical blood- or milk-based tests could diagnose a pregnant cow as non-pregnant (false negative – issue of sensitivity) and a non-pregnant cow as pregnant (false positive – issue of specificity). In addition, an early chemical test would have a number of tests that are inconclusive (questionable diagnoses). A week earlier blood chemical test could have between 2% and 3% lower sensitivity, 2% and 3% lower specificity and between 3% and 9% more questionable diagnosis than conventional methods such as rectal palpation or transrectal ultrasound a week later (Giordano et al., Reference Giordano, Fricke and Cabrera2013). These inaccuracies have economic implications. Lower sensitivity in diagnosing pregnant cows as non-pregnant could be very costly if these cows are re-submitted to a re-synchronisation programme that includes the use of PGF2α, which would induce corpus luteum regression and pregnancy loss, which would be a costly event (see next section). Lower specificity affects the net return because cows diagnosed as pregnant, but being non-pregnant, will likely result in further loss of time before the next breeding opportunity and therefore, will have a longer IBI. Furthermore, those cows with inconclusive results will incur additional diagnoses test costs and perhaps increased IBI. All those possible scenarios were accounted for in the study of Giordano et al. (Reference Giordano, Fricke and Cabrera2013).
Regarding the second limitation, completing a test a week earlier could positively detect between 6% and 6.6% pregnancies that will subsequently be lost within a week (Vasconcelos et al., Reference Vasconcelos, Silcox, Lacerda, Pursley and Wiltbank1997). While this is a documented natural occurrence (more embryonic losses earlier in pregnancy), it affects the value of an earlier pregnancy test. In Giordano et al. (Reference Giordano, Fricke and Cabrera2013), a 1 percentage point increase in early pregnancy losses was economically equivalent to 1% less specificity of the test. The authors argued that from the economic standpoint, it does not make a difference if the test misdiagnosed a non-pregnant cow as pregnant or the cow was correctly diagnosed as pregnant, but lost the pregnancy soon thereafter.
Giordano et al. (Reference Giordano, Fricke and Cabrera2013) compared two potential scenarios: (1) blood chemical test at 31 days for a 35-day IBI (CT31) v. a rectal palpation test at 39 days for a 42 IBI (RP39) and (2) blood chemical test at 24 days for a 28-day IBI (CT24) v. a transrectal ultrasound at 32 days for a 35 days IBI (TU32). Consistent with a previous report from Ferguson and Galligan (Reference Ferguson and Galligan2011), Giordano found that earlier chemical blood test could be an economic worthwhile alternative (Table 3). Using plausible blood chemical test parameters of sensitivity, specificity and questionable diagnoses, plausible level of herd early pregnancy loss and industry price per test (Table 3), Giordano et al. (Reference Giordano, Fricke and Cabrera2013) reported that at 50% OD rate the net return of a week earlier CT was US$9/cow per year better than a week later RP (CT31 v. RP39) or a week later TU (CT24 v. TU32). Furthermore, a sensitivity analysis showed that, holding all the other parameters at baseline levels, the CT31 would still be a superior economic alternative to the RP39 when the sensitivity is greater than 96%, specificity is greater than 95%, early pregnancy losses are less than 9 percentage points, questionable diagnoses are less than 27% and the price of a CT is less than $7.5/test (Table 3). Similarly, the CT24 would still be an economically superior alternative to the RP32 when the sensitivity is greater than 95%, specificity is greater than 94%, early pregnancy losses are less than 10%, questionable diagnoses is less than 34% and the price of a CT is less than $7/test (Table 3).
Baseline parameters to compare blood CT for pregnancy diagnosis with conventional pregnancy diagnosis of RP and TU and their maximum or minimum values to break-even their net returns (US$/cow per year) according to data reported by Giordano et al. (Reference Giordano, Fricke and Cabrera2013)

CT=chemical test; RP=rectal palpation; TU=transrectal ultrasound; IBI=inter-breeding interval.
* Blood CT performed at 31 days for an IBI of 35 days compared with a RP test performed at 39 days for an IBI of 42 days.
** Blood CT performed at 24 days for an IBI of 28 days compared with a TU test performed at 32 days for an IBI of 35 days.
*** Sensitivity, specificity, pregnancy losses and questionable diagnoses in relation to RP (CT31 v. RP39) and to TU (CT24 v. TU32) considering the conventional test (RP or TU) to be the ‘gold standard’.
**** Break-even value found when all other parameters are set to baseline values. Equations from Giordano et al. (Reference Giordano, Fricke and Cabrera2013) are: CT31 v. RP 39 (CT24 v. TU32)=−795 (−638)+535 (450) Sensitivity %+305 (253) Specificity %−305 (253) Pregnancy losses %−39 (34) Questionable diagnosis %−1.8 (1.9) US$ Cost of CT test.
The value of a cow and associated values of new pregnancy, cost of a pregnancy loss and cost of a day open
An important relationship exists between the value of a cow and the cow’s reproductive decisions. Even though farm mangers would make reproductive programme decisions based on herd reproductive performance, opportunities exist for management strategies at the cow level. For example, the number of inseminations allowed or the quality of the semen used for a high producing cow could be greater or better than a lower producing cow. Aside from the possible practical management implementation that would need to be carefully considered on a farm-by-farm basis, estimating and applying the concept of the value of a cow and its associated values of new pregnancy, cost of a pregnancy loss and cost of a day open is critical for improved decision making and, consequently, for greater economic value of reproductive performance.
The value of a cow
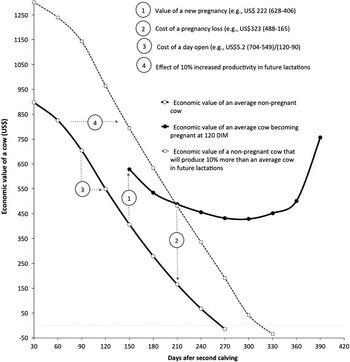
In simple terms, the value of a cow is the expected long-term net return of the cow compared with an imminent replacement. Therefore, factors such as: (1) cow’s productivity level in relation to herd mates, (2) replacement’s genetic improvement in relation to herd mates and (3) current conditions of the evaluated cow all play a critical role in determining the value of the cow for a particular farm at a specific cow state. The value of a cow can also be expressed as RPO (De Vries, Reference De Vries2006). The value of a cow can be calculated using Markov chains (Cabrera, Reference Cabrera2012) and the RPO using dynamic programming (De Vries, Reference De Vries2006). Either way, results are consistent indicating that: (1) the value of a non-pregnant cow decreases from its maximum in early postpartum (e.g. <30 DIM) to negative values in late lactation (e.g.>270 DIM), (2) it increases to a higher value when the cow becomes pregnant and remains higher than its contemporary non-pregnant mates and (3) re-aligns to a similar value at the end of the gestation in spite of when the pregnancy occurred during the lactation (not shown). Obviously, the value of a cow responds to herd productive and reproductive variables such as culling risk or herd productivity level and also to economic variables such as milk price or replacement costs. Nonetheless, the most important factors in determining the value of a cow are the cow’s expected productive performance and the replacement’s expected genetic value. There is certainly an interaction between the cow’s productivity, the replacement’s genetic value and herd structure, which determine the value of a cow. This value has been normally used to help farmers and managers in the decisions to keep (positive) or replace (negative) cows. This value could also be used effectively and efficiently for reproductive decisions complementing already established herd-level reproductive programmes. Figure 4 shows that the value of a non-pregnant cow varies greatly. For a herd’s average cow, it will vary between $900 in early lactation to $70 at 240 DIM and to negative after 270 DIM. Consequently, decisions for the same cow could dramatically change at different times. Decisions will depend on those values and their relationship with the cost benefit that the farmer would estimate from a specific reproductive management strategy. A valid question from a herd manager would be, for example, should an investment still be made in reproduction if the value of a cow is only $70? Another valid question would be: should a different reproductive management strategy be followed depending on the value of the cow? Certainly, answers to these questions require herd managerial skills, but individual cow value estimates could help perform best-informed decisions.
Economic gain of decreasing inter-breeding interval (IBI) in reproductive programme compared to 8 weeks IBI. Adapted from Giordano et al. (Reference Giordano, Fricke and Cabrera2013) assuming a 60% oestrous detection (OD) on a combined timed artificial insemination (TAI) and OD programme using Presynch-Ovsynch for first TAI and the Ovsynch protocol for resynchronisation of ovulation for second and greater TAI services. Conception rate was set at 35% for OD, 34% for first TAI and 28% for second and greater TAI services.

The value of a new pregnancy, the cost of a pregnancy loss and the cost of a day open
Estimates of economic value of a cow or the RPO can be effectively used to deduct the value of a new pregnancy, the cost of a pregnancy loss and the cost of a day open. The value of a new pregnancy in a specified time period (e.g. at 30 days in pregnancy) is the difference of the value of a 30-day pregnant cow and the value of the same cow, but not pregnant (Figure 4). The cost of a pregnancy loss is the difference in the value of the cow losing the pregnancy (non-pregnant) and the value of the same cow remaining pregnant (Figure 4). The cost of a day open is the difference in the value of a non-pregnant cow between an earlier and a later day in lactation divided by the number of days in that period. In the examples presented in Figure 4, the value of a 30-day gestation new pregnancy at 120 DIM for an average cow was calculated as the difference between: 628−406=US$ 222, the cost of 90-day gestation pregnancy loss occurring at 210 DIM for an average cow was the difference between: 488−165=US$ 323, and the cost of a day open for an average cow between 90 and 120 DIM was calculated as: (704−549)/(120−90)=US$ 5.2/day. Also, inform Figure 4 note that the effect of 10% expected productivity of a cow had important impacts in the economic value of a cow, shifting the curve to the right. The same calculated economic values (at the same states) for the 10% higher producing cow was: value of a new pregnancy=US$456, cost of a pregnancy loss=US$491 and cost of an extra day open=US$6.0. It is also clear that it is justifiable to give more breeding service opportunities to the 10% higher producing cow. It would justify breeding the higher producing cow at least until 300 DIM (value is still positive at 300 DIM) compared with less than 270 DIM for the average cow (value becomes negative even before 270 DIM; Figure 4).
Estimated economic value of an average producing cow (US$) remaining non-pregnant (empty circles) or becoming pregnant at 120 days postpartum (DIM; solid circles) and economic value of a 10 percentage points higher than average producing (in future lactations) cow (empty squares). Calculations performed using the tool Economic Value of a Dairy Cow available at http://DairyMGT.info/tools and described in Cabrera (Reference Cabrera2012).

Knowing the specific value of a cow, its pregnancy value, its cost of pregnancy loss and the cost of an additional day open, would provide farmers with a better guide in the quest for improved economic efficiency related to herd reproductive management. Since the value of the whole herd or the herd value is the combination of the individual values of the cows on the herd according to the herd structure (Kalantari and Cabrera, Reference Kalantari and Cabrera2012), the rationale of improving the herd value by cow-specific decisions will depend on making the best decisions for individual cows. For example, giving extra attention to cows that have a higher value by becoming pregnant will improve the whole herd value and therefore, the farm profitability will increase. However, these decisions would need to be performed within an existing herd’s reproductive programme and will depend heavily on the management options available for individual cows. The cost of a pregnancy loss is expensive and is higher as gestation progresses. Following the concept of herd value, keeping the pregnant cows pregnant with an emphasis on later gestation status will certainly increase the net return of reproductive programmes. Finally, the cost of a day open is something that could be avoided as much as possible in order to increase herd net returns. Indeed, herd average days open is a common indicator of reproductive performance that is inversely related to profitability. At the cow level, it is possible to estimate dynamically the changing cost of a day open throughout lactation. In general, the lower the days open for a cow, the better. Nonetheless, if a farm needs to prioritise and has the means to do so, cows with a higher cost of day open could be singled out for reproductive treatment.
Tools to calculate the RPO or the value of a cow exist and are readily available for dairy herd decision makers. Some examples for RPO calculations are the University of Florida DairyVIP tool (http://dairy.ifas.ufl.edu/tools/) or the University of Wisconsin Retention Pay-Off calculator (http://dairymgt.uwex.edu/tools.php). An example of a tool to perform calculations related to the value of a cow is the University of Wisconsin Economic Value of a Dairy Cow (http://dairymgt.uwex.edu/tools.php).
Conclusions
Improved reproductive performance increases overall herd economic net returns. Economic factors that contribute to it are higher milk sales, calf sales, lower replacement costs and lower relative reproductive costs. Most high-yielding TMR dairy farms use a combined approach that includes synchronisation protocols and OD interventions in their reproductive programmes. The reproductive performance on these farms can be measured and compared using the standard 21-day PR, which captures the interacting reproductive performance of these combined programmes. With an observed 21-day PR of between 10% and 40%, the economic net gain increases as the pregnancy rate increases. Within those reproductive programmes, the use of blood chemical pregnancy diagnoses 1 week earlier that a conventional pregnancy diagnosis, can be economically effective as long the test is more than 94% accurate and the herd records indicate that the early pregnancy losses do not exceed 10%. Using the economic value of a cow or its equivalent RPO to perform individual cow fine-tuning of reproductive decisions within defined herd reproductive programmes would improve reproductive performance and in turn net returns. Decision support tools to evaluate the economic outcomes of reproductive programmes and cow-level reproductive decisions in high-yielding dairy farms are available at the University of Florida (http://dairy.ifas.ufl.edu/tools/) and at the University of Wisconsin (http://dairymgt.uwex.edu/tools.php).
Acknowledgements
This project was supported by Agriculture and Food Research Initiative Competitive Grant No. 2010-85122-20612 from the US Department of Agriculture National Institute of Food and Agriculture (Washington, DC). This research was also supported by Hatch Project No. WIS01577 to V.E.C.