I. INTRODUCTION
Semiconductors can be functionalized via transition metal doping to form the dilute magnetic semiconducting (DMS) phase, Reference Munekata, Ohno, von Molnar, Segmüller, Chang and Esaki1 with Mn serving as a common magnetic dopant in a number of semiconducting hosts. The technological attraction of the DMS phase is that it could afford electric-field control over the magnetic response, if coupling between Mn ions occurs via holes whose concentration can be gate-modulated. Extensive work has been done on group IV DMS materials since evidence for carrier-mediated ferromagnetic order in epitaxial Mn-doped Ge/Ge (001) was first reported in 2002 by Park et al., Reference Park, Hanbicki, Erwin, Hellberg, Sullivan, Mattson, Ambrose, Wilson, Spanos and Jonker2 who demonstrated T c increasing linearly with the Mn concentration from 25 to 116 K. Since then, many other groups have investigated the synthesis of Mn doped-Ge using a variety of techniques. The most thorough examination has been for homoepitaxial growth of Mn-doped Ge films on Ge (001) substrates. Reference Devillers, Jamet, Barski, Poydenot, Bayle-Guillemaud, Bellet-Amalric, Cherifi and Cibert3–Reference Gokhale and Abbaschian11 Given the nearly complete lack of solubility of Mn in Ge, Reference Zeng, Erwin, Feldman, Li, Jin, Song, Thompson and Weitering12 formation of precipitate-free Mn x Ge1−x DMS requires low growth temperatures, although reports differ on the upper bound temperature due to differences in other experimental conditions, such as deposition rate. However, 180 °C seems to be a rough upper bound on growth temperature to produce a metastable solid solution of Mn in Ge, albeit often with a spatially inhomogeneous Mn distribution. Reference Devillers, Jamet, Barski, Poydenot, Bayle-Guillemaud, Bellet-Amalric, Cherifi and Cibert3 Growth temperatures providing excessive Mn mobility on the surface or in the bulk lead to intermetallic phase formation. The most commonly observed secondary phases are Mn5Ge3 (“η” phase) and Mn11Ge8, which are both ferromagnetic. Mn5Ge3 with a T c of 296 K Reference Zeng, Erwin, Feldman, Li, Jin, Song, Thompson and Weitering12 and Mn11Ge8 with a T c of 274 K Reference Yamada, Maeda, Usami and Ohoyama13 can confuse interpretation of magnetic measurements, affect transport properties in Ge:Mn DMS thin films, and are generally undesirable for device applications that seek to exploit DMS behavior. Reference Pinto, Morresi, Ficcadenti, Murri, D’Orazio, Lucari, Boarino and Amato10
Much less work has been done on magnetic doping of Ge quantum dots (QDs) that self-assemble via heteroepitaxial growth on Si. QDs might enhance magnetism through carrier confinement, and DMS dots, in conjunction with directed self-assembly techniques, could enable formation of nanomagnetic arrays for logic, e.g., as dilute magnetic quantum cellular automata. Reference Imre, Csaba, Ji, Orlov, Bernstein and Porod14 DMS strain-induced quantum dots pose a particular challenge to be synthesized, since Mn incorporation in Ge far above chemical equilibrium requires low growth temperatures and low surface diffusivity, whereas quantum dot self-assembly invariably requires elevated growth temperatures and high surface diffusivity.
Evidence was recently presented for room-temperature dilute ferromagnetism in Mn-doped Ge QDs Reference Xiu, Wang, Kim, Hong, Tang, Jacob, Zou and Wang15 formed by epitaxial self-assembly. This remarkable result motivates further research in this area. To gain further insight into the growth process and a better understanding of the magnetic properties, we recently explored the influence of Mn concentration on morphological evolution and magnetism of heteroepitaxial Ge1−x Mn x QDs grown by molecular beam Ge1−x Mn x films, x = 0 to 0.10. Reference Kassim, Nolph, Jamet, Reinke and Floro16 Mn has a marginal affect on the QD morphology, but secondary phase formation is observed at Mn contents ≥5 at.%. We also performed a detailed transmission electron microscope study of the spatial distribution of Mn in a Ge QD sample, where the average Mn:Ge ratio was 0.021. Formation of Mn solid solutions in the Ge QDs was verified, with no indication of nanometer-scale Mn clustering within QDs, despite the well-known tendency for Mn to undergo a spinodal-like decomposition to form enriched 3–5 nm clusters in Ge at much lower growth temperatures. Reference Kassim, Nolph, Jamet, Reinke and Floro17 This study further revealed the kinetic pathway to second phase formation, where Mn segregates in the Si substrate beneath Ge superdome islands, initially as a metastable phase, but transforming to a silicide as Mn further accumulates.
In this paper, we examine second phases formed in Mn-rich films, of average composition Mn0.1Ge0.9, during QD self-assembly by molecular beam epitaxial codeposition. We show that a variety of second phase precipitates arise by heterogeneous nucleation on quantum dots and then serve to scavenge the Mn from the surrounding film. The precipitate phases are dominated by interactions between the Mn and the Si substrate, essentially bypassing germanide phase formation.
II. EXPERIMENT
The 7.5 ML Ge0.9Mn0.1/Si (001) QDs were grown by MBE using ultrahigh vacuum magnetron cosputtering at 450 °C and Ge flux of 0.1 Å/s. Details are described elsewhere. Reference Kassim, Nolph, Jamet, Reinke and Floro17 Global Mn content in the film was determined by secondary ion mass spectrometry (SIMS) using Cs+ ions at 5 keV and 60° off-normal incidence. The SIMS sample was first capped with 100-nm amorphous Si to create steady-state sputtering conditions. The total Ge integrated over depth was 4.42 × 10¹⁵ at./cm2, whereas the total Mn was 4.68 × 10¹⁴ at./cm2, which gives a nominal composition of 10.6 at.% Mn in Ge (but we show below that Mn partitions into the Si as well). In addition, high-resolution Rutherford backscattering spectroscopy (RBS) measurements were performed as a complementary method to determine Mn content and Ge film thickness, with reasonable agreement found with SIMS. Surface morphology was characterized ex situ using atomic force microscopy (AFM) in tapping mode. Bright-field TEM, scanning transmission electron microscopy (STEM), and high-angle annular dark-field imaging were used, along with local compositional analysis using energy dispersive x-ray spectroscopy (EDX). Samples for TEM and STEM were prepared by standard wedge polishing techniques followed by Ar ion milling. STEM and high resolution TEM (HRTEM) were performed at 300 kV was used for STEM and high-resolution TEM (HRTEM) imaging. Magnetic properties were measured using a superconducting quantum interference device with an external field parallel to the film plane. The detailed description and results of the magnetic measurements have already been reported elsewhere Reference Kassim, Nolph, Jamet, Reinke and Floro16,Reference Nolph18 but will be discussed here in the context of the observed phases and compositions.
III. RESULTS
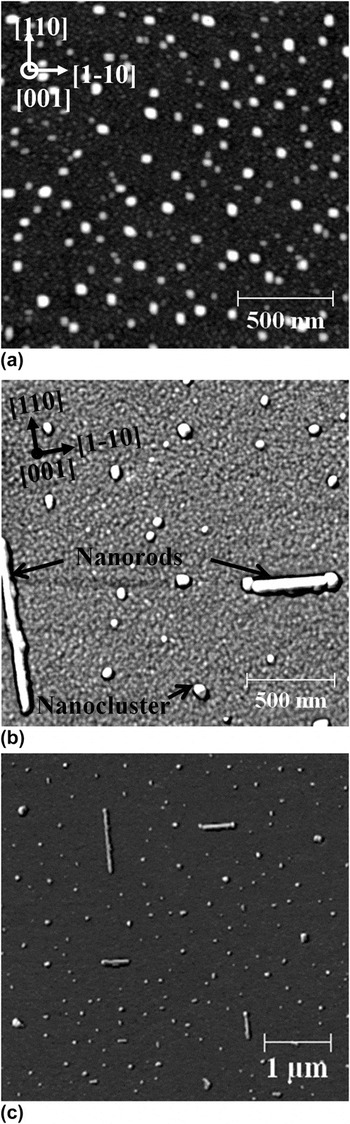
Figure 1(a) shows the morphology of a control sample, where typical strain-induced Ge QD morphologies, known as huts, domes, and superdomes, were grown with no added Mn flux (0 at.% Mn). Reference Kassim, Nolph, Jamet, Reinke and Floro16 With the addition of a Mn flux to obtain a nominal composition of 10 at.% Mn, Ge QDs are still observed in a film with 7.5 ML Ge [see Fig. 1(b)]. The QD size and density is similar to the 0 at.% Mn sample, but the pyramid shape is degraded, in agreement with a recent STEM study. Reference Nolph18 New morphological features are also clearly observed in the 10 at.% Mn sample, such as lateral nanorods and more equiaxed nanoclusters [see Figs. 1(b) and 1(c)]. The nanoclusters can be distinguished from Ge QDs by careful examination of their shapes. We show below that these are intermetallic phases. The nanorods have typical 80-nm width, 15-nm height, and 200–950 nm length. Inspection of the AFM images shows that there is a tendency for the intermetallic nanorods and nanoclusters to be conjoined with Ge super/dome clusters. Nanoclusters are more common than nanorods, but both are present over extended regions of the sample. At larger AFM scan sizes, it becomes apparent that the rods have a denuded zone around them, where other intermetallic nanostructures do not form.
AFM images of 7.5 ML Mn x Ge1−x /Si (001) grown at T g = 450 °C. (a) x = 0. The scan shows the standard wetting layer-hut-dome-superdome morphologies; (b) and (c) x = 0.10. Nanorods and nanoclusters are observed in addition to the Ge QDs.

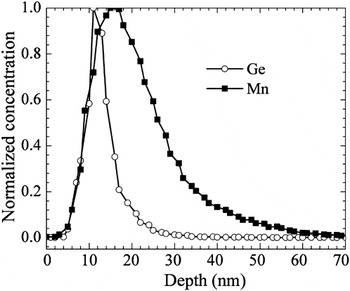
Figure 2 shows the normalized distributions of Mn and Ge measured with SIMS as a function of depth in the film with 10% Mn flux. Integration of the calibrated signals gives a total Ge amount of 4.42 × 10¹⁵ at.%/cm2 (7.0 ML) and a total Mn amount of 4.68 × 10¹⁴ at.%/cm2, for a nominal composition of 10.6 at.% Mn. The broadening of the Ge peak, relative to the nominal “planar” Ge layer thickness is mostly associated with overall instrumental depth resolution during sputter profiling. The peak of the Mn distribution lies 5 nm deeper than the Ge peak, and the Mn peak is extensively broadened compared to the Ge peak, with full-width half-maxima of 13 and 6 nm, respectively. The much larger Mn peak width, and the peak offset with respect to the surface, clearly indicates that Mn has extensively intermixed with the Si substrate.
Comparison of SIMS depth distributions of Ge and Mn. These distributions have both been normalized to their respective peak values to better demonstrate the depth dependences for each element. Actual Ge and Mn contents are given in the text.

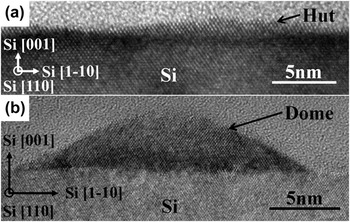
In Fig. 3, cross-sectional micrographs show typical Ge pyramidal hut and dome islands. These images verify that typical Ge QD morphologies, with coherent interfaces and properly faceted surfaces, still grow largely unperturbed, even in the presence of a large Mn flux. The islands exhibit sizes similar, but generally smaller, than those measured by AFM, indicating that tip convolution affects the AFM images.
Bright-field cross-sectional HRTEM of Mn0.10Ge0.90/Si (001) sample along the [1-10] zone axis showing typical (a) pyramidal QD and (b) coherent dome QD.

More than 30 equiaxed nanoclusters were examined in plan-view or cross-sectional TEM, in various levels of detail. General trends albeit based on limited statistics associated with TEM suggest that all nanoclusters appear to be silicides rather than germanides, most are conjoined with Ge QDs, and all penetrate into the Si substrate. While nominal epitaxial orientation relationships (ORs) were ascertained in several cases, no edifying trends were observed, and hence we do not report ORs for the nanoclusters here. To obtain a more statistically valid assessment of phases and ORs, a detailed x-ray diffraction analysis, like that performed by Lechner et al., needs to be carried out. Here, we focus on two nanoclusters (and the nanorods) examined in significant detail.
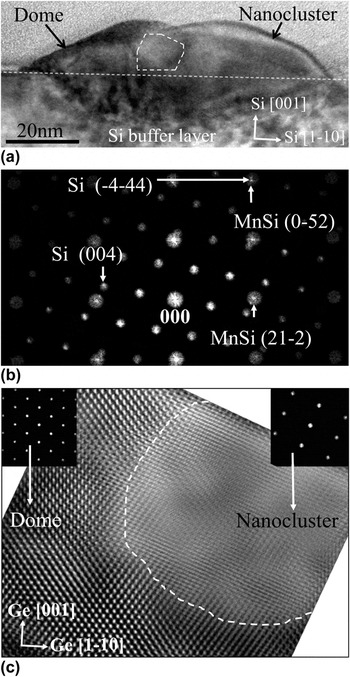
Figure 4(a) shows a nanocluster that clearly extends into the Si subsurface region and is conjoined with a Ge dome island. The fast Fourier transform (FFT) of the high-resolution image is shown in Fig. 4(b) and is well-matched by the MnSi cubic B20 structure viewed along a [425] zone axis that is parallel to the Si [110] zone axis. Figure 4(c) shows the relatively sharp internal heterointerface between the Ge dome and the nanocluster.
(a) Bright-field TEM micrograph of a nanocluster conjoined to a Ge dome viewed along the Si [1-10] zone axis. The dashed area was used for the FFT and inverse FFT image reconstruction in parts (b) and (c), respectively; (b) FFT diffractogram from the dashed area in (a) with indexed reciprocal space of both Si and MnSi; (c) filtered image generated from an inverse FFT of (b). Inset: FFT diffractogram from the dome and nanocluster regions, respectively.

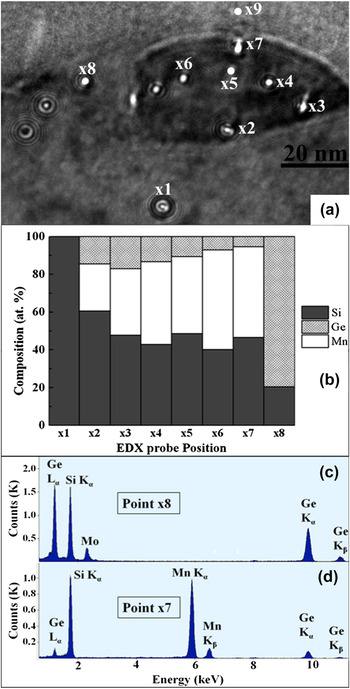
EDX analysis of the structure in Fig. 4 was performed using a ∼2 nm point probe at different locations as shown in Fig. 5. EDX performed in the diamond cubic Si-substrate region below the composite structure (point x1) detects only Si. Similarly, EDX point analysis in the Ge dome (x8) detects Ge, and some Si, but no Mn. Mn was clearly detected in the B20 nanocluster, as shown in Fig. 5(d). In the upper portion of the nanocluster that projects well above the Si substrate, the Mn concentration is about 50 at.%, although the exact value is sensitive, to within ±3 at.%, to background subtraction of Si that was sputter-redeposited during ion milling of the TEM specimen. Hence, EDX is reasonably consistent with identification of a B20 structure with a “ternary” composition Mn(Ge y Si1−y ), where y varies from 0.15–0.3 with the dot. In the cluster region below the Si substrate surface, the Mn fraction is 0.28. This reduced Mn value suggests that the buried second phase region does not extend throughout the thickness of the thinned TEM specimen, i.e., there is Si matrix along the electron beam path through the specimen, decreasing the apparent Mn content.
(a) BF TEM micrograph of the nanocluster from Fig. 4(a), showing EDX nanoprobe locations; (b) compound histogram summarizing the point concentration measurements across the nanocluster; (c) EDX point scan taken at point x8 (Ge dome). No Mn is detected. (d) EDX point scan taken at point x7 in (a) indicating a ternary composition. The Mo signal arises from the specimen holder.

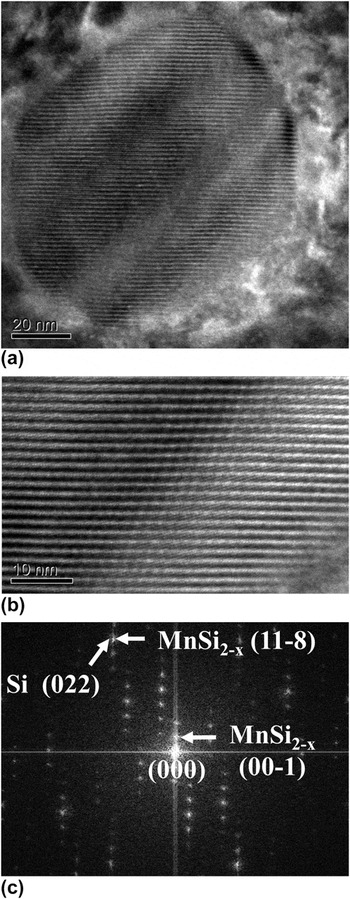
Figure 6 shows plan-view TEM micrographs of another equiaxed nanocluster that exhibits extraordinary fringing. This fringing, both in form and spacing, is characteristic of the tetragonal “Nowotny chimney ladder” (NCL) phases Reference Ye and Amelinckx19 associated with MnSi2−x compounds, in which the fringes arise from interference between the incommensurate Mn and Si sublattices. The corresponding FFT, obtained from the higher resolution image in Fig. 6(b), can be indexed to the Mn4Si7 phase imaged along a [110] zone axis.
(a) Plan-view TEM micrograph of a MnSi2−x nanocluster showing strong fringing viewed on a Si [001] zone axis; (b) HRTEM of the nanocluster (fringe pitch of 1.62 nm); (c) FFT diffractogram from (b), with a few spots from the cluster and the substrate identified.

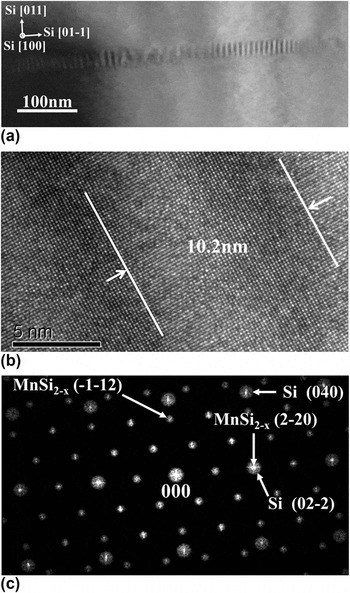
Figure 7 shows plan-view TEM to elucidate the nanorod structure. The nanorods all preferentially grow along the two <110> in-plane orientations of the Si substrate, in agreement with AFM, showing that epitaxial alignment must be occurring for these structures. Although it is not readily apparent in Fig. 7(a), there is a Ge QD attached to the midsection of the rod, detected by local EDX measurement. Moiré fringes along the axial direction of the rod are observed in Fig. 7(a) and in the high-resolution image of Fig. 7(b). The presence of Moiré fringes confirms that the Si substrate must still be present in the thinned specimen. Under appropriate imaging conditions, transverse Moiré fringes are also observed, but with a smaller spacing than the axial fringes (not shown here). The FFT diffractogram of the high-resolution image, shown in Fig. 7(c), has proven challenging to be indexed. The pattern can be fit to both the MnSi2−x NCL, along a [311] zone axis, and the Mn5Si3 hexagonal phases along a [1121] zone axis. However, neither fit is ideal. EDX point scans along the rod verify that Mn is present, and that the Ge:Mn ratio is quite small (3:100), implying that the rods are silicides rather than germanides. The overall stoichiometry cannot be ascertained in plan-view due to the residual Si underneath.
Plan view BF TEM micrograph of a nanorod in the Si [001] zone axis; (b) high-resolution micrograph from the nanorod (a), where the Moiré spacing is indicated; (c) corresponding FFT pattern of (b) with indexed reciprocal space of both Si and MnSi2−x , with a few spots from the cluster and the substrate identified.

IV. DISCUSSION
Copious Mn silicide formation occurred during Ge–10% Mn codeposition on Si (001) under conditions that foster strain-driven Ge QD self-assembly. The preferred formation of at least two Si-rich silicide phases is promoted by the presence of a Si reservoir, larger heats for formation associated with silicides versus germanides, Reference Meschel and Kleppa20 and the elevated growth temperature that promotes high Mn mobility, on the surface and in the bulk. The MnSi B20 and MnSi2−x NCL phases we observed in the equiaxed nanoclusters are equilibrium phases for the Si–Mn system, but not the Ge–Mn system. Our results demonstrate a significant solubility of Ge in the Si sublattice for the MnSi phase, where up to 30% of the Si atoms are replaced by Ge. The apparent lack of a dominant heteroepitaxial orientation for the nanoclusters suggests that interface energy anisotropy is relatively small compared with the driving force for phase formation associated with the large Mn supersaturation, leading to nucleation of multiple phases and crystallographic orientations.
An obvious exception to this are the large rods, which are heteroepitaxial and express strong growth anisotropy along the Si <110> directions. The FFT diffractogram shown in Fig. 7(c) is well-resolved, and we have compared this FFT with zone axis patterns from all the equilibrium Mn–Si and Mn–Ge phases. Best correspondences are with the Mn4Si7 [311] zone axis and Mn5Si3 [1121] zone axis. In the former case, the interplanar spacings match well, but the interplanar angles are off by 5°, whereas in the latter case, the interplanar angles match well, but the interplanar spacing are off by 10%. Plan-view EDX measurements show a limited uptake of Ge into the rods, with a ratio of Mn:Ge ≈ 24. It seems unlikely that such modest incorporation of Ge and Si on a single sublattice can produce such large distortions in either the spacings or the angles; similarly, the distortions would require heteroepitaxial elastic strains of 8–12%, which are too large to be supported in structures of this size. The hexagonal Mn5Si3 D88 structure is an equilibrium phase for both the Ge–Mn and Ge–Si systems, Reference Arras, Caliste, Deutsch, Lançon and Pochet21 and a full range of soluble pseudobinary alloys have been synthesized in bulk. On the other hand, the MnSi2−x NCL phase demonstrates limited Ge solubility, Reference Aoyama, Fedorov, Zaitsev, Solomkin, Eremin, Samunin, Mukoujima, Sano and Tsuji22 although a high-pressure Mn11Ge19 NCL phase has been synthesized. Reference Takizawa, Sato, Endo and Shimada23 As such, the limited Ge uptake observed in the rods is somewhat suggestive that they are not the Mn5Si3 phase.
Mn diffusion lengths under these growth conditions can be quite large. For the large rod shown in Figs. 1(b) and 1(c), we calculate the size of the Mn capture zone required to provide the Mn atoms needed by any given phase, given the rod volume and the amount of Mn deposited per area. The Mn fraction in the rod is given by
 $${x_{{\rm{Mn}}}} = {{{A_{{\rm{CZ}}}}{{\tilde N}_{{\rm{Mn}}}}} \over {{V_{\rm{r}}}{N_{{\rm{phase}}}}}}\quad ,$$
where the numerator represents the total Mn atoms in the capture zone, whereas the denominator is the total number of atoms (Mn, Ge, and Si) in the rod. A
CZ is the capture zone area,
 ${\tilde N_{{\rm{Mn}}}}$
is the deposited Mn atoms/area, V
r is the rod volume, and N
phase is the number of atoms per volume associated with the rod phase. For the chimney ladder phase Mn4Si7, N
phase = 82.5 atoms/nm3 and x
Mn = 0.36. For Mn5Si3, N
phase = 80 atoms/nm3 and x
Mn = 0.625. From AFM, V
r = 5.6 × 10⁵ nm3 (this assumes no buried portion to the rod) and
 ${\tilde N_{{\rm{Mn}}}}$
= 4.7 × 1014 cm−2 from SIMS. We then solve Eq. (1) for A
CZ. To estimate the diffusion length for Mn from A
CZ, we further assume a capture zone perimeter defined by a constant normal distance to the rod. For the MnSi2−x
phase, which is the most Si-rich phase, the Mn capture zone extends about 800 nm from the rod, which is consistent with the large zones denuded of other second phase particles observed about the rods in Fig. 1(c). For the Mn5Si3 phase, the required diffusion length is 1100 nm, which would create overlapping denuded zones, suggesting that the rods are more likely to be a Si-rich phase. If the rods have buried volume in the substrate, then the diffusion radius will be even larger.
Clearly, Mn is highly mobile at the 450 °C growth temperature, and Ge has significant mobility as well, to result in QD formation. Reference Nolph, Kassim, Floro and Reinke24 Si must also be quite mobile. In particular, the Si that participates in the formation of the silicide nanostructures cannot come solely from the volume directly underneath the rod, as it would, e.g., if a planar thin-film diffusion couple was formed. For the NCL crystal structure, the reasoning is straightforward: the density of Si atoms in the NCL crystal structure is 51 Si atoms/nm3. The density of Si in diamond cubic Si is 50 Si/nm3. If the Si required to form the phase was supplied entirely from underneath, the resultant silicide particle would end up perfectly embedded in the Si substrate, with no protruding region, which is not what is observed. For more Mn-rich phases, there will be protrusion, but the buried region will still be the dominant volume fraction, again inconsistent with our results. Hence, the large surface diffusion flux of Mn flowing to the growing silicide nanostructure must liberate Si from beneath the Ge wetting layer to provide an equivalent flow to support the rod stoichiometry.
Field and temperature-dependent magnetic properties for the sample being discussed here have already been reported elsewhere. Reference Kassim, Nolph, Jamet, Reinke and Floro16 Although signals are weak due to the submonolayer amount of Mn in the film, there is evidence of a ferromagnetic phase transition occurring at 220 K. This temperature is not consistent with any of the manganese silicide phases observed here. Cubic B20 MnSi was reported to be an itinerant ferromagnet with a T c = 29 K, where there is a paramagnetic to helical order transition. Reference Thessieu, Flouquet, Lapertot, Stepanov and Jaccard25 Bulk Mn4Si7 is reported to be a weak itinerant ferromagnet displaying a saturation magnetization of 0.012 µB/Mn below T c = 40 K. Reference Zhou, Potzger, Zhang, Mücklich, Eichhorn, Schell, Grötzschel, Schmidt, Skorupa, Helm, Fassbender and Geiger26 Mn5Si3 is antiferromagnetic, with a Neel temperature of 99 K. Reference Menshikov, Vokhmyanin and Dorofeev27 However, Ge substitution into the silicides, which tends to enhance ferromagnetic coupling, could play a significant role in promoting the higher Curie temperature. Substitution of 1% Ge into MnSi led to an increase of T c from 29 to 39 K. Reference Potapova, Dyadkin, Moskvin, Eckerlebe, Menzel and Grigoriev28 Note that we observed up to 10% Ge in the B20 phase. For MnSi2−x , a solubility limit of about 1.6 at.% Ge has been established, Reference Zhou, Zhu, Zhao, Yang, Dasgupta, Stiewe, Hassforf and Mueller29 although magnetic properties were not measured. Vinkaturova et al. Reference Vinokurova, Ivanov, Kulatov and Vlasov30 reported increased magnetization with Ge additions up to 0.77 at.%, but T c remained unchanged. For Mn5(Ge y Si1−y )3, Ge additions of more than y = 0.2 were required to observe ferromagnetism, and for y ≈ 0.3, T c = 220 °C. However, we have not clearly observed this phase or composition.
These results, together with our previously reported work on how smaller amounts of Mn incorporate into the Ge-QD/Si substrate system Reference Kassim, Nolph, Jamet, Reinke and Floro17 and the effect of Mn flux on surface morphology and magnetism, Reference Kassim, Nolph, Jamet, Reinke and Floro16 provide an extensive and self-consistent view of how Mn interacts with the system during QD self-assembly. At small relative Mn:Ge flux ratio (Ge:Mn-2%), Mn preferentially enters and reacts with the Si substrate during Ge wetting layer formation, creating embedded islands of a metastable solution phase (although Mn may not be substitutional in this phase) that appear in electron diffraction to be diamond-cubic. Reference Kassim, Nolph, Jamet, Reinke and Floro17 Continued Ge + Mn deposition leads to preferential formation of Ge QDs over these buried Si–Mn islands. Simultaneously, Mn forms a dilute homogenous solution within the large Ge QDs that overgrow the buried Si–Mn islands. Concomitantly, the buried regions begin to transform to crystallographically distinct silicide phases, which eventually grow up into the Ge QDs. For the Ge-QD/Si:Mn system at this stage, robust room temperature ferromagnetism is not clearly observed, although the measurements are actually highly nontrivial due to the need to properly subtract the dominant diamagnetic signal of the Si substrate. With higher relative Mn:Ge flux (e.g., Ge:Mn-5%), the precursor Si–Mn silicide structures discussed above are found to emerge from their “host” QDs onto the surface of the Ge wetting layer. Reference Kassim, Nolph, Jamet, Reinke and Floro16 At even higher Mn content, which is the subject of this paper, these regions grow rapidly for form extended silicide phases. Under these growth conditions where Ge QDs self-assemble, Mn is highly mobile and preferentially reacts with Si (vis-à-vis Ge) due to the higher heats of formation of relevant silicide phases versus germanides.
V. CONCLUSIONS
The growth of Ge quantum dots with a 10% relative Mn flux leads to formation of typical QD morphologies coexisting with an array of Mn–silicide second phase nanostructures. The B20 MnSi and NCL MnSi2−x phases were clearly identified in equiaxed nanostructures, and local composition measurements show that while Si is the dominant group IV component, Ge can substitute on the Si sites, up to 30% of sites in the MnSi case, but much less for the NCL. Consistent epitaxial orientations were not observed in the nanoclusters. However, the population of large nanorods was epitaxially oriented. Phase identification was challenging in this case, but the overall data and analysis is most consistent with the NCL phase rather than the hexagonal Mn5Si3 prototype. At the 450 °C growth temperature, Mn is highly mobile, with surface diffusion lengths of the order of 800 nm, with significant bulk mobility as well, resulting in surface structures that also penetrate the Si substrate. It was argued that Si is also quite mobile under these conditions. A magnetic phase transition at 220 °C does not match known behavior of the bulk silicide phases but might result from extensive ternary alloying with Ge, especially into the cubic MnSi phase.
ACKNOWLEDGMENTS
We gratefully acknowledge Prof. Jim Howe for useful discussions on phase identification, Dexin Kong and Prof. Jeff Drucker for their careful RBS measurement, and Dr. Stephen Smith for SIMS work and discussions. This work is supported by the National Science Foundation under Grant No. DMR-0907234.