INTRODUCTION
The delineation and dating of shoreline features typically provides information on the areal extent and age of lakes at their relative high stands during oscillating lake-level cycles. Most studies focused on reconstructing lake levels are either limited to periods with relative high stands because of a lack of preserved landforms and outcrop evidence for lower water levels (e.g., Adams, Reference Adams2007; Bartov et al., Reference Bartov, Enzel, Porat and Stein2007) or rely on inferences from stratigraphy exposed in lower parts of lake basins without shoreline constraints (e.g., Negrini et al., Reference Negrini, Wigand, Draucker, Gobalet, Gardner, Sutton and Yohe2006). Lacustrine sediment cores are useful in identifying changes in relative lake levels from proxy evidence (e.g., sediment size, geochemistry, and biology; Benson, Reference Benson2004), but there is large uncertainty in use of proxy evidence to infer corresponding water depths and associated water levels (e.g., Smith, Reference Smith1997; Reheis et al., Reference Reheis, Adams, Oviatt and Bacon2014). When shoreline data and lake core records are combined, a coupled data synthesis yields stronger and more complete records (Bacon et al., Reference Bacon, Burke, Pezzopane and Jayko2006; Reheis et al., Reference Reheis, Adams, Oviatt and Bacon2014). Further, if these data sets are integrated using a method to provide constraining water levels in the absence of shoreline evidence of both high and low water levels, a continuous lake-level record can be developed.
Application of monthly, watershed-lake hydrologic models have been used for the Sierra Nevada and Great Basin to infer paleoclimate variability for the region. The hydrologic models are commonly controlled by lake-stage records derived from either dated landforms or inferences from outcrop evidence. These hydrologic models typically include simulations encompassing short time periods during which lakes were at their relative high stands (e.g., Matsubara and Howard, Reference Matsubara and Howard2009; Yu et al., Reference Yu, Dong and Jiang2015; Barth et al., Reference Barth, Boyle, Hatchett, Bassett, Garner and Adams2016) or in rare cases during relative low stands (e.g., Hatchett et al., Reference Hatchett, Boyle, Putnam and Bassett2015, Reference Hatchett, Boyle, Garner, Kaplan, Putnam and Bassett2016). As a result, most of the model simulations are restricted to discrete periods that lacked a complete record of a given lake-level cycle, thereby offering discontinuous estimates of paleoclimate variability in the context of climate change at multi-decadal to multi-centennial scales.
The primary goal of our investigation is to refine the late Holocene portion of the lake-level record of Owens Lake, previously developed by Bacon et al. (Reference Bacon, Burke, Pezzopane and Jayko2006) and included in Reheis et al. (Reference Reheis, Adams, Oviatt and Bacon2014), to test a new approach in developing a continuous lake-level record. Our objectives are three-fold: (1) to present geomorphic evidence and numerical age constraints for four previously undated shoreline features below the late Holocene high-stand shoreline at an elevation of ~1108 m and for two low stands below the historical maximum lake level at ~1096 m; (2) to develop a new modeling approach to estimate lake levels in the absence of shoreline evidence by integrating shoreline and lake-core data sets with threshold lake-water depth estimates from wind-wave and sediment entrainment modeling of lake core OL97 sedimentology; and (3) to construct a continuous lake-level curve for the late Holocene to assess hydroclimate variability in the region.
GEOLOGIC AND HYDROLOGIC SETTING
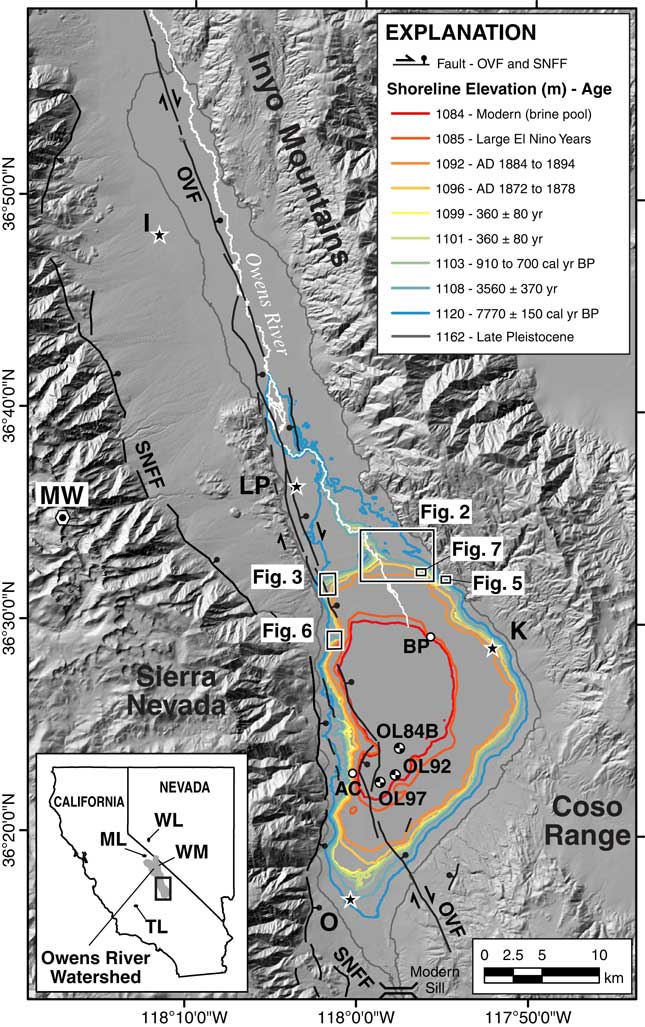
The Owens River watershed includes Owens Valley, an approximately 15–40 km wide and 200-km-long graben in the southwestern Great Basin in east-central California. The watershed is on the eastern side of the south-central Sierra Nevada that forms one of the principal rain shadows in the western United States. The watershed has a drainage area of ~8515 km2 and is bounded by the crests of the Sierra Nevada Range to the west, White-Inyo Mountains to the east, and the Coso Range to the south and east (Fig. 1). The northern extent of the watershed is defined by a drainage divide with Mono Lake basin. Crests of the Sierra Nevada and White-Inyo Mountains rise more than 3000 m above the floor of Owens Valley, with Mount Whitney at an elevation of 4421 m west of the town of Lone Pine (Fig. 1). The northern extent of the Owens River is within Long Valley and extends to the south, where it drains into Owens Lake basin.
(color online) Map of the southern Owens River watershed showing the elevation of well-developed Holocene shorelines (1084–1120 m) and late Pleistocene highstand shoreline (~1162 m) of Owens Lake from this study and Bacon et al. (Reference Bacon, Burke, Pezzopane and Jayko2006). The modern extent of Owens Lake playa below an elevation of ~1096 m, the Owens Valley fault (OVF), and Sierra Nevada Frontal fault (SNFF) are shown. Rectangles show areal extent of maps and imagery on following figures. White circles are the locations of study sites described in text: AC, Ash Creek; BP, Brine Pool. Location of lake core OL84B, OL92, and OL97 sites are shown. Inset map shows the boundary of the Owens River watershed along the eastern side of the south-central Sierra Nevada in eastern California. Major physiographic and hydrologic features and towns shown on the maps include: I, Independence; K, Keeler; LP, Lone Pine; ML, Mono Lake; MW, Mount Whitney Peak (elevation=4421 m); O, Olancha; TL, Tulare Lake; WL, Walker Lake; WM, White Mountains.

Owens Lake occupies a topographically closed basin contained by a sill at an elevation of ~1145 m at the south end of the basin. Owens Lake basin is relatively shallow because of high sedimentation rates from the Owens River and surrounding alluvial fans (Fig. 1). Snowmelt from the Sierra Nevada accounts for most of the annual streamflow in the watershed (Hollet et al., 1991). Therefore, small changes in streamflow inputs associated with changes in the magnitude of snowpack and rate of snowmelt are amplified in the lake basin because of its shallow-hypsometric configuration compared to other lakes on the eastern side of the Sierra Nevada that are much deeper (e.g., Lake Tahoe, Pyramid Lake, Walker Lake, and Mono Lake) or west-side lakes that are sourced from larger and forested watersheds at lower elevations (e.g., Tulare Lake; Fig. 1).
During the period AD 1872–1878, Owens Lake was a perennial, closed-basin lake that covered more than 280 km2 with a historical maximum lake level at 1096.4 m and a water depth of 14.9 m (Gale, Reference Gale1914; Lee, Reference Lee1915). Major water diversions in Owens Valley began after AD 1913 with construction of the Los Angeles aqueduct system that transported surface water from the Owens River watershed and Mono Lake basin (since AD 1941) more than 320 km to the south for distribution (Hollett et al., Reference Hollett, Danskin, McCafferey and Walti1991). Owens Lake first began depositing salts onto the lake floor in AD 1921 because of these diversions, and by AD ~1931, Owens Lake had desiccated and become a playa (Smith et al., Reference Smith, Bischoff and Bradbury1997).
Late Pleistocene and Holocene lake-level history
Owens Lake has been the focus of numerous paleohydrologic studies because of a robust record of climate change preserved in lacustrine sediments and shoreline geomorphic features. Most of these studies focused on resolving the late Pleistocene history of pluvial Owens Lake through analyses of sediment cores with records going back ~800,000 yr (e.g., Smith and Pratt, Reference Smith and Pratt1957; Newton, Reference Newton1991; Lund et al., Reference Lund, Newton, Hammond, Davis and Bradbury1993; Benson et al., Reference Benson, Burdett, Kashgarian, Lund, Phillips and Rye1996, Reference Benson, Burdett, Lund, Kashgarian and Mensing1997, 2004; Smith et al., Reference Smith, Bischoff and Bradbury1997 and references therein; Mensing, Reference Mensing2001) and shoreline features as old as ~140,000 yr (Carver, Reference Carver1970; Beanland and Clark, Reference Beanland and Clark1994; Bacon et al., Reference Bacon, Burke, Pezzopane and Jayko2006; Bacon and Pezzopane, Reference Bacon and Pezzopane2007; Jayko and Bacon, Reference Jayko and Bacon2008; Orme and Orme, Reference Orme and Orme2008). The age, distribution, and paleoclimatic context of the younger and lowest-elevation shorelines that encompass Owens Lake basin, however, have not been the primary focus of previous studies. Previous descriptions and geologic mapping of areas within Owens Lake basin do not provide sufficient resolution to characterize the middle to late Holocene lacustrine stratigraphy in the basin, because they either lack numerical ages (e.g., Gale, Reference Gale1914; Lee, Reference Lee1915; Stinson, Reference Stinson1977; Stone et al., Reference Stone, Dunne, Moore and Smith2000, Reference Stone, Dunne, Conrad, Swanson, Stevens and Valin2004; Jayko, Reference Jayko2009) or were performed during site-specific studies focused on older and higher shorelines (e.g., Bacon and Pezzopane, Reference Bacon and Pezzopane2007; Jayko and Bacon, Reference Jayko and Bacon2008; Orme and Orme, Reference Orme and Orme2008). Only inferred surface ages for the lowest shorelines (Bacon et al., Reference Bacon, Burke, Pezzopane and Jayko2006) and sediment-core proxy evidence spanning the last 1000 yr (Li et al., Reference Li, Bischoff, Ku, Lund and Stott2000; Smoot et al., Reference Smoot, Litwin, Bischoff and Lund2000) and for most of the Holocene (Newton, Reference Newton1991; Smith et al., Reference Smith, Bischoff and Bradbury1997; Benson et al., Reference Benson, Kashgarian, Rye, Lund, Paillet, Smoot, Kester, Mensing, Meko and Lindstrom2002; Benson, Reference Benson2004) addressed the middle to late Holocene history of Owens Lake and hydroclimate variability in the region.
Tectonic setting
Understanding the rates and style of tectonic deformation within seismically active lake basins provides information to correlate shoreline features, as well as to accurately reconstruct past lake levels. Owens Valley is a region of active tectonics, as demonstrated by the M7.5–7.75 AD 1872 Owens Valley earthquake (Beanland and Clark, Reference Beanland and Clark1994). The southern section of the Owens Valley fault (OVF) extends along the entire western margin of Owens Lake basin (Fig. 1). During the AD 1872 earthquake, normal-oblique displacements produced subsidence in the depocenter area of Owens Lake that created a seismic seiche (i.e., tsunami), raised the western shoreline, and shifted the position of the eastern shoreline of the lake several hundred meters to the west (Smoot et al., Reference Smoot, Litwin, Bischoff and Lund2000). Predominantly eastside-down vertical fault slip of 0.5–1.0 m (Slemmons et al., Reference Slemmons, Vittori, Jayko, Carver and Bacon2008; Haddon et al., Reference Haddon, Amos, Zielke, Jayko and Bürgmann2016) coupled with natural variability in the height of constructional shoreline features of about 1.0 m have produced a range in elevation of up to ~1.5 m for shoreline features of similar age that are younger than the penultimate event on the southern OVF of 9500±500 cal yr BP (Bacon et al., Reference Bacon, Burke, Pezzopane and Jayko2006; Bacon and Pezzopane, Reference Bacon and Pezzopane2007).
METHODS
Geomorphic mapping
We mapped fluvial, deltaic, and shoreline features between the lower Owens River meander belt and northern sector of Owens Lake basin to establish geomorphic information on the late Holocene lake-level history. Mapping delineated landforms from georeferenced satellite imagery and aerial photography. Map unit contacts were digitally created directly on base layers in a GIS platform. Digitizing unit boundaries was done at a fixed map scale of 1:4000 using a series of color satellite imagery with 0.5- and 1.0-m resolution from the years AD 2006 and 2008, respectively, in addition to color aerial photography with 0.3-m resolution acquired in AD 2011.
Mapping of geomorphic features was based on tonal, textural, and topographic qualities (e.g., differences in surface color, degree of dissection, and channel network development) plus presence and density of vegetation (e.g., Bull, Reference Bull1991). Landforms were classified into geomorphic units following a modified version of the categorization scheme of Peterson (Reference Peterson1981). Landform surface characteristics including magnitude of bar-and-swale microtopography and the elevation position of landform surfaces in relation to active channels (i.e., degree of dissection and relief), along with the degree of desert pavement (i.e., surface gravel density) and desert varnish (i.e., manganese oxide coatings) development helped differentiate younger landforms from older ones (e.g., McFadden et al., Reference McFadden, Ritter and Wells1989). Documenting these types of surface features and weathering characteristics combined with the age and elevation of specific shorelines from published studies and/or from this study enabled separation of primary landform feature types into distinct geomorphic units with an associated age class (Fig. 2).
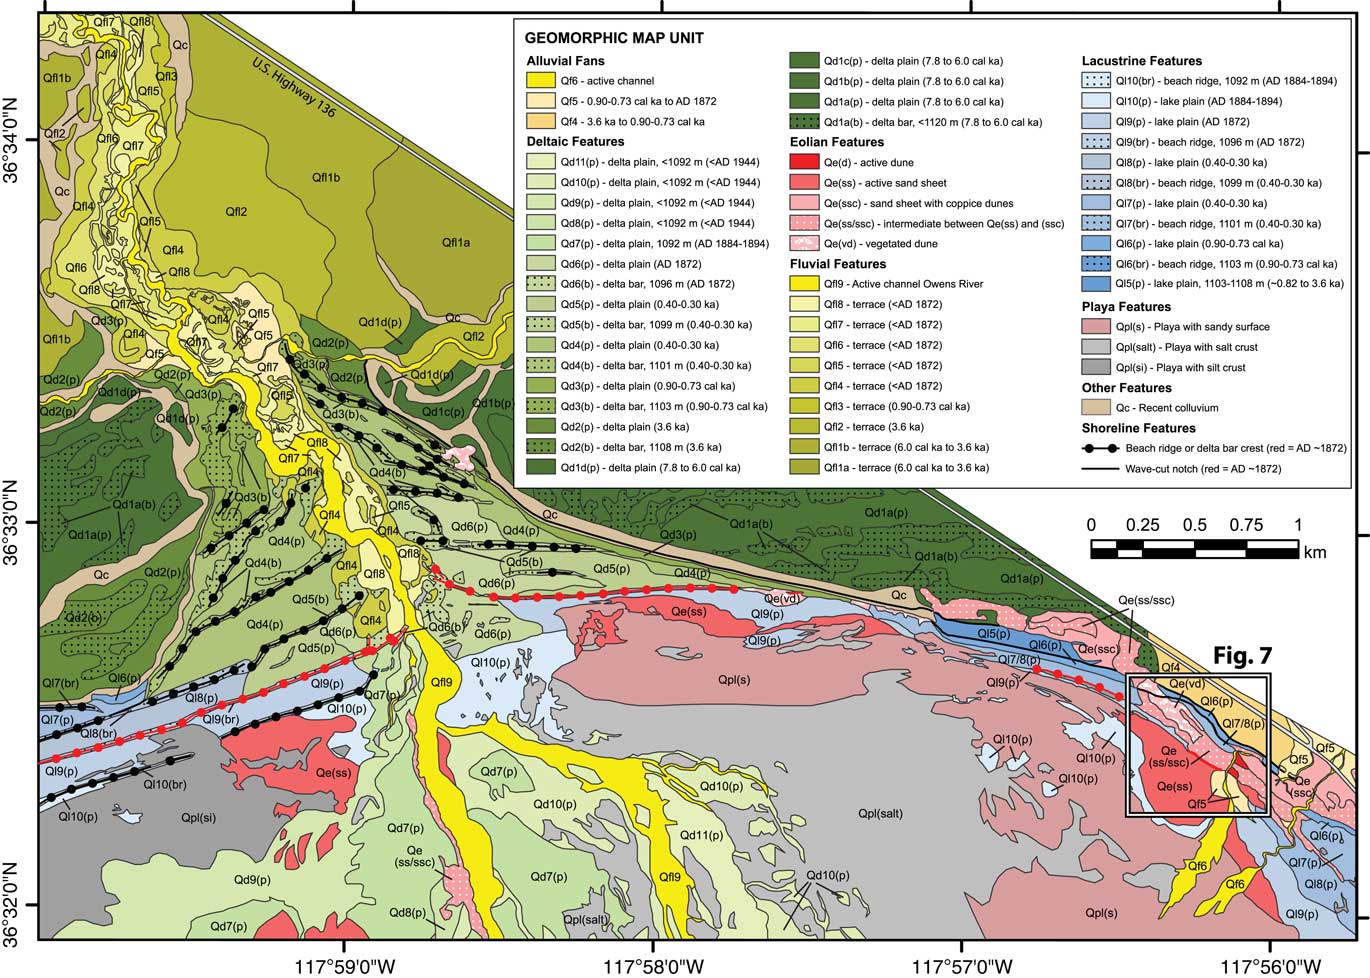
Detailed geomorphic map of the north-northeastern sector of Owens Lake basin showing the age and distribution of alluvial fan, deltaic, eolian, fluvial, lacustrine, playa, and other landform feature-types. Age control is from directly dated shoreline features from Bacon et al. (Reference Bacon, Burke, Pezzopane and Jayko2006) and results of this study, as well as from crosscutting relations with undated landforms. Inset box shows areal extent of the Lizard Tail Dune study site. Shoreline features formed by historical lake levels during AD 1872–1878 are shown in red. (For interpretation of the references to color in this figure legend, the reader is referred to the web version of this article.)

Seven primary landform feature types were identified, including alluvial fans, deltaic, eolian, fluvial, lacustrine, playa, and other. These primary feature types were further separated into 53 distinct geomorphic map units with a corresponding surface age when applicable (Fig. 2). Abbreviated descriptors for Quaternary feature types (e.g., Qfl, fluvial; Qf, alluvial fan; Qd, deltaic) were numbered 1 through increasing value (e.g., 1 to 5), representing oldest to youngest geomorphic surfaces. Playa features of the dry bed of Owens Lake (Qpl) were separated into silt crust, salt crust, and sand-covered surface landform units (Qpl[si], Qpl[salt], and Qpl[s], respectively). Lacustrine features (Ql) also were separated into shoreline landform units consisting of beach ridges and lake plains (Ql[br] and Ql[p], respectively). Deltaic features were further separated into delta bar and delta plain landform units (Qd[b] and Qd[p], respectively). Eolian features (Qe) were differentiated into five distinct landform units including active dunes, active sand sheets, sand sheets with coppice dunes, intermediate between active sand sheets and sand sheets with coppice dunes, and vegetated dunes (Qe[d], Qe[ss], Qe[ssc], Qe[ss/ssc], and Qe[vd], respectively). The remaining map units include recent colluvium (Qc) associated with bluffs (i.e., terrace risers and wave-formed scarps) of the lower Owens River meander belt and fluvial-deltaic system (Fig. 2), along with late Holocene flood deposits (Qfd) and undifferentiated bedrock (Bx).
Radiocarbon analysis
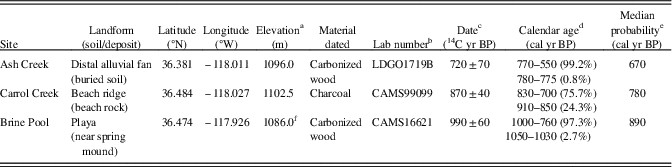
We used radiocarbon analysis to directly date detrital charcoal within beach rock from a natural stream channel cut across a beach ridge at 1103 m to constrain the age of a shoreline at this elevation. Analyses were also performed to constrain the age of lake levels below 1096 m by dating carbonized wood of a tufa-coated stump preserved on the playa floor, and to date carbonized wood of an additional stump from a buried soil exposed in alluvium (Table 1). The radiocarbon ages are reported in radiocarbon years before present (14C yr BP) and have been calibrated to calendar years before present (cal yr BP) using the CALIB7.1 program (Stuiver and Reimer, Reference Stuiver and Reimer1993; Stuiver et al., Reference Stuiver, Reimer and Reimer2017) with the IntCal13 data set (Reimer et al., Reference Reimer, Bard, Bayliss, Beck, Blackwell, Ramsey and Van der Plicht2013). All samples were prepared and processed for AMS dating at either the Center for Accelerator Mass Spectrometry (CAMS) of the Lawrence Livermore National Laboratory or at Lamont-Doherty Geological Observatory.
Radiocarbon dating results and calibrations.

a Elevation source: Ash Creek site from U.S. Geological Survey 10 m DEM; Carrol Creek site from Earthscope (2011) LiDAR DEM; Brine Pool site from 1-m DEM from Mihevc et al. (Reference Mihevc, Cochran and Hall1997).
b CAM, Center for Accelerator Mass Spectrometry, Lawerence Livermore National Laboratory, Livermore, California; LDGO, Lamont-Doherty Geological Observatory, Columbia University, Palisades, New York.
c Accelerator mass spectrometry (AMS) analysis was performed on samples.
d Radiocarbon date is calibrated at ±2σ using CALIB7.1 program (Stuiver and Reimer, Reference Stuiver and Reimer1993) with the IntCal13 data set (Reimer et al., Reference Reimer, Bard, Bayliss, Beck, Blackwell, Ramsey and Van der Plicht2013); percent probability is shown for each age range.
e Median probability of the calibrated age falling within the reported range as calculated by CALIB7.1 program.
f Elevation adjusted ~1 m to account for subsidence from the AD 1872 earthquake.
Luminescence analysis
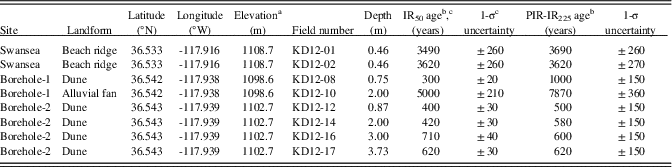
We used infrared-stimulated luminescence (IRSL) analysis to directly date sediments of a beach ridge at 1108 m and to constrain the ages of erosional shoreline features at 1101 and 1099 m by dating sediment within an eolian dune ridge complex. Two samples from a natural stream channel cut across the 1108-m beach ridge, and six samples from two boreholes (borehole-1 and -2) at the top of two dune ridges were recovered (Table 2). Samples were collected in steel tubes tapped into sand-rich horizons in natural exposures or hand-augered at the crest of dune features, where in situ gamma spectrometer measurements were made at each sample position to determine dose rate. All samples were prepared and processed at the University of California, Los Angeles (UCLA) luminescence laboratory. Dating was based on the post-IR50-IRSL225 single-grain luminescence dating method (Rhodes, Reference Rhodes2015). This method has been used recently to date alluvial fan deposits lacking quartz south of Owens Valley in the northern Mojave Desert (e.g., Dolan et al., Reference Dolan, McAuliffe, Rhodes, McGill and Zinke2016) and enables accurate dating of feldspar grains with a precision equal in many cases to radiocarbon analysis of detrital charcoal, thereby allowing the dating of previously undateable strata and landforms (see Rhodes [Reference Rhodes2015] and Supplementary data for description of the post-IR50-IRSL225 technique).
Results of single-grain post-IR IRSL dating of fine sand in Owens Lake basin.

a Elevation of surface of sample site. Elevation surveyed with GPS with real-time differential correction with 10–30 cm vertical accuracy.
b Ages are presented as years before AD 2012.
c IR50 ages are considered the representative age of sediment in the northeast sector of Owens Lake basin.
The IRSL determinations indicated that a high degree of signal resetting had taken place, since the majority of grains provided a common IR50 equivalent dose value when an over dispersion of 15% was incorporated. This additional uncertainty value accounts for between-grain variability caused by effects including slight variations in burial-dose rate. For most samples, IRSL dating results are consistent for duplicates or stratigraphically close locations (compare the following sample pairs: KD12-01 and KD12-02; KD12-12 and KD12-14; KD12-16 and KD12-17), as well as between IR50 and PIR-IR225 determinations (Table 2). Of the eight samples measured, two samples did not follow these trends (i.e., KD12-08 and KD12-10 from the borehole-1 site). It seems likely that the lowermost sample (KD12-10) from this site was collected from alluvial fan sediments underlying the dune and lake plain during the augering process. It remains unclear why the upper sample (KD12-08) at this location provided an apparent discrepancy between IR50 and PI-RIR225 results (300±20 and 1000±150 yr, respectively), but this probably relates to the small number of grains providing PI-RIR signals at 225°C. Furthermore, although fading uncorrected PIR-IR225 has been shown to agree with independent age control in several studies, in some cases, residuals associated with thermal transfer arising from high pre-heat temperatures can result in age overestimation (Buyalert et al., Reference Buyalert, Thiel, Murray, Vendenberghe, Yi and Lu2011; Chen et al., Reference Chen, Sheng-Hua and Li2014; Li et al., 2014). Therefore, the corrected IR50 ages in borehole-1 appear to be the more reliable estimate for this sector of Owens Lake basin, therefore all the corrected IR50 ages are considered the representative ages in the study.
Lake bottom sediment entrainment modeling
Wind-wave model
Application of wind-wave and sediment entrainment models are commonly used to estimate erosion potential within intertidal to open water coastal environments for coastal protection and habitat rehabilitation (e.g., USACE, 1984, 2002; Teeter et al., 2001; Rohweder et al., Reference Rohweder, Rogala, Johnson, Anderson, Clark, Chamberlin and Runyon2008; Fagherazzi and Wiberg, Reference Fagherazzi and Wiberg2009). These types of models have also been used in lacustrine environments to estimate the distribution of sediment texture at the lake bottom (e.g., Håkanson, Reference Håkanson1977), as well as to quantify potential impacts to water quality and clarity from resuspension of sediment, plus nutrients, heavy metals, and other toxic substances for water resource management (e.g., Reardon et al., Reference Reardon, Moreno-Casas, Bombardelli and Schladow2016; Ji, 2017). In this study, we apply a similar approach to model the wind-wave characteristics and threshold lake-water depths required for the sedimentology described in core OL97. Our approach is calibrated by modeling the historical section in core OL97 with limnological conditions for the period AD 1872–1878 when Owens Lake was at its historical maximum water level.
Wind-driven sediment entrainment occurs when water depth is shallow enough to effectively transfer the momentum of wind-waves from the water surface to the sediment-water interface (Håkanson and Jansson, Reference Håkanson and Jansson2002; Reardon et al., Reference Reardon, Moreno-Casas, Bombardelli and Schladow2016). Wind waves and the fluid shear stresses they produce within the water column are the main mechanism responsible for sediment erosion and resuspension when the critical shear stress of bottom sediment is exceeded (e.g., Fagherazzi and Wiberg, Reference Fagherazzi and Wiberg2009). The wind-wave model we used is based on linear wave theory and consists of a series of analytical solutions for estimating deep-water wave characteristics, including: significant wave height, wave length, spectral peak wave period, maximum orbital wave velocity, and critical shear stress (USACE, 1984, 2002; Rohweder et al., Reference Rohweder, Rogala, Johnson, Anderson, Clark, Chamberlin and Runyon2008).
An initial step in the modeling procedure is to determine the wave characteristics of wave height, period, and length in deep water. The shape of wind waves is predominately controlled by the intensity and duration of wind shear across open water surfaces, therefore wind velocity and fetch are the principal variables used to determine wave characteristics that control the magnitude of the boundary velocity below the wave crest at a specified depth. Modeling of intermediate to shallow wind-waves (e.g., USACE, 2002; Le Roux, Reference Le Roux2010) was not performed in this study because sediment cores were extracted from the depocenter area of Owens Lake basin (Fig. 1).
Wind
Wind direction in Owens Lake basin is strongly controlled by the orientation and topography of Owens Valley, which has a wind regime with two primary directional sectors of N-NNW and S-SSE (Lancaster et al., Reference Lancaster, Baker, Bacon and McCarley-Holder2015). We relied on the classification of wind potential to produce dust-raising events in Owens Lake basin to characterize wind in the wind-wave model. Data from three continuous meteorological stations around Owens Lake playa operating from AD 1988–1991 show that high and extreme-high wind events in Owens Lake basin have hourly average wind speeds of ≥7 and ≥18 m/s, respectively, with extreme-high wind events occurring only a few times per year having wind gusts in excess of 22 m/s mostly from the N-NNW (Zhong et al., Reference Zhong, Li, Whiteman, Bian and Yao2008). Furthermore, measured wind speeds of 15–17 m/s for fetch-limited water bodies have previously been used in wind-wave models because these magnitudes generate waves causing sediment erosion and resuspension (e.g., Rohweder et al., Reference Rohweder, Rogala, Johnson, Anderson, Clark, Chamberlin and Runyon2008; Fagherazzi and Wiberg, Reference Fagherazzi and Wiberg2009).
Fetch
Fetch is the unobstructed distance traveled by wind or waves across open water (e.g., Fagherazzi and Wiberg, Reference Fagherazzi and Wiberg2009). Limited fetch conditions existed at Owens Lake during AD 1872–1878, because of the lakes limited size having fetch lengths of ~17 and ~5 km at the core OL97 site from N-NNW and S-SSE directed winds, respectively. The 17 m fetch length was also used in the wind-wave model to simulate wave characteristics for the higher pre-historical water levels, because the difference in fetch between the 1096- and 1108-m lake levels is negligible (Fig. 1). Similarly, the same fetch length was used for lower lake levels associated with the deposition of very coarse sand to fine pebble (2–4 mm) described in core OL97 to provide maximum potential water depths estimates for the larger particles sizes.
Critical shear stress
Critical shear stress represents the threshold for the initiation of potential particle motion when the drag force of flowing water against a particle exceeds the gravitational force holding it in place. The routine used to calculate the critical shear stress is based on the methods described in USACE (2002), which accounts for laminar flow along a flat lake bottom surface, as well as particle size and density in water with a specific density and viscosity. A flat lake-bottom slope was confirmed around the core OL97 site by a calculation of 0.025° in a GIS platform from a digital elevation model (DEM) that was created from contours digitized by Mihevc et al. (Reference Mihevc, Cochran and Hall1997) from the bathymetric map of Owens Lake surveyed in February, AD 1913 (Gale, Reference Gale1914; Lee; Reference Lee1915). The salinity of Owens Lake water of 60.4 g/l in AD 1872–1878 (Winkle and Eaton, Reference Winkle and Eaton1910) was used to calculate a water density of 1045.8 kg/m3 and kinematic viscosity of 1.235 m2/s at a temperature of 15°C using MATLAB code of the Massachusetts Institute of Technology seawater thermophysical properties library (Sharqawy et al., Reference Sharqawy, Lienhard and Zubair2010; Nayar et al., Reference Nayar, Sharqawy, Banchik and Lienhard2016). Sediment characteristics were assumed to have a density of quartz (2650 kg/m3), well sorted, and rounded with particle diameters ranging from mud-sized (0.0625–0.002 mm) to fine pebble (4 mm) that coincide with the boundaries between the size classes of the Wentworth (Reference Wentworth1922) scale.
RESULTS
Geomorphology of late Holocene shoreline features
Shoreline features
Four late Holocene (pre-historical) shorelines surrounding Owens Lake playa at elevations of ~1108, 1103, 1101, and 1099 m were first recognized and investigated as part of a study to characterize dune fields in Owens Lake basin (Lancaster and McCarley-Holder, Reference Lancaster and McCarley-Holder2013; Lancaster et al., Reference Lancaster, Baker, Bacon and McCarley-Holder2015). These shoreline features are the focus of the study presented here and include well-preserved, gravelly and sandy beach ridges, and lake plains in the northern and southern margins of the lake basin where there was sustained perennial stream discharge from the Owens River and/or low-gradient alluvial fan sedimentation during their formation. In contrast, the shoreline features on the western and eastern margins of the basin associated with these lake levels are mostly wave-formed strandlines (i.e., wave-formed scarps or shoreline scarps) developed at the toe of steep and active alluvial fans or near fan apexes, with fewer constructional beach-ridge remnants. Two primary lacustrine landform units were identified in the Owens Lake basin that include beach ridges (Ql[br]) and lake plains (Ql[p]; Fig. 2).
Lacustrine beach ridges are defined as relict, semi-parallel, as well as multiple wave- and wind-built landforms that formed in response to seasonal water-level changes (Otvos, Reference Otvos2000). The height and dimensions of beach ridges relative to still-water levels in lake basins are principally controlled by slope angle, wave conditions, lake-level ranges, and wind-induced rise in water level (Otvos, Reference Otvos2000). Surface cover on these features in Owens Lake basin ranges from a lag of well-rounded gravel underlain by well-stratified, well-sorted, massive to stratified coarse sand and gravel on poorly-developed and younger-aged features to surfaces with a desert pavement composed of gravel that are underlain by well-rounded, well-stratified, and well-sorted sand and gravel on better developed and older-aged features.
The lake plain surfaces represent former lake bottoms within the lower-foreshore and near-shore bathymetric environmental zones of the lake shore. Different-aged lake plains can be identified as the intervening area between well-developed beach ridges that often contain small-relief shoreline scarps formed by recessional stands of the lake (Peterson, Reference Peterson1981). Surface cover on the lake plain features in Owens Lake basin ranges from a desert pavement composed of gravel underlain by well-rounded, well-stratified, and well-sorted sands to gravels on well-developed and older-aged features to surfaces either having a soluble salt-rich crust, platy tufa, or a lag of sandy gravel that are all underlain by massive silts and sands on the lower elevation and younger-aged features.
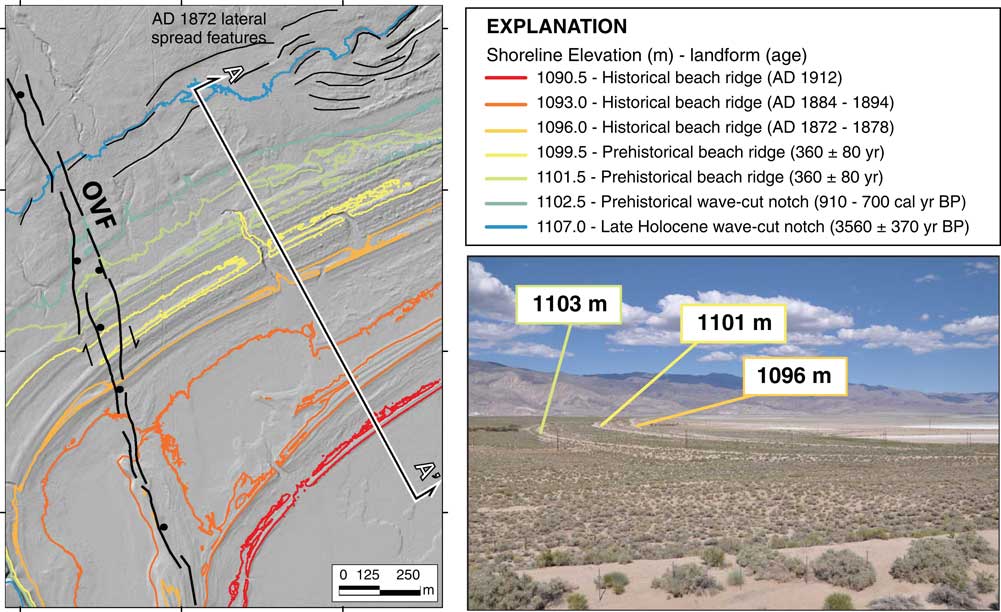
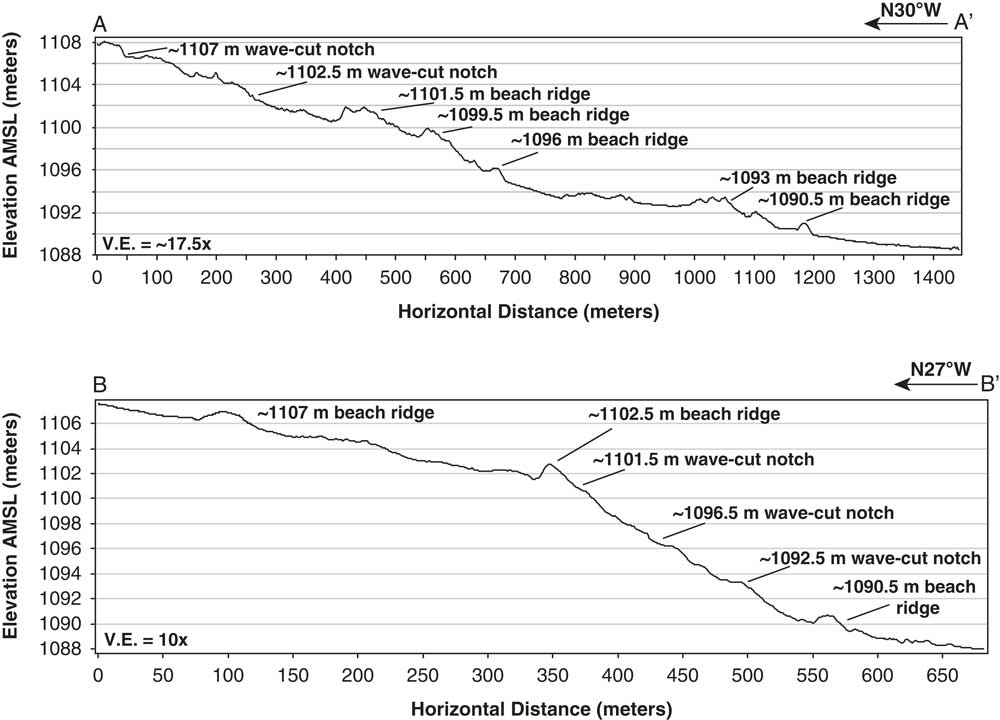
The best preserved and most complete geomorphic record of late Holocene-aged shoreline features below an elevation of ~1110 m is located in the northwest corner of the playa basin near the surface rupture of the active OVF (Fig. 1). At this locality and in many other areas along the northern and southern margins of the basin, there are up to four well-developed shorelines in the form of beach ridges and wave-formed strandlines at elevations of ~1108, 1103, 1101, and 1099 m, plus historical shoreline features at and below 1096 m (Fig. 3 and 4A).
(color online) Hillshade map and elevation contours showing the best preserved and complete geomorphic record of late Holocene-aged shoreline features below an elevation of ~1110 m. The trace of the AD 1872 surface rupture of the Owens Valley fault (OVF) and secondary faulting from lateral-spreading during the earthquake (Carver, Reference Carver1970) are shown in the northwest corner of Owens Lake basin (Fig. 1). Location of geomorphic profile transect A–A’ (Fig. 4) is shown. Photograph shows the 1103-, 1101-, and 1096-m shorelines and playa, view to the east with Inyo Mountains in distance. Hill shade and contours from 0.5-m resolution airborne laser swath mapping digital topographic data from EarthScope (2011).

Geomorphic profiles of late Holocene-aged shoreline features below an elevation of ~1110 m along transect A–A’ at the northwest corner of Owens Lake basin (Fig. 3) and B–B’ at the Carrol Creek study site along the western margin of the lake basin (Fig. 1 and 6). Profiles were developed from 0.5-m resolution airborne laser swath mapping digital topographic data from EarthScope (2011).

Deltaic features
Two landform units identified near the mouth of the Owens River where it enters Owens Lake basin consist of delta bar and delta plain feature-types (Fig. 2). Delta plains are commonly associated with delta bars and collectively can indicate the mean lake level associated with the deltaic system (e.g., Einsele, Reference Einsele2000). The deltaic units are inset into a broad and dissected fluvial-deltaic plain last occupied by an early Holocene (~8000 cal yr BP) high stand at 1120 m (Bacon et al., Reference Bacon, Burke, Pezzopane and Jayko2006; Bacon and Pezzopane, Reference Bacon and Pezzopane2007). Subsequent middle to late Holocene regressive water levels have formed a prograding delta complex that extends south from the entrenched channel of the Owens River meander belt to the floor of the playa. The morphostratigraphic position and elevation of each delta bar and plain map unit coincide with shorelines at 1108, 1103, 1101, and 1099 m, plus historical shoreline features at and below the 1096-m shoreline last occupied during the period AD 1872–1878 (Gale, Reference Gale1914; Fig. 2). The bulk of the entrenched portion of the delta complex formed at the 1101-, 1099-, and 1096-m (historical) water levels. The unconfined and telescoping morphometry of the southern extent of the delta complex across the playa floor formed in response to falling water levels at and below ~1093 m beginning in AD 1884–1894 (e.g., Lee, Reference Lee1915).
Late Holocene shorelines
Neopluvial high stand at 1108 m (3800–3600 cal yr BP)
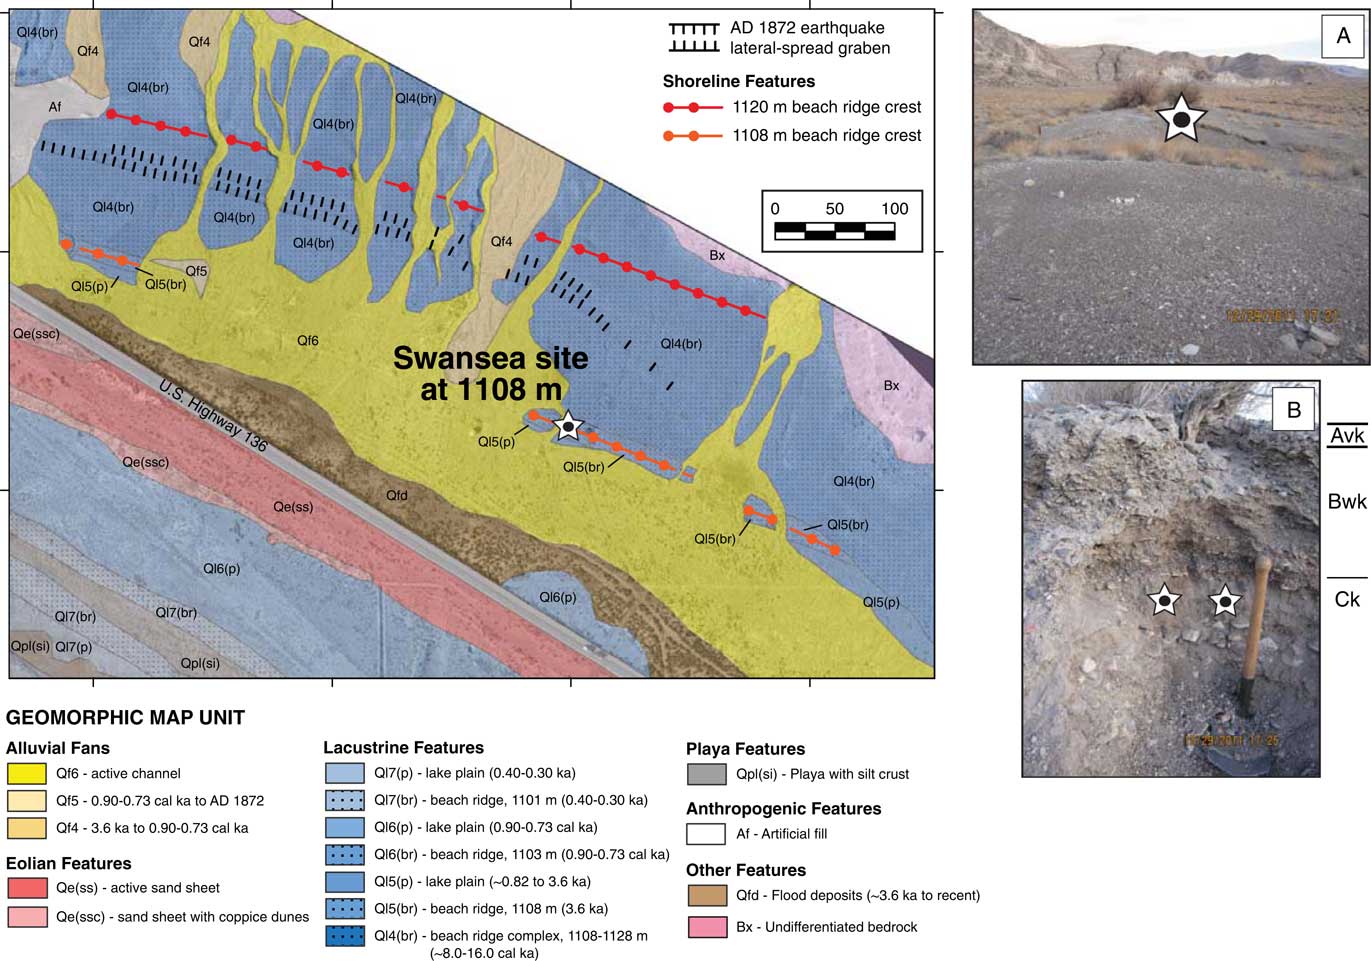
Shoreline features identified at and near the elevation of 1108 m occur as relatively narrow areas preserved on gentle slopes fringing the playa basin. The best developed example of a beach ridge at 1108 m is in the northeastern sector of the lake basin within the Swansea embayment (Fig. 1 and 5). Here, the beach ridge along with discontinuous wave-formed strandlines are preserved at the base of a latest Pleistocene to early Holocene beach-ridge complex (Bacon et al., Reference Bacon, Burke, Pezzopane and Jayko2006; Orme and Orme, Reference Orme and Orme2008). The 1108-m beach ridge has broad and well-developed heights of up to ~2 m dissected by alluvial channels. The surface of the beach ridge and associated lake plain in this area is covered by few small shrubs and a layer of sub-rounded to well-rounded gravel that is underlain by mostly stratified coarse sand and gravel composed of Paleozoic metasedimentary lithologies (Fig. 5A). The 1108-m lake-plain surfaces in other parts of the map area are also commonly poorly preserved from either erosion by younger alluvial fans or burial by eolian dunes between the elevations of 1103 and 1108 m (e.g., Fig. 2). The lake-plain surfaces are also moderately vegetated and have a surface cover consisting of a lag of sub-rounded to well-rounded gravel underlain by massive sands.
(color online) Geomorphic map of the Swansea Embayment northwest of Keeler (Fig. 1), showing well-developed beach ridge and lake-plain features at elevations of 1120 and 1108 m, along with a prominent graben formed from lateral spreading during the AD 1872 earthquake (Carver, Reference Carver1970). Star on photographs: (A) shows the location of infrared-stimulated luminescence (IRSL) sampling within a channel cut across the crest of the 1108-m beach ridge, view to the southeast; and (B) shows interbedded sands and gravels, as well as location of duplicate IRSL samples within a sandy layer on northwest-facing channel wall that returned ages of 3490±260 and 3620±260 yr. Entrenching tool is shown for scale. Annotations on the photograph of general soil-geomorphic horizons are also shown.

The 1108-m shoreline previously was inferred to be ~3500 cal yr BP by Bacon et al. (Reference Bacon, Burke, Pezzopane and Jayko2006), based on relative degree of preservation, geomorphic, and topographic cross-cutting relations, as well as regional paleoclimate proxy evidence. Luminescence analysis of two duplicate samples from a sandy layer within interbedded sand and gravel deposits of the 1108-m beach ridge at the Swansea site (Fig. 5B) gave IR50 ages of 3620±260 and 3490±290 yr, supporting this interpretation (Table 2).
The soil-geomorphic characteristics of the 1108-m beach ridge at the Swansea site also indicate that the beach ridge is relatively younger than adjacent and higher latest Pleistocene to early Holocene shoreline features at the Swansea site. The surface of the 1108-m beach ridge has a moderately developed desert pavement with weakly to moderately developed desert varnish and subsurface rubification (i.e., reddening) coatings on gravel clasts, a thin vesicular A (Av) horizon (e.g., McFadden et al., Reference McFadden, McDonald, Wells, Anderson, Quade and Forman1998), and a ~30-cm-thick, weakly developed soil with carbonate (k) and Avk/Bwk/Ck profile lacking soil structure (e.g., Birkeland, Reference Birkeland1999). These soil characteristics are similar to descriptions made on gravelly late Holocene alluvial fans in the southwestern United States (McDonald et al., Reference McDonald, McFadden and Wells2003; Bacon et al., Reference Bacon, McDonald, Caldwell and Dalldorf2010).
A mean age of ~3560±370 yr and supporting soil-geomorphic characteristics provide direct evidence that water levels reached an elevation as high as 1108 m in Owens Lake basin during the late Holocene. Around this time, lakes and glaciers expanded in the south-central Sierra Nevada during a period of wetter conditions commonly referred to as the Neopluvial (or Neoglacial; e.g., Stine, Reference Stine1990, Reference Stine1994; Konrad and Clark, Reference Konrad and Clark1998; Bowerman and Clark, Reference Bowerman and Clark2011; Street et al., Reference Street, Anderson and Paytan2012, Reference Street, Anderson, Rosenbauer and Paytan2013).
Medieval Pluvial high stand at 1103 m (810–790 cal yr BP)
The 1103-m shoreline features occur as relatively narrow areas on gentle slopes fringing the basin that commonly are eroded by younger alluvial fans or buried by sand dunes (e.g., Fig. 2). The 1103-m beach ridges (Ql6[br]) have heights of less than 1 m and a surface that is moderately to poorly vegetated and covered by a lag of well-rounded, coarse sand to gravel, except along the eastern margin of the lake basin where surfaces are typically covered by a lag of angular to sub-rounded gravel. Beach-ridge and lake-plain deposits consist mostly of massive to poorly-stratified coarse sand to gravel or fine-grained sediment with silt- and salt-rich crusts in areas east of the Owens River delta, extending as far south as Keeler. The 1103-m shoreline features are poorly-developed and commonly in the form of wave-formed strandlines developed on bluffs within the lower Owens River meander belt and across older lacustrine and alluvial features that encompass the basin, whereas beach ridges are commonly preserved on inactive and dissected areas of alluvial fans (e.g., Fig. 2).
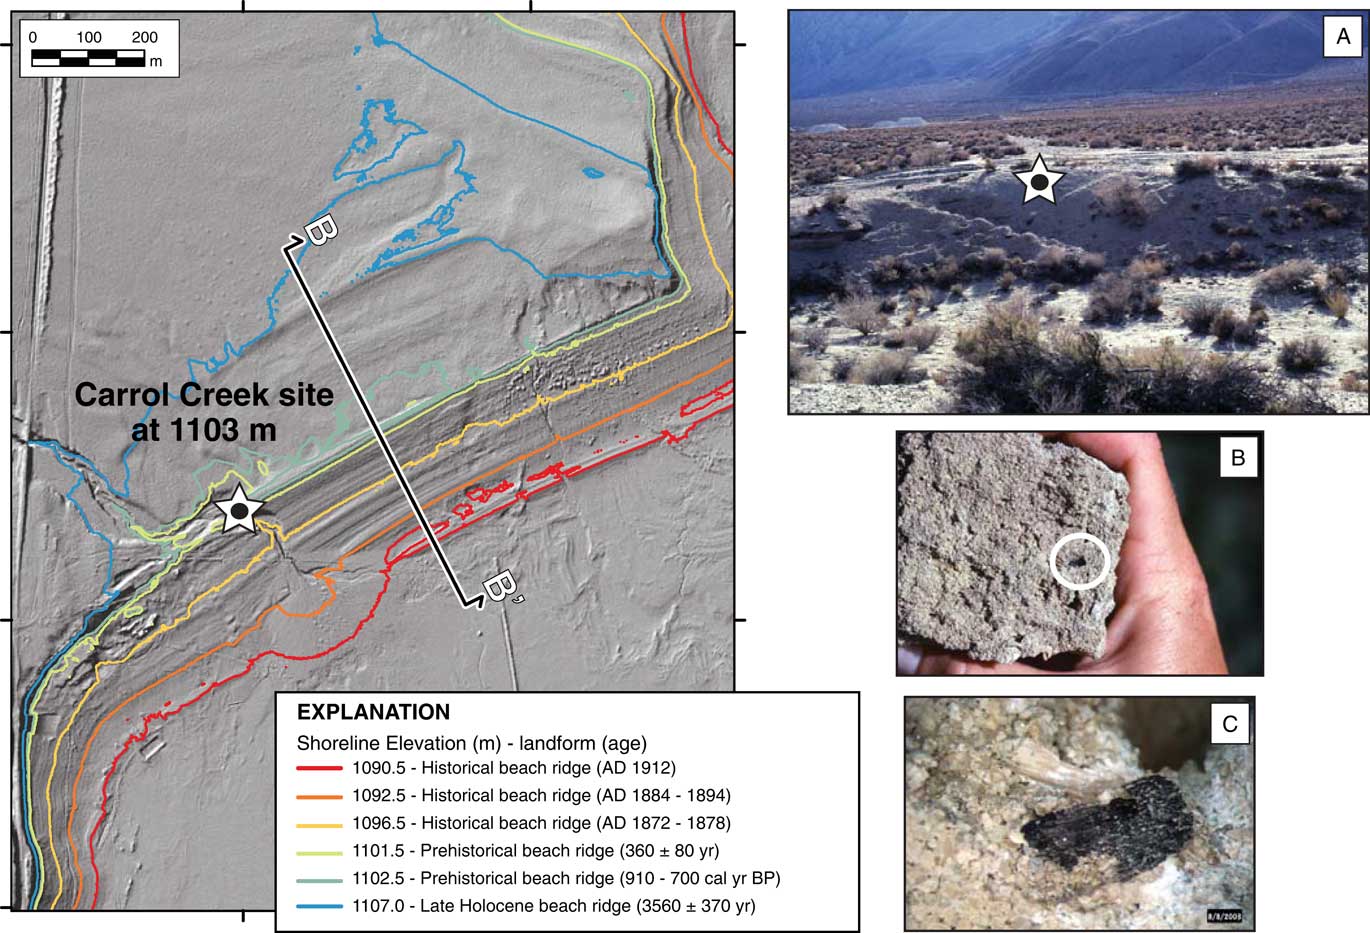
Age control of the 1103-m shoreline is from detrital charcoal sampled within a natural exposure at Carrol Creek, where it crosses a beach ridge at 1103 m on the northwestern margin of the lake basin (Fig. 1 and 6). Similar to other well-preserved beach ridge complexes in the basin (e.g., Fig. 3), the Carrol Creek site has up to four well-developed shorelines in the form of beach ridges and wave-formed strandlines preserved at elevations of ~1108, 1103, 1101, and 1099 m, plus historical shoreline features at and below 1096 m (Fig. 1 and 4B). The charcoal sample was preserved in beach rock near the surface below the crest of a well-developed sandy beach ridge. Radiocarbon analysis of the charcoal yielded a date of 870±40 14C yr BP (910–700 cal yr BP) with a median probability age of 780 cal yr BP (Table 1).
(color online) Hillshade map and elevation contours showing a well-preserved and complete geomorphic record of late Holocene-aged shoreline features below an elevation of ~1110 m at the Carrol Creek site on the western margin of Owens Lake basin (Fig. 1). Location of geomorphic profile transect B–B’ (Fig. 4) is shown. Star on photographs: (A) shows the sample location of detrital charcoal at the crest of the 1103-m shoreline on the southwest face of the incised channel; (B and C) show close-up views of detrital charcoal in beach rock that yielded a 14C age of 910–700 cal yr BP, indicating Owens Lake had a Medieval Pluvial highstand during an intervening period of the Medieval Climate Anomaly. Hill shade and contours from 0.5 m resolution airborne laser swath mapping digital topographic data from EarthScope (2011).

The 14C age of ~780 cal yr BP provides direct evidence that water levels reached an elevation as high as 1103 m in Owens Lake basin during a major wet interval during the Medieval Climate Anomaly (MCA) in the western Great Basin, known as the Intervening Pluvial (Cook et al., Reference Cook, Seager, Heim, Vose, Herweijer and Woodhouse2010) or Medieval Pluvial (Adams et al., Reference Adams, Negrini, Cook and Rajagopal2015; Hatchett et al., Reference Hatchett, Boyle, Putnam and Bassett2015). The bristlecone pine tree-ring chronologies in the nearby White Mountains support a short period of extreme hydroclimate variability at this time with a 10–49 yr wet and anomalously cold interval centered at ~840 cal yr BP (Leavitt, Reference Leavitt1994; Hughes and Graumlich, Reference Hughes and Graumlich1996; Cook et al., Reference Cook, Seager, Heim, Vose, Herweijer and Woodhouse2010; Bale et al., Reference Bale, Roberston, Salzer, Loader, Leavitt, Gagen, Harlan and McCarroll2011; Salzer et al., Reference Salzer, Bunn, Graham and Hughes2014).
Little Ice Age high stands at 1101 and 1099 m (440–280 cal yr BP)
The 1101- and 1099-m shoreline features are the lowest pre-historical shorelines preserved in the lake basin. These features occur as a relatively narrow band of closely spaced beach ridges and intervening lake plains on gentle slopes or as wave-formed strandlines on relatively steeper slopes, where both feature-types are commonly eroded by younger alluvial fans or buried by eolian dunes (e.g., Fig. 2). The 1101-m beach ridge typically has heights of less than ~1.5 m, whereas the 1099-m beach ridge is less developed and more discontinuous with heights of less than ~1 m. An example of the paired beach ridges is preserved on a well-developed barrier spit 150–200 m wide and extending ~3.5 km across the floor of the playa in the southern sector of the lake basin near Olancha (Fig. 1). The beach ridges in the basin typically have a surface covered by a lag of sandy gravel underlain by massive to poorly stratified coarse sand to gravel with silt. The associated lake plain surfaces are typically covered by coarse sand to granules with rare gravel and a coating of platy tufa in areas of the delta complex and along the western and southern margins of the lake basin, whereas surfaces along the eastern playa margin consist mostly of fine-grained sediment with silt- and salt-rich crusts.
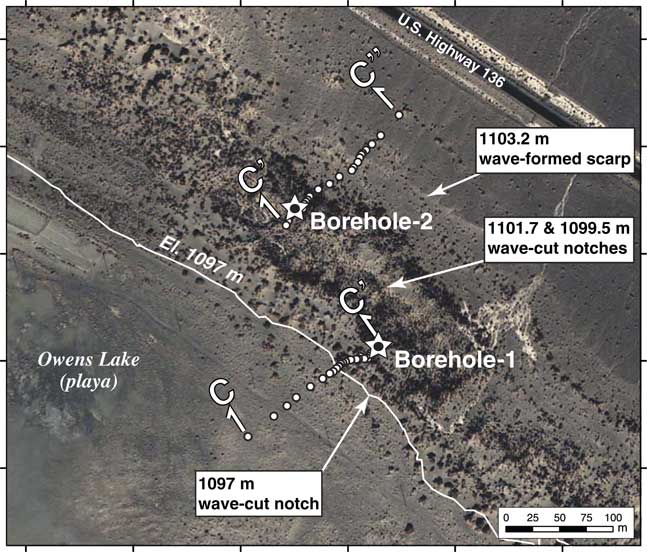
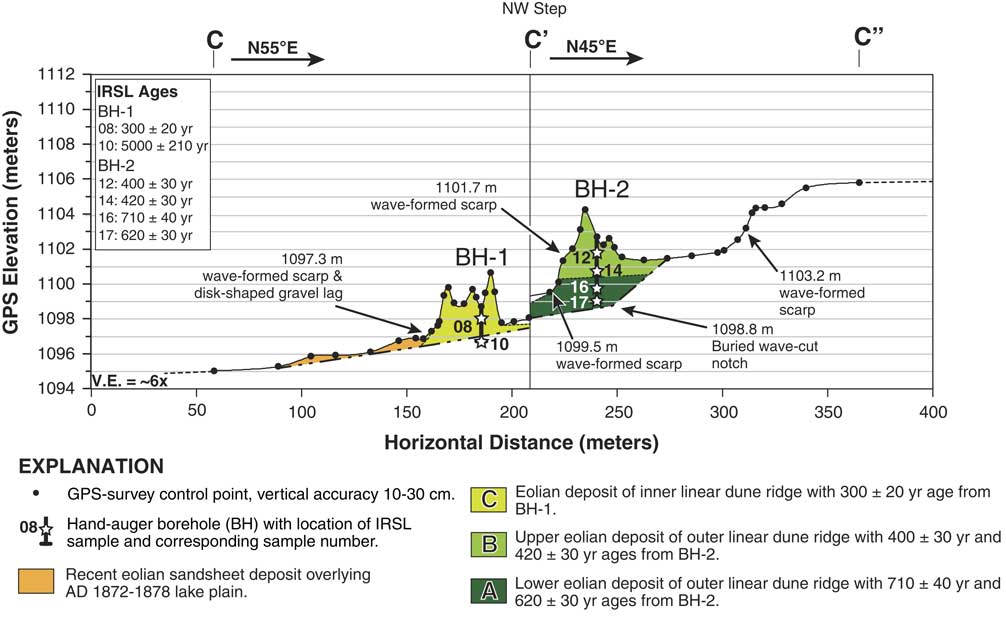
Age constraints for the 1101- and 1099-m shorelines are derived from crosscutting relations of wave-formed scarps with dated eolian sediment from a vegetated dune complex known as the Lizard Tail Dunes. The Lizard Tail Dunes consist of a set of 4–6 m high, vegetated linear dune ridges that accumulated parallel to a ~1103-m wave-formed scarp and lake plain in the northeastern margin of the lake basin, locally burying the scarp (Fig. 1, 2, and 7). The outer (landward) vegetated dune ridge appears cut by two over-steepened slopes or notches that range in height from 0.5 to 1.5 m along the southwestern face of the dune ridge (Fig. 7 and 8). Such features are absent on other vegetated dunes or active dunes in Owens Lake basin above 1103 m (Lancaster and McCarley-Holder, Reference Lancaster and McCarley-Holder2013; Lancaster et al., Reference Lancaster, Baker, Bacon and McCarley-Holder2015). The over-steepened slopes are within 0.5 to 0.7 m of the 1101- and 1099-m shorelines (Fig. 8) and we interpret them as wave-formed scarps formed at the 1101- and 1099-m lake stages. In addition, a similar zone of over-steepened slopes occurs at the base of the inner (lakeward) dune ridge at the Lizard Tail Dunes site (Fig. 7 and 8). Here, the inner dune ridge has a lag of well- to moderately rounded, disk-shaped gravel over massive sand at the toe of over-steepened slopes that are collectively situated at an elevation of ~1097 m, within 1 m of the historical water level of Owens Lake during the period AD 1872–1878. This area also was affected by the AD 1872 tsunami wave observed to have run-up ~60 m east of the shoreline along the northeastern margin of the lake (Smoot et al., Reference Smoot, Litwin, Bischoff and Lund2000).
(color online) Aerial imagery of the Lizard Tail Dune site on the northeastern margin of Owens Lake basin (Fig. 1 and 2) showing a vegetated, parallel linear dune system that has developed on the 1103-m lake plain. Wave-formed scarps at an elevation of 1103.2 m across distal alluvial fans, as well as wave-formed notches at 1099.5 and 1101.7 m on the outer dune ridge are shown. The location of wave-formed notches and beach ridges at ~1097 m formed by historical lake levels during AD 1872–1878 is shown at the base of the inner (basin ward) dune ridge. The locations of boreholes-1 and -2 (stars), as well as transects C–C’ and C–C” are shown across the crests of inner and outer dune ridges, respectively.

(color online) Geologic cross section along transect C–C’–C” (Fig. 7) of the Lizard Tail Dune site showing eolian depositional units (A–C) and the location of infrared-stimulated luminescence (IRSL) ages from hand-auger boreholes (BH)-1 and -2 at the crest of the inner and outer linear dune ridges, respectively. Erosional shoreline features at the elevations of 1103.2, 1101.7, 1099.5, and 1097.3 m are also shown. The ~1101- and 1099-m wave-formed scarps are constrained to 360±80 yr, based on crosscutting relations between the shoreline features and IRSL ages from dated sediments of the inner and outer dune ridges at the site.

Luminescence sampling from hand-auger boreholes (1 and 2) at the crests of the vegetated dune ridges bounding the erosional 1101-m and 1099-m strandlines constrains the ages of the wave-formed scarps (Fig. 7 and 8). Six samples were collected from several depths down to the base of the dunes using a sand auger, with a special sampler to allow collection of undisturbed samples that were not exposed to daylight. Luminescence analysis yielded six IR50 and PIR-IR225 ages, of which the IR50 IRSL ages are considered the representative age of sediment at the site (Table 2). The inner dune ridge was sampled to a depth of 2.5 m at the site of borehole-1 and produced two ages of 300±20 yr and 5000±210 yr at depths of 0.75 m and 2.0 m, respectively (Table 2). The lower sample at a depth of 2.0 m likely reflects the age of distal alluvial fan deposits underlying the dunes and 1103-m lake plain, rather than the basal age of the dune (Fig. 8). The outer dune ridge was sampled to a depth of 4.0 m at the site of borehole-2 and produced four ages. The upper two samples at depths of 0.87 and 2.0 m yielded ages of 400±30 and 420±30 yr, respectively, whereas the lower two samples at depths of 3.0 and 3.74 m yielded ages of 710±40 and 620±30 yr, respectively. Although the ages of the lower two samples are not in stratigraphic order, the ages are within 20 yr of their uncertainty (Table 2, Fig. 8).
Morphostratigraphic position, uniform sandy texture, and IR50 ages indicate three periods of sand accumulation at the borehole sites. The first period of sand accumulation occurred at 670±80 yr (Unit A) and buried the 1103-m lake plain and was followed by a second period of sand accumulation at 410±40 yr (Unit B; Fig. 8). The mean age of ~780 cal yr BP from the 1103-m beach ridge supports the ages at the base of eolian deposits (Unit A) that buried the 1103-m lake plain. The unit A ages indicate sand dune accumulation after a recession of at least ~5 m from the 1103-m water level down to an elevation below ~1098 m. Sand dune accumulation ceased after ~410 yr when fluctuating lake-levels reached the elevations of 1101 and 1099 m to form erosional shoreline features on the outer dune ridge of the Lizard Tail Dunes. A third and last period of sand accumulation occurred at 300±20 yr (Unit C) and formed the outer dune ridge above ~1098 m (Fig. 8). This accumulation was followed by shoreline erosion at elevations from 1096 to 1097 m during the period AD 1872–1878. In addition, the oldest age on alluvium at the base of the inner dune ridge indicates that Owens Lake water levels were below ~1097 m at 5000±210 yr. The ages of the 1101- and 1099-m shorelines are constrained to 360±80 yr, based on crosscutting relations of wave-formed scarps with dated eolian sediment.
The 1101- and 1099-m shorelines developed during a time of variable and extreme hydroclimatic conditions with mostly cooler temperatures in the Owens River watershed (e.g., Scuderi, Reference Scuderi1987b; Salzer et al., Reference Salzer, Bunn, Graham and Hughes2014). This period generally corresponds to a period of glacier advance in the Sierra Nevada and across North America during the Little Ice Age (LIA; Fig. 11; e.g., Bowerman and Clark, Reference Bowerman and Clark2011; Solomina et al., Reference Solomina, Bradley, Jomelli, Geirsdottir, Kaufman, Koch and McKay2016).
Medieval Climatic Anomaly low stands (1050–550 cal yr BP)
Radiocarbon analysis of in situ terrestrial vegetation at two different sites at and below 1096 m gives age information for periods of extremely low water levels in Owens Lake basin. The lower elevation site is at ~1085 m on the playa floor at a spring mound near the northeastern margin of the perennial brine pool in the basin (Fig. 1). Here, we sampled carbonized wood from a tufa-coated rooted stump in playa sediments that yielded a date of 990±60 14C yr BP (1050–760 cal yr BP) with a median probability age of 890 cal yr BP (Table 1). The higher elevation site is a natural exposure of a preserved alluvial terrace within the entrenched channel of the Ash Creek alluvial fan at ~1096 m in the western margin of the lake basin (Fig. 1). The Ash Creek site is situated locally below wave-formed strandlines and lake plains at 1103 and 1101 m, whereas historical shoreline features are situated ~150 m east of the site at ~1096 m. Here, we sampled carbonized wood from a stump rooted in a buried soil developed on sandy alluvium on the south wall of the stream channel that yielded a date of 720±70 14C yr BP (780–550 cal yr BP) with a median probability age of 670 cal yr BP (Table 1).
The age and elevations of dated rooted stumps provide new information on the timing and limiting elevations for pre-historical water levels in Owens Lake basin. After accounting for ~1 m of subsidence from the AD 1872 earthquake, the location and age of the tufa-coated stump at the Brine Pool site indicates that water levels were below ~1086 m prior to ~890 cal yr BP. We interpret the age of the stump to record the time of death of the shrub during a rise in lake level that killed the shrub at ~890 cal yr BP, an event followed by precipitation of a coating of tufa on the submerged remains of the vegetation. The location and age of the stump at Ash Creek indicates a period of surface stability and soil formation at ~1096 m, thus requiring lower lake levels at ~670 cal yr BP.
The low lake levels of Owens Lake constrained to ~890 cal yr BP occurred during the first episode of extreme and persistent drought during the MCA-1, first identified at Mono Lake with ~200 yr of low lake levels prior to ~840 cal yr BP (Stine, Reference Stine1994). Similarly, the period of low lake levels constrained to ~670 cal yr BP that followed the Medieval Pluvial high stand of Owens Lake occurred during the second episode of extreme and persistent drought during the MCA-2, also identified at Mono Lake (Stine, Reference Stine1994). The low stands of Owens and Mono lakes from 1050 to 550 cal yr BP coincided with extended drought conditions documented in other parts of the western Great Basin (e.g., Mensing et al., Reference Mensing, Smith, Norman and Allen2008; Cook et al., Reference Cook, Seager, Heim, Vose, Herweijer and Woodhouse2010).
Historical maximum shoreline at 1096 m (AD 1872–1878)
The earliest land survey in the region was the Van Schmidt Public Land Survey in AD 1856. The elevation of the water surface of Owens Lake was not recorded during this survey, but the lake area was measured at ~288 km2 (Lee, Reference Lee1915). Three well-preserved and conspicuous historical shoreline features encompassing Owens Lake playa were previously identified at elevations of ~1096, 1093, and 1091 m (e.g., Fig. 4). The oldest of these shorelines formed during a period of stable water levels at a historical maximum elevation of 1096.4 m with a corresponding lake area of 287.7 km2 in AD 1872 (Gale, Reference Gale1914; Lee, Reference Lee1915; Mihevc et al., Reference Mihevc, Cochran and Hall1997), a similar lake area compared to that measured earlier in AD 1856.
The historical maximum lake levels created laterally continuous and small-scale shoreline features around most of the margin of Owens Lake playa in the form of wave-formed strandlines, beach ridges, lake plains, and discontinuous low-relief shoreline dunes (e.g., Fig. 2 and 4). The ~1096-m beach ridge has crest heights of less than 1.5 m and a surface covered by mostly coarse sand to granules with gravel and sparse vegetation (e.g., Fig. 4). Surfaces of the ~1096-m lake plain consist of moderately continuous and sandy areas with tightly spaced recessional strandlines with local areas on the floor of the playa that expose underlying fine-grained lacustrine sediments as a result of wind deflation (e.g., Fig. 2). The lake-plain surfaces are typically covered by coarse sand to granules with fine gravel in areas near the Owens River delta, and western and southern margins of the playa, whereas surfaces along the eastern and southeastern margins of the playa commonly consist of silt- and salt-rich crusts underlain by fine-grained lacustrine sediment.
Post-water diversion shorelines below 1096 m (AD 1884–1931)
In addition to the ~1096-m shoreline features, other shoreline features formed during the period AD 1884–1894 at an elevation of ~1093 m and at a slightly lower lake level of ~1091 m in AD 1912 (Gale, Reference Gale1914; Lee, Reference Lee1915; Mihevc et al., Reference Mihevc, Cochran and Hall1997). The ~3 m drop from its historical maximum lake level to ~1093 m was primarily the result of >25% less input to the lake from stream diversions in Owens Valley between AD 1884 and 1894. During this period, Owens Lake had relatively stable water levels and a slight rise in salinity of 72.5 g/L because of the balance between stream diversions and a period of relatively wet climatic conditions in the late AD 1880s and early 1890s (Winkle and Eaton, Reference Winkle and Eaton1910; Lee, Reference Lee1915). This wet period terminated at the onset of 10 yr of severe drought between AD 1895 and 1905 that, combined with continued stream diversions, caused an additional drop in water level of ~6 m to an elevation of 1086.6 m with a corresponding lake area of ~170 km2 (Lee, Reference Lee1915). Owens Lake became hypersaline during the drought with a salinity of 213.6 g/L by AD 1906 (Winkle and Eaton, Reference Winkle and Eaton1910). The biological productivity of Owens Lake was severely impacted at this time because the once prevalent brine shrimp and alkali fly populations of the lake became extirpated (Herbst and Prather, Reference Herbst and Prather2014) when salinity of the lake exceeded ~133 g/L (e.g., Dana and Lenz, Reference Dana and Lenz1986). The drought was terminated by an extreme wet period (AD 1905–1917), known as the twentieth-century North American pluvial (Cook et al., Reference Cook, Seager and Miller2011) that raised the surface of Owens Lake by ~4.5 m to an elevation of ~1091 m by AD May 1, 1912 (Lee, Reference Lee1915). Owens Lake water levels began to decline after AD 1913, even during the wet period, because of the beginning of major tributary stream and Owens River diversions to the Los Angeles aqueduct system, and by AD 1931 the lake had become a salt playa (Smith et al., Reference Smith, Bischoff and Bradbury1997).
The post-diversion water levels formed conspicuous recessional shoreline features around and on the floor of Owens Lake basin that are mostly preserved along the northwestern, western, and southwestern margins of the playa as sandy lake plains and beach ridges and wave-formed strandlines. The beach ridges at ~1093 and 1091 m generally have crest heights of less than 1 m and a surface covered by coarse sand to granules with gravel and sparse vegetation (Fig. 4). Surfaces of the ~1093- and 1091-m lake plains consist mostly of discontinuous and thin sandy areas with tightly spaced recessional strandlines between wind-deflated areas that expose fine-grained sediments (e.g., Fig. 2).
Reevaluation of sediment core OL97
Reevaluation of stratigraphic and lithologic descriptions and 14C dates from three shallow sediment cores (OL97PC-2, OL97A, and OL97C) was performed in light of the new age constraints on late Holocene shorelines from this study to provide an additional record of late Holocene lake-level variations. The OL97 cores ranged from 2.5 to 5.64 m long and were extracted from Owens Lake playa in AD 1997 (Li et al., Reference Li, Bischoff, Ku, Lund and Stott2000; Smoot et al., Reference Smoot, Litwin, Bischoff and Lund2000). The OL97 core sites were placed at an elevation of ~1083 m, close to the depocenter of the lake basin and near the OL92 core site of Smith and Bischoff (Reference Smith and Bischoff1997), and ~1 m higher and south-southwest of core OL84B of Benson et al. (Reference Benson, Burdett, Lund, Kashgarian and Mensing1997; Fig. 1).
The late Holocene stratigraphic sections of the OL97 cores differ from earlier cores (OL84B, OL87D, OL90, and OL92) taken from Owens Lake in that they are composed of interbedded sand and mud layers in contrast to either having a thick section of sand or mud (Lund et al., Reference Lund, Newton, Hammond, Davis and Bradbury1993; Smith and Bischoff, Reference Smith and Bischoff1997), thereby offering an opportunity to develop an association between the sedimentology (i.e., sediment texture and bedding) described in the cores and the corresponding water level. To do this, standard sediment core methodology (e.g., Smith et al., Reference Smith, Bischoff and Bradbury1997) and 14C calibration were first applied to develop a composite age-depth model from reported sedimentology and 14C dates from the cores. Secondly, sediment texture information from the cores in combination with a simple method for calculating deterministic wind-wave characteristics for deep water sediment entrainment (USACE, 1984, 2002) was used to estimate threshold lake-water depth to entrain different size particles at the bottom of Owens Lake, which, in turn, was used to reconstruct lake levels.
Sediment core age-depth model
The OL97 cores were initially analyzed by Li et al. (Reference Li, Bischoff, Ku, Lund and Stott2000) to infer hydroclimatic variability during the past 1000 yr based on measured variations in acid-leachable concentrations of Mg and Li, as well as δ18O values. The cores also were examined by Smoot et al. (Reference Smoot, Litwin, Bischoff and Lund2000) to document seismic-induced wave (i.e., tsunami) deposits in a lacustrine setting. Li et al. (Reference Li, Bischoff, Ku, Lund and Stott2000) did not rely on 14C dates from the cores because dated sediments determined to be historical in age yielded a reservoir age of ~1000 yr. Instead, Li et al. (Reference Li, Bischoff, Ku, Lund and Stott2000) developed an age-depth model based on using paleomagnetic secular variations. Smoot et al. (Reference Smoot, Litwin, Bischoff and Lund2000) also acknowledged the uncertainty in the reservoir estimation and applied a ~1000 yr correction to 14C dates from several mud units to establish age control in the cores.
The sediment in OL97 cores consist of sand units with thin beds and lenses of ostracode-rich sand and mud drapes, with mud layers having thin, pinch-and-swell sand laminae (Smoot et al., Reference Smoot, Litwin, Bischoff and Lund2000). The sand units were interpreted by Smoot et al. (Reference Smoot, Litwin, Bischoff and Lund2000) to be primarily deposited by storm waves as oscillatory ripples, whereas the mud drapes accumulated during quiet-water periods. In addition, they interpreted less common 10–30 cm thick mud units with laminations of graded sand or silt to represent periods of deeper-water conditions. A total of 11 mud units (Historical and A–J) and interbedded sand units were qualitatively described in the cores, of which seven mud units (Historical and A, C, D, F, H, and J) were 14C dated (Smoot et al., Reference Smoot, Litwin, Bischoff and Lund2000).
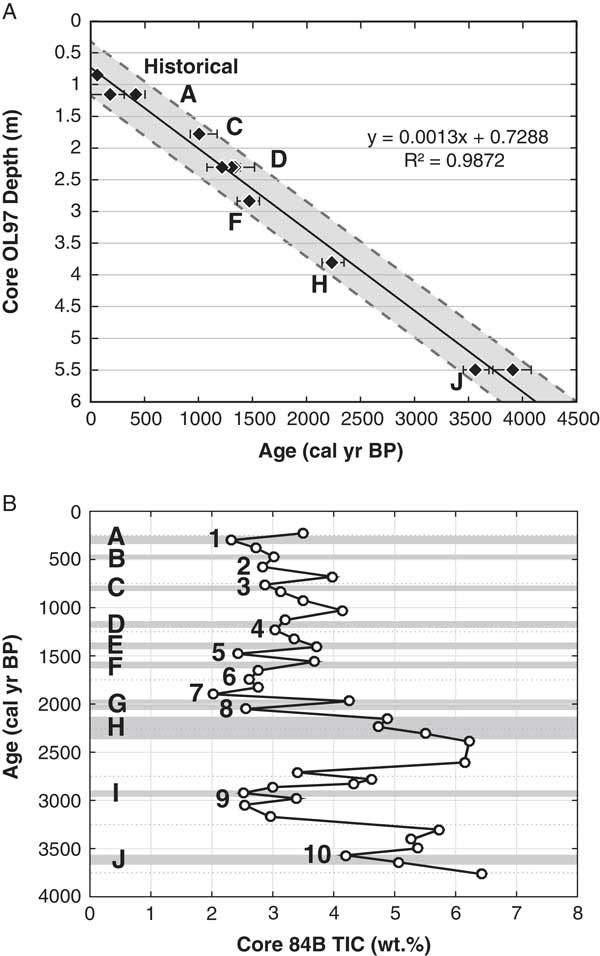
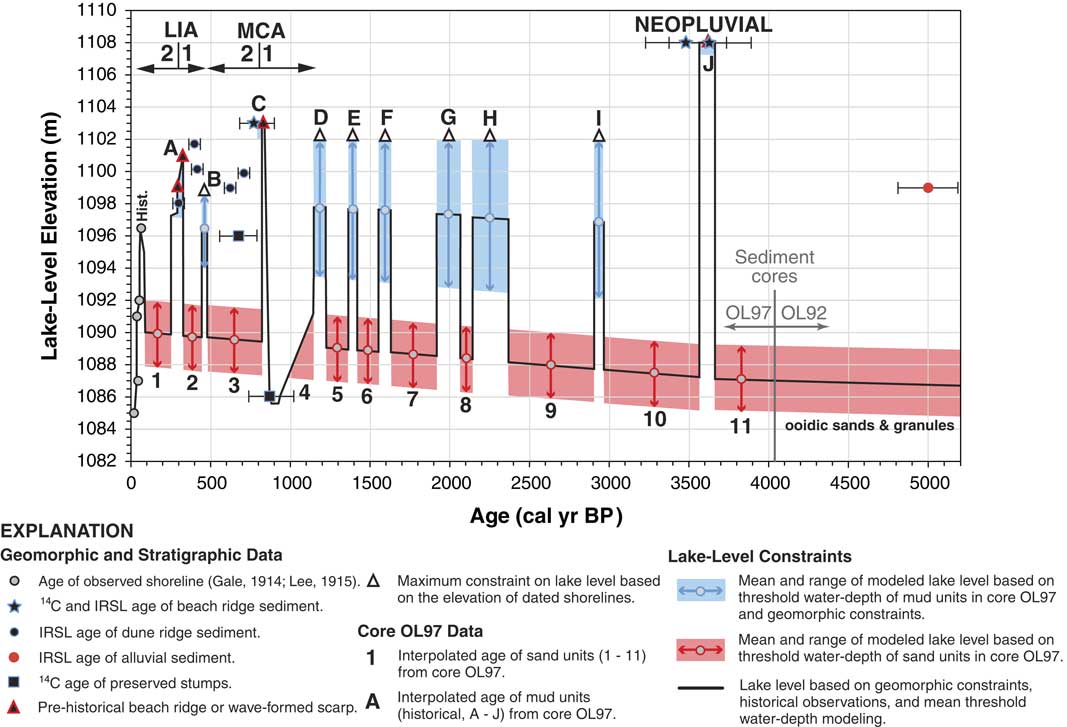
We developed a new composite age-depth model from the three cores to estimate mean calendar ages for mud units with multiple 14C dates (e.g., A, D, and J), as well as to assign interpolated ages to undated mud and sand units described in the cores (Table 3, Fig. 9A). Although slight variations in sedimentation rate are evident from the age and corresponding depths of mud units in the cores, we chose to model a linear and constant rate of sedimentation to best match independent age constraints from shoreline evidence (Table 3). A 1000-yr reservoir correction was applied to all 14C conventional dates to account for older carbon, based on a date of 1050±40 14C yr BP on organics from a historical mud unit in core OL97PC-2 that was underlain by a pebbly sand deposited during a tsunami in AD 1872 (Smoot et al., Reference Smoot, Litwin, Bischoff and Lund2000). This reservoir age estimate was supported by high Pb concentrations within the mud layers that bound the sandy tsunami deposit, produced from the operation of silver/lead-smelting plants near Owens Lake during AD 1869–1878 (Li et al., Reference Li, Bischoff, Ku, Lund and Stott2000; Smoot et al., Reference Smoot, Litwin, Bischoff and Lund2000).
Plots showing: (A) composite age-depth model with 1000-yr reservoir correction developed from reevaluation of data from Owens Lake sediment cores (OL97PC-2, OL97A, and OL97C) of Li et al. (Reference Li, Bischoff, Ku, Lund and Stott2000) and Smoot et al. (Reference Smoot, Litwin, Bischoff and Lund2000). Age of reported dated mud units in cores is shown and depth has been corrected for consolidation. Shaded area shows the 95% confidence interval of 14C ages, and (B) comparison of the total inorganic content (TIC) record of core OL84B (Benson et al., Reference Benson, Kashgarian, Rye, Lund, Paillet, Smoot, Kester, Mensing, Meko and Lindstrom2002; Benson, Reference Benson2004) and sedimentologic record of core OL97. Given the different age-depth models of the cores, there is strong correspondence of the frequency of late Holocene Owens Lake expansion inferred from the age of peaks with low TIC values (1–10) in core OL84B and age of mud units (A–J) in core OL97.

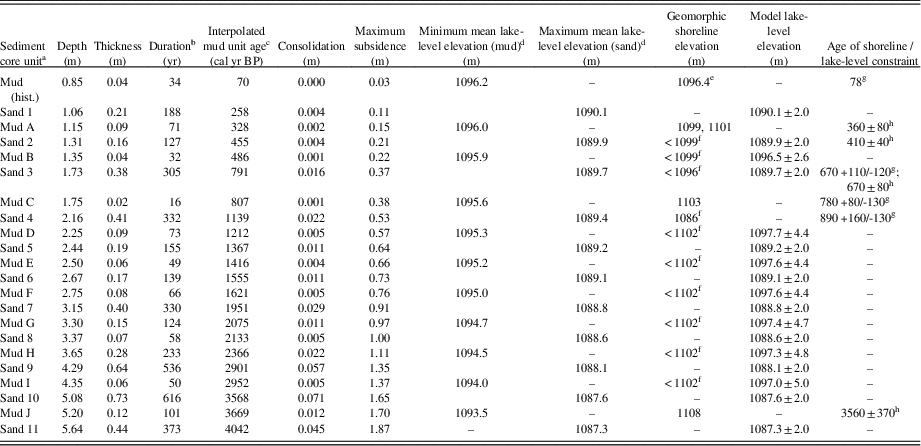
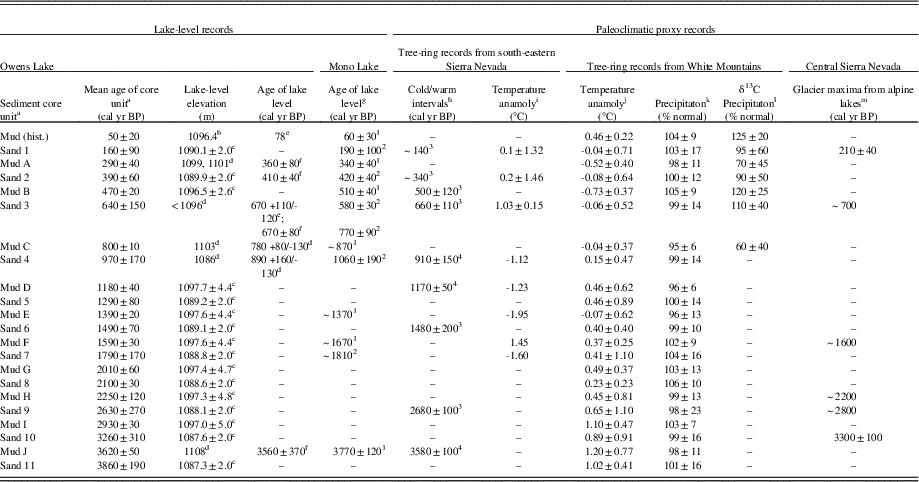
Interpolated ages for sand and mud units in sediment core OL97, reconstructed lake-level elevations based on threshold lake-water depth modeling of core OL97 sedimentology, and elevation and ages of shorelines in Owens Lake basin.

a Units in cores OL97 previously described by Smoot et al. (Reference Smoot, Litwin, Bischoff and Lund2000).
b Duration of unit sedimentation is corrected for consolidation.
c Interpolated unit accounts for 1000-yr reservoir correction and consolidation, is age at base of unit, and relative to AD 1950.
d Mean lake-level elevations have an uncertainty of±2.0 m.
e Maximum lake level measured during AD 1872–1878 (Gale, Reference Gale1914).
f Lake-level constraint based on geomorphic or stratigraphic relations.
g Radiocarbon age cal yr BP (Table 1).
h IRSL age years (Table 2).
The new composite age-depth model of core OL97 is also supported by the total inorganic content (TIC) record from core OL84B since ~4000 cal yr BP (Benson et al., Reference Benson, Kashgarian, Rye, Lund, Paillet, Smoot, Kester, Mensing, Meko and Lindstrom2002; Benson, Reference Benson2004). The TIC content in the lake core is used as a proxy for relative water level, where low values indicate lake expansion and high values represent contraction. Given the uncertainty of the different age-depth models of cores OL84B and OL97, the TIC record in core OL84B sediments shows the same number and approximate age of prominent peaks with low values (1–10) to the number and age of mud units (A–J) in composite core OL97, demonstrating correspondence between the two core sites of the frequency of late Holocene Owens Lake expansion (Fig. 9B).
Sedimentation rates
Sediment in lacustrine settings consolidates with burial, requiring normalization of sediment thickness based on dry density or water content to allow direct comparison of recent and ancient sedimentation rates (e.g., Martin and Rice, Reference Martin and Rice1981; Davidson et al., Reference Davidson, Carnley, Lange, Galicki and Douglas2004). To evaluate the late Holocene sedimentation rate from core OL97 we used the water contents of ~62.7–51.3 wt% at depths of 1–24.61 m for silty clay layers reported in nearby core OL92 (Friedman et al., Reference Friedman, Bischoff, Johnson, Tyler and Fitts1997) to account for consolidation. The normalized water content versus depth data was fitted by a logarithmic trend line (R 2=0.96), similar to the presentation of compression test data of soil, where the void ratio of a soil decreases linearly with the logarithm of pressure (Handy and Spangler, Reference Handy and Spangler2007). The sedimentation rate of this study is 120 cm/ka based on the age-depth model with 14C dates corrected for reservoir effects, but increases to 130 cm/ka when accounting for consolidation of up to 0.34 m at the observed field depth of 5.64 m.
Threshold lake-water depth analysis
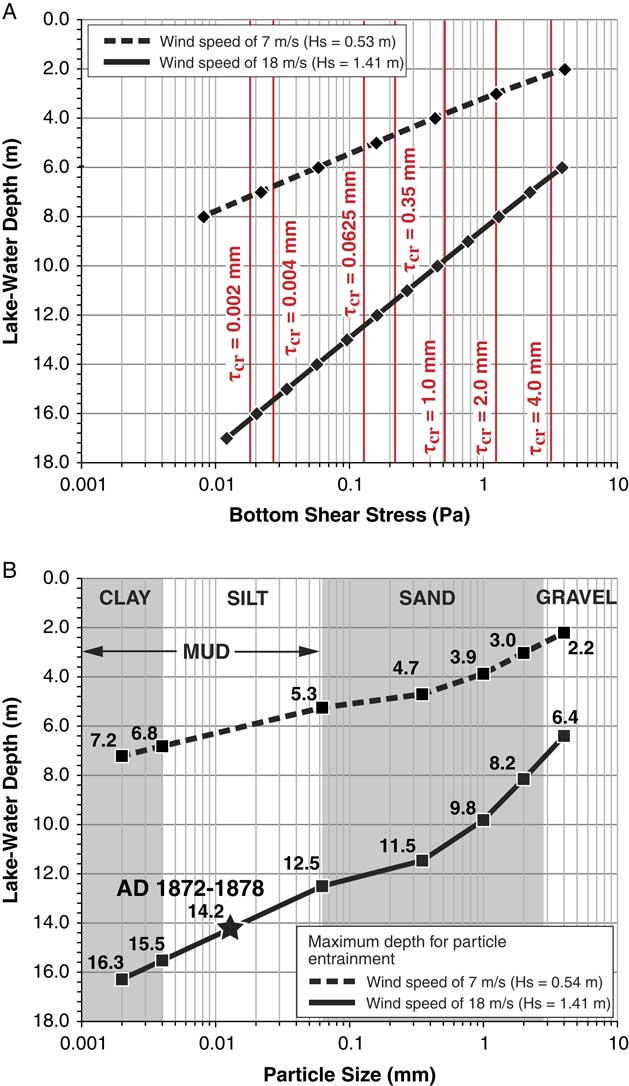
The erosion potential of lake-bottom sediments was assessed by modeling the threshold lake-water depths required to best match sedimentology described in core OL97 for the calibration period AD 1872–1878. The wind wave-generated bottom shear stress at the water-sediment boundary and critical shear stress for bottom erosion were calculated after the methods of USACE (1984, 2002). The hourly average wind speeds of 7 and 18 m/s for strong breeze and whole gale conditions, respectively, along with a maximum fetch length of 17 km were used in the model to simulate two wind event scenarios that would potentially define the effective wave base at the core OL97 site. The wave characteristic calculated by the wind-wave model include significant wave height (Hs), spectral peak wave period (Tp), and wave length (L). The wave characteristics driven by wind speeds of 7 and 18 m/s have values ranging from (Hs=0.53 m; Tp=2.85 s; L=12.70 m) to (Hs=1.41 m; Tp =3 .94 s; L=24.24 m), respectively. The wave characteristics at the wind speed of 7 m/s produced bottom shear stresses of 4.29–0.008 Pa at depths ranging from 2 to 8 m, whereas the wind speed of 18 m/s produced values of 4.1–0.13 Pa at greater depths ranging from 6 to 17 m (Fig. 10A). The critical bottom shear stresses were also calculated for seven particle sizes ranging from clay (0.002 mm) to fine pebble (4.0 mm; Fig. 10A). The threshold lake-water depth to initiate sediment entrainment was determined by iterating water depth until the ratio between the bottom shear stress below the wave crest and the critical bottom shear stress to entrain a given particle size exceeded 1.0.
(color online) Plots showing: (A) bottom shear stress at specific depths and critical shear stress (τcr) for bottom erosion of particles ranging from clay (0.002 mm) to very fine granule/fine pebble (4 mm), and (B) threshold lake-water depth to entrain the range of particle sizes. Average wind speeds associated with strong breeze (7 m/s) and whole gale (18 m/s) conditions, along with a maximum fetch length of ~17 km in AD 1872–1878 AD were used in the model to generate wind waves having significant wave heights (Hs) of 0.54 and 1.41 m, based on deterministic wind-wave and sediment entrainment modeling of deep-water conditions (USACE, 1984, 2002). The observed lake-water depth of 14.2 m in AD 1872–1878 AD is shown with a star.

Deposits characterized as mud typically contain particles less than 0.0625 mm (coarse silt/very fine sand) in size with mud units having particles mostly less than 0.005 mm in size (very fine silt; Fig. 10B; Ehlers and Blatt, Reference Ehlers and Blatt1982). The mud units described in the OL97 and nearby OL92 cores were previously inferred to represent periods of relatively deeper water conditions at depositional depths of 12–14 m, whereas the interbedded and coarser-grained sediment composed of sands and granules represent relatively shallower water depths of ~7 m (Smith, Reference Smith1997; Smoot et al., Reference Smoot, Litwin, Bischoff and Lund2000). In contrast, Li et al. (Reference Li, Bischoff, Ku, Lund and Stott2000) interpreted the mud units in the OL97 cores as being deposited in a shallow-water setting based on proxy evidence of high salt content peaks measured within the mud units. Our sediment entrainment modeling, however, shows that the threshold lake-water depth of mud-sized particles (0.0625–0.002 mm) under waves driven by wind events of 7 and 18 m/s at Owens Lake during AD 1872–1878 potentially reached depths between ~5–7 m and ~12–16 m, respectively (Fig. 10B). The modeling also shows that, under the same wind events, the sandy sediment composed of very coarse sand to very fine granule/fine pebble (2–4 mm) was potentially entrained at depths between ~2–3 and ~6–8 m, respectively (Fig. 10B). The range of particle sizes assigned to the mud and sand units in the model agrees with the particle-size distributions directly measured in several nearby cores with similar sedimentary units (e.g., Lund et al., Reference Lund, Newton, Hammond, Davis and Bradbury1993). The lake-water depth analysis presented here, however, would have a higher resolution if core OL97 data included measured particle size distributions at closely spaced sample intervals.
Lake-level reconstruction
We evaluated the threshold lake-water depth analysis for accuracy during calibration by comparing the modeled water depths and corresponding lake-level elevations with the measured lake-level elevation and equivalent water depth in AD 1872–1878. To do this, the elevation of the lake bottom of Owens Lake during this time relative to the depth of the historical mud unit and the core OL97 site elevation of 1083 m was reconstructed by accounting for settlement from consolidation and subsidence from active faulting. Settlement was estimated by correcting for consolidation, as previously discussed. Subsidence at the core site was estimated from combining the vertical slip rates for the Sierra Nevada frontal fault of 0.25±0.05 m/ka (Le et al., Reference Le, Lee, Owen and Finkel2007) and for the OVF near Lone Pine of 0.12±0.04 m/ka (Bacon and Pezzopane, Reference Bacon and Pezzopane2007) to provide a total subsidence rate of 0.37±0.09 m/ka across Owens Lake basin, given that the core OL97 site is located east and on the hanging wall of both fault zones (Fig. 1).
Accounting for depth, settlement, and application of a maximum subsidence rate of 0.46 m/ka to the historical mud unit, along with the difference between the elevation of the core OL97 site and the historical maximum lake level of 1096.4 m (Gale, Reference Gale1914; Lee, Reference Lee1915), provided a water depth of 14.2 m. The equivalent particle size at this depth is 0.013 mm (fine silt) based on the threshold lake-water depth analysis during a high-extreme wind event of 18 m/s (Fig. 10B). Applying the same corrections to the depth of the historical mud unit and adding a threshold lake-water depth ~14±2 m for mud units yields a modeled lake level of 1096.2±2 m (Table 3). The results of this analysis yielded a mean modeled lake level similar to the observed water level of Owens Lake in AD 1872. The reconstructed lake levels associated with prehistoric mud and sand units were calculated the same as the modeled historical lake level, requiring up to 1.92 m of correction for consolidation and subsidence at a depth of 5.64 m. The assignment of modeled water depths of ≥14±2 m for mud units and ≤8±2 m for sandy/pebbly (1–4 mm) units yielded reconstructed lake levels of 1092.5–1098 m and 1085–1092 m, respectively (Table 3). The range of threshold lake-water depths for the mud and sand units of this study is similar to the depositional depths of 12–14 m for the mud units in core OL97 inferred by Smoot et al. (Reference Smoot, Litwin, Bischoff and Lund2000), as well as the range in depositional depths of 7–14 m for the interbedded sandy and silty clay sediment in nearby core OL92 inferred by Smith (Reference Smith1997).
DISCUSSION
Refined late Holocene lake-level record of Owens Lake
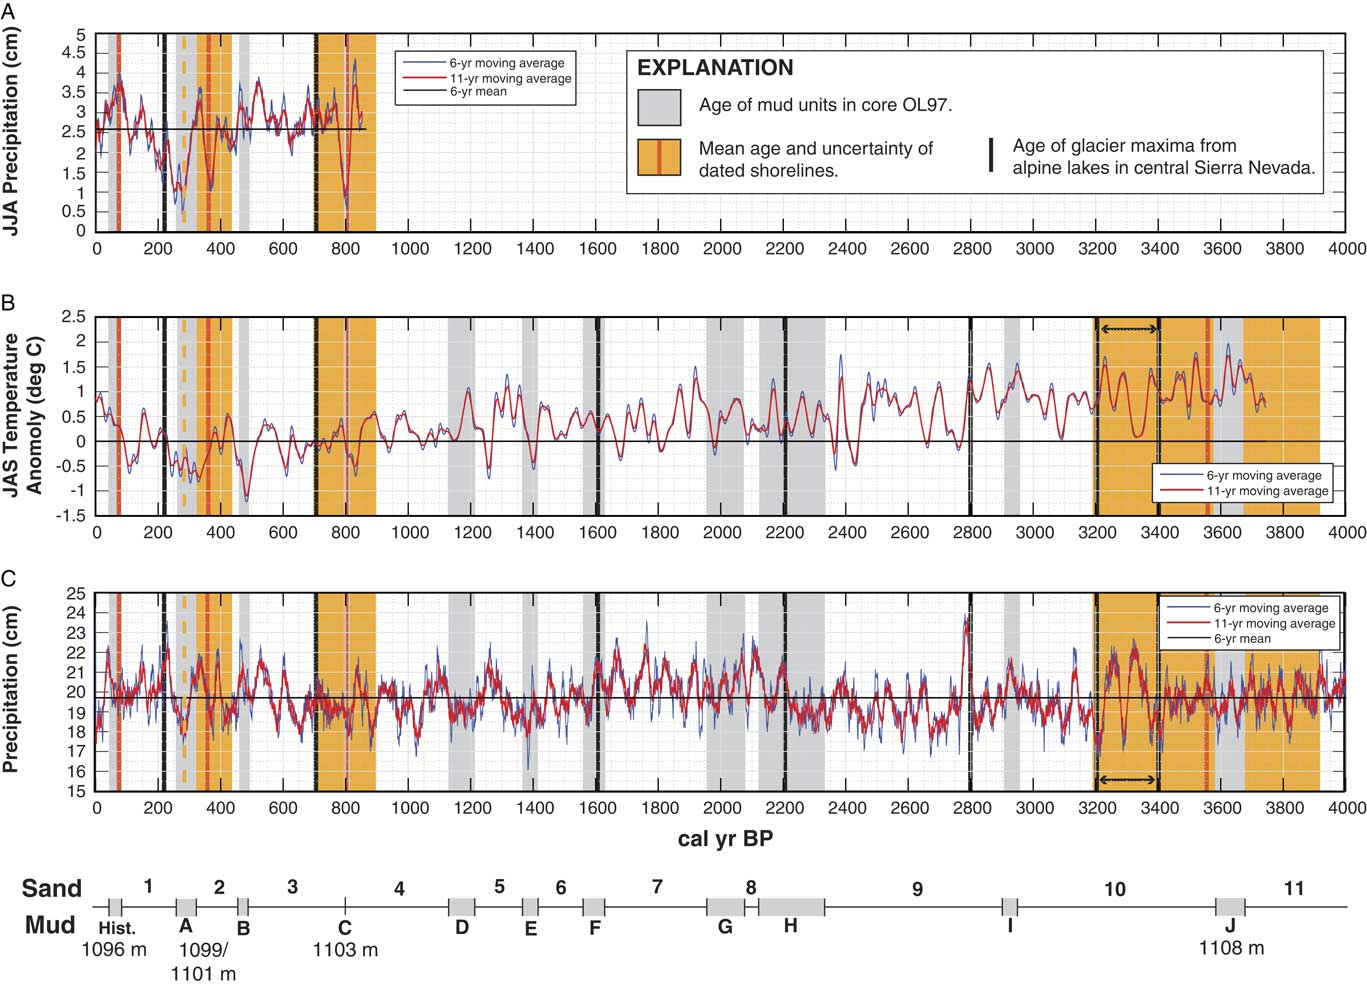
Here we update a summary of late Holocene Owens Lake fluctuations previously reported in Reheis et al. (Reference Reheis, Adams, Oviatt and Bacon2014) and based on Bacon et al. (Reference Bacon, Lancaster, Stine, Rhodes and Holder2013) with new limiting age constraints for water levels below 1096 and 1086 m, as well as estimates of the timing and elevation of lake levels without shoreline constraints from a new age-depth model and threshold lake-water depth modeling of sedimentology in core OL97. Integration of these new data offers a comprehensive and continuous characterization of the lake-level history of Owens Lake that, in turn, allows refinement of the late-Holocene portion of the lake-level curve (Fig. 11). The following discussion includes an accuracy assessment of the refined lake-level record by comparing the results of this study to the shoreline record of Mono Lake, as well as descriptions of modeled water-level variations of Owens Lake in the context of hydroclimate variability inferred from temperature- and precipitation-sensitive tree-ring chronologies and glacial records in the watershed.
(color online) Integrated lake-level record of Owens Lake from a new age-depth model of core OL97 sediment and data from nearby core OL92, threshold lake-water depth analysis, and new numerical ages for the 1108-, 1103-, 1101-, and 1099-m shorelines, plus low stands constrained to below 1096 and 1086 m. The age of mud (historical, A–J) and sand (1–11) units of core OL97 previously described by Smoot et al. (Reference Smoot, Litwin, Bischoff and Lund2000) are shown in relation to a range of potential lake levels based on threshold lake-water depth analysis of muddy and sandy/pebbly units driven by a wind speed of 18 m/s. The elevation and age of numerical ages from 14C and infrared-stimulated luminescence (IRSL) dating, as well as elevation constraints for water levels based on crosscutting relations with dated geomorphic features are shown. The periods of the (1) early and (2) late Medieval Climate Anomaly (MCA) and Little Ice Age (LIA), as well as the Neopluvial (or Neoglacial) are shown in relation to the lake-level record.

Comparisons between core OL97 and Owens and Mono Lake shoreline records
High-resolution sediment-core records have been obtained from major lake basins along the eastern Sierra Nevada (e.g., Owens, Mono, Walker, Pyramid, and Tahoe) to infer the frequency of decadal-centennial hydroclimate variability during the Holocene (e.g., Benson, Reference Benson2004, and references therein). Lake-level records from the region also have been used to evaluate temporal correspondence between high stands and regional-to-global climate change (e.g., Munroe and Laabs, Reference Munroe and Laabs2013). Our new modeling approach presents an example of how to directly link lake-core and shoreline lake-level data sets to produce continuous constraints on the timing, duration, and magnitude of oscillating water levels in terminal lake basins.
Geomorphic- and outcrop-based lake-level data provide independent control on the accuracy of core-based proxy interpretations (Reheis et al., Reference Reheis, Adams, Oviatt and Bacon2014). As a result, we assessed the accuracy of our modeling approach by evaluating temporal correspondence of 22 sand and mud units in core OL97 to the revised shoreline record of Owens Lake. We also compared the core OL97 and shoreline chronologies of Owens Lake to the well-constrained shoreline record of Mono Lake to further demonstrate temporal correspondence of lake-level fluctuations between adjacent terminal lake systems (Table 4).
Comparison of the age of sand and mud units in sediment core OL97 to dated shorelines in Owens and Mono Lakes and paleoclimatic proxy data from tree-ring and glacial records in the Owens River watershed.

a Sedimentary units in cores OL97 previously described by Smoot et al. (Reference Smoot, Litwin, Bischoff and Lund2000) with new age-depth model of this study (Table 3).
b Maximum lake level measured during AD 1872–1878 (Gale, Reference Gale1914).
c Modeled-level based on threshold lake-water depth modeling (Table 3).
d Lake-level constraint based on geomorphic or stratigraphic relations.
e Radiocarbon age cal yr BP (Table 1).
f IRSL age years (Table 2).
g Stine (Reference Stine1990, Reference Stine1994); 1, high stand; 2, low stand.
h Scuderi (Reference Scuderi1987a, Reference Scuderi1987b); three cold and four warm intervals inferred from changes in timberline.
i Scuderi (Reference Scuderi1993); extreme temperature anomaly for 20-yr moving means.
j Salzer et al. (2014).
k Hughes and Graumlich (Reference Hughes and Graumlich1996).
l Bale et al. (Reference Bale, Roberston, Salzer, Loader, Leavitt, Gagen, Harlan and McCarroll2011).
m Bowerman and Clark (Reference Bowerman and Clark2011).
Core OL97 and Owens Lake shoreline records
The age of Owens Lake high-stand shorelines of ~3560 yr, 780 cal yr BP, and 360 yr, as well as 78 cal yr BP for the historical lake level are within the range of ages for mud units J, C, A, and historical (hist.) in core OL97, respectively (Table 4, Fig. 11). Conversely, the timing of low stands at ~890 cal yr BP, 670 cal yr BP/670 yr, and 410 yr are within the range of ages for sand units 4, 3, and 2, respectively (Table 4, Fig. 11). The ages of the seven sand and mud units of core OL97 and timing of Owens Lake water levels from geomorphic evidence have significant temporal correspondence (R 2=0.9985, P<0.001), thereby demonstrating that the use of an ~1000-yr reservoir correction to 14C dates and development of a new age-depth model for core OL97 sediment was warranted.
Core OL97 and Mono Lake shoreline records
The watersheds of Owens and Mono lake basins are situated along the eastern side of the Sierra Nevada crest and share a common west-east oriented drainage divide (Fig. 1). The late Holocene lake-level record of Mono Lake is constrained by stratigraphic analysis of deltaic and shoreline deposits, as well as dating of buried stumps and woody material within interbedded fluvial layers exposed along stream banks (Stine, Reference Stine1990, Reference Stine1994). Similar to Owens Lake, the timing of Mono Lake low stands and high stands coincide with the age of sand and mud units in core OL97. The ages of Mono Lake high stands at ~3770, 1670, 1370, 870, 510, 340, and 60 cal yr BP are within the range of ages for mud units J, F, E, C, B, A, and hist., respectively (Table 4). Further, the ages of Mono Lake low stands at ~1810, 1060, 675, 420, and 190 cal yr BP are within the range of ages for sand units 7, 4, 3, 2, and 1, respectively (Table 4). The ages of the twelve sand and mud units of core OL97 and timing of Mono Lake water-level variations from stratigraphic evidence have significant temporal correspondence (R 2=0.9988, P<0.001). In addition, seven of the 12 Mono Lake low stands and high stands are represented in the shoreline record of Owens Lake (Table 4). A comparison between the shoreline records of Owens and Mono Lakes shows significant temporal correspondence (R 2=0.9976, P<0.001), indicating that, even with inherited geologic and dating uncertainties in the different studies, both records show that each lake basin responded in a similar manner to hydroclimatic forcing during the late Holocene.
Late Holocene hydroclimate variability
Hydroclimate (e.g., precipitation and temperature) extremes in the western United States are strongly affected by large-scale atmospheric circulation patterns that are modulated by interannual-decadal connections in the tropical Pacific, known as the El Niño–Southern Oscillation (ENSO; e.g., Dettinger et al., Reference Dettinger, Ghil and Keppenne1995; Cayan et al., 1999). The hydroclimate extremes are commonly reflected as interannual-interdecadal streamflow variability and persistence within snowmelt-dominated, dryland regions (e.g., Redmond and Koch, Reference Redmond and Koch1991; Vogel et al., Reference Vogel, Tsai and Limbrunner1998; Pagano and Garen, Reference Pagano and Garen2005). The relatively close correspondence between large-scale precipitation patterns and tree-ring variation patterns in some studies has demonstrated the utility of extending the history of precipitation patterns (and perhaps their climatic forcings) into the pre-instrumental past (Dettinger et al., Reference Dettinger, Cayan, Diaz and Meko1998).
Hydroclimate variability from tree-ring chronologies
Numerous studies in the western United States and Sierra Nevada have developed tree-ring reconstructions to infer precipitation variability and drought, streamflow, lake-level fluctuations, and snow water equivalent (e.g., Cook et al., Reference Cook, Meko, Stahle and Cleaveland1999, Reference Cook, Woodhouse, Eakin, Meko and Stahle2004; Meko and Woodhouse, Reference Meko and Woodhouse2011; Graham and Hughes, Reference Graham and Hughes2007; Adams et al., Reference Adams, Negrini, Cook and Rajagopal2015; Belmecheri et al., Reference Belmecheri, Babst, Wahl, Stahle and Trouet2015). In the Owens River watershed, tree-ring studies have provided records of hydroclimate variability of up to ~8000-yr long from precipitation reconstructions (e.g., Hughes and Graumlich, Reference Hughes and Graumlich1996; Hughes et al., Reference Hughes, Funkhouser and Ni2002; Berkelhammer and Stott, Reference Berkelhammer and Stott2008; Bale et al., Reference Bale, Roberston, Salzer, Loader, Leavitt, Gagen, Harlan and McCarroll2011), temperature reconstructions (e.g., Scuderi, Reference Scuderi1987a, Reference Scuderi1987b, Reference Scuderi1993; Salzer et al., 2009, Reference Salzer, Bunn, Graham and Hughes2014), and reconstructions of both precipitation and temperature (e.g., LaMarche, Reference LaMarche1974; Tolwinski-Ward et al., Reference Tolwinski-Ward, Tingley, Evans, Hughes and Nychka2015).
To assess the role of hydroclimate variability in controlling lake-level variations of Owens Lake, we used several tree-ring records of up to ~4000-yr long from the Owens River watershed to provide paleoclimatic proxy information (Fig. 12). These tree-ring time series were aggregated into discrete time intervals that match the ages of sand and mud units of core OL97. Temperature-sensitive tree-ring chronologies from a site west of Owens Lake in the southeastern Sierra Nevada were used for temperature information. This tree-ring record was developed from relic logs of foxtail pine (P. balfouriana Grev. and Balf.) with 14C dates and reflects warm and cold intervals inferred from changes in timberline (Scuderi, Reference Scuderi1987a, Reference Scuderi1987b), that also have corresponding temperature anomalies (Scuderi, Reference Scuderi1993; Table 4). An additional temperature-sensitive tree-ring chronology from bristlecone pine (P. longaeva Bailey) from the White Mountains was used and is based on the correlation of ring widths to summer (July–September) temperature meteorological data to estimate temperature anomalies relative to modern temperature (Table 4, Fig. 12B; Salzer et al., Reference Salzer, Bunn, Graham and Hughes2014).
(color online) Comparison of mud- (Historical, A–J) and sand-unit (1–11) ages from reevaluation of core OL97 data previously described by Smoot et al. (Reference Smoot, Litwin, Bischoff and Lund2000), plus the ages of shorelines at 1096, 1099, 1101, 1103, and 1108 m of this study with the White Mountain bristlecone pine tree-ring records: (A) precipitation reconstruction based on δ13C during the past 850 yr (Bale et al, Reference Bale, Roberston, Salzer, Loader, Leavitt, Gagen, Harlan and McCarroll2011); (B) temperature reconstruction during the past 3750 yr (Salzer et al., Reference Salzer, Bunn, Graham and Hughes2014); and (C) precipitation reconstruction during the past 4000 yr (Hughes and Graumlich, Reference Hughes and Graumlich1996). The timing of glacier maxima from alpine lake-core proxy evidence is also shown (Konrad and Clark, Reference Konrad and Clark1998; Bowerman and Clark, Reference Bowerman and Clark2011).

The same time-series aggregation also was performed for the precipitation-sensitive tree-ring chronologies developed from the Methuselah Walk bristlecone pine series from the White Mountains. These chronologies are based on either the correlation of ring widths to precipitation meteorological data (Fig. 12C; Hughes and Graumlich, Reference Hughes and Graumlich1996) or from analysis of carbon isotope ratios (δ13C) in cellulose that have been correlated to summer (June–August) precipitation meteorological data (Fig. 12A; Bale et al., Reference Bale, Roberston, Salzer, Loader, Leavitt, Gagen, Harlan and McCarroll2011). The reported precipitation values of the tree-ring records were converted into percent-of-normal precipitation relative to the length of the records shown in Table 4 to provide a simple index for comparing the precipitation anomalies to the timing of sand and mud deposition in core OL97.
Notable trends in the data set are from the temperature and precipitation tree-ring records from the White Mountains. These tree-ring records show that, on average, the mean and range in temperature anomaly and percent-of-normal precipitation values relative to the 6-yr moving mean have correspondence between sand and mud units in core OL97. The temperature-anomaly values associated with the ages of sand and mud units are 0.37±0.67 and 0.29±0.48°C, respectively. These data show that the mean and range in temperature-anomaly values associated with the sand units are ~25% greater compared to the values for mud units (Table 4). The tree-ring precipitation records have relatively similar relations to the temperature-anomaly data set, where the ~1000-yr long record of Hughes and Graumlich (Reference Hughes and Graumlich1996) displays corresponding percent-of-normal precipitation values for sand and mud units of 100.8±14.8 and 99.9±9.7%, respectively. These data indicate that mean precipitation for both the sand and mud units is similar, but the range in precipitation associated with the age of sand units is ~35% greater compared to the values for mud units (Table 4). The ~1000-yr-long δ13C-based tree-ring record of Bale et al. (Reference Bale, Roberston, Salzer, Loader, Leavitt, Gagen, Harlan and McCarroll2011) also has similar trends of percent-of-normal precipitation with values for sand and mud units of 98.3±50.0% and 93.8±32.5%, respectively. The ~1000-yr-long tree-ring record shows that mean precipitation associated with the age of sand units was ~5% greater than mud units but displayed a ~35% greater range in precipitation associated with sand units compared to mud units (Table 4).
Hydroclimate variability from glacial records
In the Sierra Nevada, the advance and retreat of glaciers are especially sensitive to changes in winter precipitation and summer temperature (Gillespie and Clark, Reference Gillespie and Clark2011). We used the Holocene glacial record from alpine lakes in the central Sierra Nevada to assess the role of alpine hydroclimate variability in controlling lake-level variations of Owens Lake (Fig. 12; Bowerman and Clark, Reference Bowerman and Clark2011). The reported ages of glacier maxima inferred from lake-core evidence below the Palisades Glacier in the Owens River watershed at 3300±100, ~2800, ~2200, ~1600, ~700, and 210±40 cal yr BP were compared to both the age of corresponding sand and mud units of core OL97 and the tree-ring records from the Owens River watershed (Table 4). Evaluation of these records showed that the timing of four of the six glacier maxima corresponded to the age of sand units in core OL97. Further, comparison of the timing of glacier maxima to the tree-ring record in the southeastern Sierra Nevada (Scuderi, Reference Scuderi1987a, Reference Scuderi1987b) also shows temporal correspondence between lowering of timberline during cold intervals and sand deposition in core OL97. These relations are supported by the timing of when glaciers in the central Sierra Nevada reached their Holocene maximum extent at 210±40 cal yr BP during the latter half of the LIA (LIA-1; Bowerman and Clark, 2010), which was also a time that corresponded to low lake levels in Owens Lake basin (Fig. 11, Table 4).
Tree-ring records from the White Mountains provided a more continuous record of hydroclimate variability during periods of glacier maxima. The glacial record has corresponding temperature anomaly values of 0.41±0.72°C and percent-of-normal precipitation values of 100.0±15.2% from the record of Hughes and Graumlich (Reference Hughes and Graumlich1996) and 102.5±50.0% from the record of Bale et al. (Reference Bale, Roberston, Salzer, Loader, Leavitt, Gagen, Harlan and McCarroll2011; Table 4). The ~4000-yr long tree-ring records showed that the range in both temperature and precipitation which corresponded to periods of glacier maxima were ~30% greater than the range of values for the remaining record (Table 4).
Hydrologic response of Owens Lake to hydroclimate variability
Comparisons of the frequency of sand and mud deposition in core OL97 to the tree-ring and glacial records in the Owens River watershed display a complex pattern of hydroclimate variability: wet/cold, wet/warm, dry/cold, or dry/warm (Table 4, Fig. 12). Data analysis revealed relatively good temporal correspondence between the magnitude of temperature and precipitation variability and the timing of sand and mud deposition in Owens Lake basin. Our analysis demonstrated that sand deposition (i.e., low stands) occurred mostly during periods with higher hydroclimate variability, whereas mud deposition (i.e., high stands) occurred primarily during times with lower hydroclimate variability. These relations link the hydrologic response of the Owens River-Lake system to two general patterns of hydroclimatic forcing during the late Holocene.
Contemporary stream discharge and water-level changes in lake basins of the Sierra Nevada are largely modulated by the magnitude of snowpack and rate of snowmelt runoff (e.g., Howat and Tulacyak, Reference Howat and Tulaczyk2005). Recent observations of snow-drought conditions in the Sierra Nevada (Harpold et al., Reference Harpold, Dettinger and Rajagopal2017; Hatchett and McEvoy, Reference Hatchett and McEvoy2018) may provide one of many possible hydrologic forcing mechanisms to explain the temporal pattern of late Holocene hydroclimate variability reflected in the lake-level record of Owens Lake, as well as in the glacier maxima record of the central Sierra Nevada (Bowerman and Clark, 2010). Snow drought in the context of hydrologic systems is either classified as “dry snow drought” because of a lack of winter precipitation or “warm snow drought,” where warmer-than-normal temperatures prevent precipitation from accumulating on the landscape as snowpack. Warm snow-drought conditions in the Sierra Nevada often influence significant winter flooding, early snowmelt runoff, reduce summer streamflow, and cause a decrease in perennial snow accumulation (Dettinger and Cayan et al., 1999; Harpold et al., Reference Harpold, Dettinger and Rajagopal2017; Hatchett and McEvoy, Reference Hatchett and McEvoy2018).
Warm snow droughts can force the hydrologic balance of river-lake systems to respond with a net lowering of lake levels over decadal to multidecadal timescales with persistent warm climate conditions, even during periods with near-normal winter precipitation. Recent hydrologic modeling of the Walker Lake basin (Fig. 1), directly north of Mono Lake, demonstrates that a variety of frequencies and magnitudes of wetter years linked to total moisture transport and atmospheric river events can interrupt MCA-like megadroughts, while still producing regressive lake levels consistent with documented MCA low stands and drought durations (Hatchett et al., Reference Hatchett, Boyle, Putnam and Bassett2015, Reference Hatchett, Boyle, Garner, Kaplan, Putnam and Bassett2016). The Walker Lake modeling results under a megadrought climate offer a large-scale pattern of potential hydroclimate regimes that may explain the apparent correspondence of Owens Lake low stands to the timing of glacier maxima, including the Holocene maximum extent of the LIA, during periods with higher hydroclimate variability. We encourage further research of the hydroclimate required to support Holocene glaciers and snow persistence in the Sierra Nevada to better understand the hydrology of regional river-lake systems.
Lake-level oscillations of Owens Lake during the late Holocene
Many studies in the western United States have performed paleo-hydrological modeling along the north-central Sierra Nevada of megadrought climatic conditions to reconstruct precipitation (e.g., Graham and Hughes, Reference Graham and Hughes2007; Kleppe et al., Reference Kleppe, Brothers, Kent, Biondi, Jensen and Driscoll2011) or to identify potential storm-track activity and moisture transport during the late Holocene (e.g., Hatchett et al., Reference Hatchett, Boyle, Putnam and Bassett2015, Reference Hatchett, Boyle, Garner, Kaplan, Putnam and Bassett2016, Reference Hatchett, Boyle, Garner, Kaplan, Bassett and Putnam2018). Our results, based on integrated lake-core and shoreline records, showed that 75% of the ~4000-yr-long record of core OL97 is represented by 11 periods of primarily sandy deposition corresponding to modeled lake levels that were ~4–11 m below the historical maximum (Fig. 11). The corresponding low stands and tree-ring records indicated that periods with low stream discharge to the lake were mostly controlled by persistent and higher hydroclimate variability that lasted on average ~290 yr with a maximum duration of ~620 yr centered at ~3260 cal yr BP, soon after the Neopluvial high stand and a minimum of ~60 yr centered at ~2105 cal yr BP (Table 3). The frequency and duration of Owens Lake low stands were also in general agreement with periods of severe multidecadal to multicentennial droughts (i.e., megadroughts) documented in the western Great Basin and south-central Sierra Nevada during the late Holocene (e.g., Stine, Reference Stine1994; Benson et al., Reference Benson, Kashgarian, Rye, Lund, Paillet, Smoot, Kester, Mensing, Meko and Lindstrom2002; Mensing et al., Reference Mensing, Smith, Norman and Allen2008, Reference Mensing, Sharpe, Tunno, Sada, Thomas, Starratt and Smith2013; Cook et al., Reference Cook, Seager, Heim, Vose, Herweijer and Woodhouse2010).
The remaining 25% of the Owens Lake record was characterized by eleven periods of mostly mud deposition corresponding to lake levels that were ~4 m below and up to ~12 m above the historical maximum (Fig. 11). The corresponding high stands were primarily controlled by relatively high stream discharge to the lake during periods with persistent and lower hydroclimate variability that lasted on average for ~80 yr with a maximum duration of ~230 yr centered at ~2250 cal yr BP and a minimum of ~20 yr centered at ~800 cal yr BP during the Medieval Pluvial (Table 3). The integrated core OL97 and shoreline records showed that Owens Lake high stands coincided with periods of global-scale climate change with transgressions of up to ~25 m during the Neopluvial (or Neoglacial), ~18 m during the Medieval Pluvial of the MCA, and ~11–13 m during the LIA-1 (Fig. 11).
CONCLUSIONS
We refined the late Holocene Owens Lake lake-level history by mapping, as well as 14C and luminescence dating of four previously undated shorelines above the historical maximum lake level of ~1096 m last occupied during AD 1872–1878. Dates of 3560±370 yr from a beach ridge at 1108 m, 910–700 cal yr BP from a beach ridge at 1103 m, and a constraining age of 360±80 yr for erosional shorelines at 1101 and 1099 m coincide with periods of persistent and mostly lower hydroclimate variability during the Neopluvial, Medieval Pluvial, and LIA, respectively. New dates from rooted stumps below the historical lake level also indicated two periods of low water levels associated with persistent and higher hydroclimate variability ending at ~890 cal yr BP and that occurred ~670 cal yr BP, nearly synchronous with the timing of eolian sand deposition in Owens Lake basin and multi-centennial low stands documented nearby at Mono Lake during the MCA.
Reevaluation of core OL97 data and application of a ~1000-yr reservoir correction enabled us to produce a new age-depth model for Owens Lake sediments during the past ~4000 yr. Our new age-depth model of OL97 data and interpretation of mud units as being deposited in deep lakes coupled with threshold lake-water depth estimates from wind-wave sediment entrainment modeling have produced a lake-level record of Owens Lake that agrees well with proxy evidence of climate change from lake-level constraints of dated shorelines of Owens and Mono Lakes, as well as from tree-ring and glacial records from sites within the Owens River watershed. The strong correspondence of the timing of modeled lake-level variations of Owens Lake from this analysis with watershed-paleoclimatic proxy records of hydroclimate variability provide confidence in the approach developed in this study to estimate the timing, duration, and magnitude of regional climate change. Our integrated approach to generate a continuous lake-level record with well-constrained oscillating water levels will afford a unique opportunity to perform hydrologic water-balance modeling of the Owens watershed-lake system and characterize the pattern of hydroclimate variability along the south-central Sierra Nevada during the past ~4000 yr.
ACKNOWLEDGMENTS
Funding for this work was provided by the Great Basin Unified Air Pollution Control District (GBUAPCD) with contributions from the General Frederick Lander Endowment, as well as by the National Institutes for Water Resources/U.S. Geological Survey #G16AP00069 and National Science Foundation EAR #1252225 to S. Bacon. The authors acknowledge Sondra Grimm of GBUAPCD for assistance with fieldwork. Many discussions with Thomas Bullard throughout the study and his review of an earlier version of the manuscript are gratefully appreciated. We also thank Roger Kreidberg for editorial review of an earlier version of the manuscript. We acknowledge Adam Csank for providing the Hughes and Graumlich (Reference Hughes and Graumlich1996) Methuselah Walk bristlecone pine tree-ring chronology. The authors thank Ken Adams, Robert Negrini, and Quaternary Research Editors for providing constructive and thoughtful reviews that greatly improved the manuscript.
SUPPLEMENTARY MATERIALS
For supplementary material referred to in this article, please visit https://doi.org/10.1017/qua.2018.50