


It is commonly acknowledged that WWI had serious effects on the world economy (Broadberry and Harrison Reference Broadberry, Harrison, Broadberry and Harrison2005). For Germany, the war and its immediate aftermath reversed the catch-up in labor productivity with the United States and the United Kingdom. While Germany (1924–1929) saw some economic prosperity (e.g., Balderston Reference Balderston1993, p. 73; Broadberry Reference Broadberry1998; Ritschl Reference Ritschl2008, p. 554; Spoerer and Streb Reference Spoerer and Streb2013, pp. 49–50), the Great Depression sealed the Weimar Republic's final economic, social, and political collapse. Textbooks on German economic history refer to these relatively favorable Weimar years as “shaped by euphoric belief in progress and rationalization” (Spoerer and Streb Reference Spoerer and Streb2013, p. 51) and breeding a “rationalization wave in industry” (Knortz Reference Knortz2010, p. 126). As Table 1 suggests, labor productivity had indeed risen substantially in major industries relative to pre-war levels over the rationalization boom when the recession years set in; and in terms of comparative labor productivity in manufacturing, Germany had overtaken the United Kingdom once more.Footnote 1
LABOR PRODUCTIVITY IN SELECTED INDUSTRIES OVER THE RATIONALIZATION BOOM (1925=100)

a Labor input measured in hours worked.
Sources:
Labor productivity in selected industries is from Balderston, “The origins and course,” (1993, p. 438). Comparative labor productivity estimates are from Broadberry and Burhop, “Comparative productivity,” (2007, pp. 346–47).
The generally accepted narrative of the Weimar rationalization can be constructed as follows. WWI widely delayed the first tentative attempts to introduce new technology and business practices in the late Empire (Knortz Reference Knortz2010, p. 126). In its aftermath, German managers took up modernization again, strongly guided by the U.S. example of Fordism and Taylorism (Vahrenkamp Reference Vahrenkamp1984, pp. 10–11; James Reference James1985, p. 146; Kleinschmidt Reference Kleinschmidt1993, pp. 208–19; Balderston Reference Balderston2002, pp. 74–76). Rationalization in industry took the form of implementation of new technology and capital deepening (“technological rationalization”); experimentation with new management practices in combination with standardization and typing (“organizational rationalization”); and by market restructuring through corporate concentration and closure of inefficient plants (“structural rationalization”) (James Reference James1985, p. 146; North Reference North2005, p. 296; Jopp Reference Jopp2015). The partly self-inflicted Great Depression almost immediately brought the rationalization movement and productivity gains to a halt, in turn revealing the many remaining weak spots, such as a “complete lack of well-defined aims and objectives” creating a mishmash of individual measures but no common thread (Brady Reference Brady1933, p. 418); excess capacities, most prominently in the iron and steel industry (Brady Reference Brady1933, p. 138; Balderston Reference Balderston1993, pp. 366”69; Kleinschmidt Reference Kleinschmidt1993, p. 363);Footnote 2 and still insufficient “industrial and inter-industrial coordination” hindering the optimal diffusion of knowledge (Brady Reference Brady1933, p. 250). As a result, the rationalization movement is often associated with a destabilization of markets and with being an endogenous factor in explaining the Great Depression in Germany.Footnote 3
I argue here that this is an incomplete characterization of the Weimar period and that what has been ignored to date is application of a proper measure of the rate of technological progress, such as industry-level total factor productivity (TFP). Having such a measure enriches our understanding of the German rationalization wave, and allows a differentiation between the public discourse on rationalization and the impact of those measures actually taken in the various industries (e.g., Freyberg Reference Freyberg1989, pp. 23, 308–20; Shearer Reference Shearer1989, Reference Shearer1995; Lippert Reference Lippert1994, p. 168).Footnote 4 I provide the first estimates of TFP for German coal mining over the extended period 1913–1938 by applying Stochastic Frontier Analysis to a set of 56 coal-mining firms operating in the Ruhr coal district and estimating a micro-level founded production function based on three inputs: labor, capital, and geology. From the production function parameters, I then recover TFP growth.
Several considerations guided my choice of time period, industry, and methodology. First, any account of technological progress over the Weimar rationalization wave should be put into a broader temporal perspective shifting the focus from 1924–1929 to 1913–1938. Second, according to the historical narratives, coal mining was an industry for which rationalization was crucial; some, such as Harold James (Reference James1985, p.153), argue that coal mining may have even been one of only two industries that saw any “powerful rationalization movement” (with the automobile industry being the other). Focusing on the Ruhr coal district is justified, as it was, by far, Germany's, and also Europe's, biggest hard coal producer at the time, and, as such, it was the major driver of coal production and of labor productivity on the national level.Footnote 5 Its growth in output per man-shift made the Ruhr the second-fastest growing district in Europe over 1913 to 1937 (72 percent overall) behind the Netherlands (116 percent), which had produced much less coal though, and way ahead of the below-average U.K. coalfields (Scott Reference Scott2006, p. 23). Coal mining supplied a crucial raw input for the iron and steel (processing) and chemical industries as well as important fuel for the transport and utilities sectors; coal, too, was an important consumer good in that it provided private households' heating (Verein für die bergbaulichen Interessen 1935, p. 49; Holtfrerich Reference Holtfrerich1973, p. 168; Gillingham Reference Gillingham1985, p. 5; Parnell 1994, p. 29).Footnote 6 Third, my use of Stochastic Frontier Analysis in combination with a translog production function allows for a convenient decomposition of TFP change into three drivers, namely technical efficiency change, scale efficiency change, and technical change, consistent with a movement toward or away from the production frontier, a movement along the frontier, and a movement of the frontier itself.
I find, despite the post WWI recession and that in the early 1930s, that average TFP growth in Ruhr coal mining over the entire study period was positive, at 1.7 percent, strongly outpacing coal's pre-war performance (Burhop and Lübbers Reference Burhop and Lübbers2009, pp. 510–11), even with pronounced negative TFP shocks occurring during WWI and in 1919, at the height of the Great Inflation in 1923, during 1930–1932, and in 1938. Weimar's rationalization boom reflects in an average TFP growth rate of plus 4.7 percent (exclusive of 1923/24). More importantly, and in some accordance with the work of Alexander Field (Reference Field2011), I also find that average TFP growth over 1934–1937 at 5.3 percent even exceeded that of the late 1920s.Footnote 7 My estimates indicate that the Nazis must have heavily capitalized on Weimar's rationalization movement in the coal industry. Put differently, if the rationalization movement had not happened the way it did, TFP growth and, conditional on it, labor productivity growth would not have been as high as they were. This would have likely increased resource scarcity and caused additional frictions in the process of preparing for war.
COAL MINING IN THE RUHR VALLEY AND RATIONALIZATION
For some, the coal industry is an excellent example of German “organized capitalism” (e.g., Parnell 1994). From roughly 1850, coal was an important driver of the growth and development of the German economy, and coal continued to be an important sector well into the interwar period (Gillingham Reference Gillingham1985, p. 5; Parnell 1994, p. 29). With an average growth rate of roughly 6 percent, Ruhr coal output had risen steadily over the six decades prior to 1914. From 1861 to 1888, labor productivity climbed from 176 to 315 tons per man-year, but then stagnated at around 263 tons closer to the war.Footnote 8 In an attempt to explain the quantitative performance at the Ruhr before 1890, Carl-Ludwig Holtfrerich (Reference Holtfrerich1973, p. 109) estimated average TFP growth for the whole coal district at 1.7 percent over 1852–1874 and 1.3 percent over 1874–1892. Extending the period, Carsten Burhop and Thorsten Lübbers (Reference Burhop and Lübbers2009, pp. 510–11) argue that average TFP growth was zero over 1881–1913. Using firm-level capital stock estimates, they show that over this same period average capital intensity declined from around 7,500 marks per worker to 5,500. Thus, the continuing rise in Ruhr coal output over the three decades prior to 1913 owed primarily to extensive growth in labor and not to capital deepening or a positive rate of technological progress.Footnote 9
Although the first attempts to mechanize coal cutting and underground transport had already been made by 1913 (Burghardt Reference Burghardt1995, pp. 137–51), the share of coal mechanically cut amounted to well below 3 percent (Ziegler Reference Ziegler, Tenfelde, Berger and Seidel2013, p. 65). The outbreak of WWI stopped these initial attempts at modernization, as the industry was put on a war footing to produce as much coal as possible very quickly (Burghardt Reference Burghardt1995, pp. 132–66).Footnote 10 As shown in Figure 1, the share of coal mechanically cut rose to 20 percent during the inflation years 1920–1922, roughly equaling the percentage for the United Kingdom. This increase was likely due to the combination of the immediate post-war coal shortage and, despite (or, perhaps, because of) an increasingly unstable currency, a relatively favorable investment environment with low credit costs.Footnote 11 However, it also is clear that the degree of mechanization in coal cutting increased profoundly, to nearly 100 percent, as early as over 1925–1929, rendering coal cutting by hand (in combination with the use of explosives) almost redundant by the time the depression years set in.
THE SHARE OF COAL MECHANICALLY CUT IN THE RUHR COAL-DISTRICT AND IN THE UNITED KINGDOM

More precisely, mechanization took the form of pneumatic picks (or drill hammers; Abbauhammer) in combination with the cutter-scraper (Schrämmaschine). In addition, underground transport was mechanized with the conveyor belt (Schüttelrutsche) instead of horses; electrification was extended as well as ventilation and water-management improved; the common small multi-tasking groups (Gedingekameradschaften) were replaced by larger specialized one-task troops; and a formalized training program partly replaced the traditional on-the-job learning (Brady Reference Brady1933, pp. 71–84; Zimmermann Reference Zimmermann and Tenfelde1992; Burghardt Reference Burghardt1995, pp. 281–310; Bleidick Reference Bleidick, Tenfelde, Berger and Seidel2013, pp. 379–88; Ziegler Reference Ziegler, Tenfelde, Berger and Seidel2013, pp. 65–66). Contemporaries coined the term positive rationalization to encompass all the measures that would affect the production process directly (Wedekind Reference Wedekind1930, pp. 21–23). Negative rationalization, was used to refer to all kinds of structural measures meant to “annihilate the organism's nonviable limbs in order to save the healthy parts” (Wedekind Reference Wedekind1930, p. 15). Examples include the reduction of work points (Betriebspunkte) underground, the merger of two or more shaft mines (of the same firm!) into one larger operational unit, and the closure of mines considered inefficient. In fact, a notable wave of closures swept over the Ruhr coal mines between 1924 and 1929.Footnote 12 One could also put the merger and acquisition process on the fim-level under the negative rationalization heading (Jüngst Reference Jüngst1928, p. 8; Wedekind Reference Wedekind1930, pp. 15–19; Shearer Reference Shearer1995, pp. 489, 495).Footnote 13
I now construct a framework that enables us to measure the rate of technological progress in Ruhr coal mining in the face of the multiple challenges over the two decades from the end of WWI to the beginning of WWII.
Estimating Total Factor productivity from micro-level data
The Stochastic Frontier Production Function
At the center of my analysis is a stochastic production frontier derived from firm-level data. This frontier expresses the maximum possible output in an industry as a function of three components: (i) input factors; (ii) a two-sided random error accounting for idiosyncratic shocks and measurement bias; and (iii) a one-sided technical inefficiency term reflecting less-than-maximum output levels. Thus in the presence of technical inefficiency, a producer can potentially increase output without increasing input quantities, provided that the determinants of inefficiency are known and can be improved.
I start from a flexible translog production function (Christensen, Jorgensen, and Lau Reference Christensen, Jorgensen and Lau1973), estimated by the maximum likelihood method from firm-level panel data. Nested in the translog production function is a Cobb-Douglas technology, so we can use a likelihood ratio test to determine which specification better accommodates the data.Footnote 14 Formally, the model can be written as

with i, j, and t denoting the firm, input, and time indices, respectively.Footnote 15 Output is given by y, and inputs are denoted by x. In the translog model, the coefficients βj cannot be interpreted as partial output elasticities unless they were mean-corrected. The random error, vit , is assumed to be normally distributed with zero mean and variance σ2 vit ; hence, vit ∼ i.i.d. N[0, σ2 vit ]. The inefficiency term, uit , may follow different distributions (that is, exponential, half-normal, truncated-normal, or gamma).Footnote 16 Here, uit is assumed to follow a truncated-normal distribution with mean uit and variance σ2 uit ; hence, uuit ∼ i.i.d. N+ [μit, σuit 2].Footnote 17
Total Factor Productivity and Its Components
I define total factor productivity growth as output growth unexplained by input growth. Total factor productivity change (TFPC) for an industry can be derived from the parameters of the stochastic production frontier. Thus

where TFPC between two adjacent periods σ and t, as an index, is the product of technical efficiency change between the two periods (TEC), technical change between the two periods (TC), and scale efficiency change between the two periods (SEC) (Coelli et al. Reference Coelli, O'Donnell and Rao2005, p. 79). For visualization, I will express total factor productivity and its components in growth rates, rather than as indices fluctuating around one.
Technical efficiency of firm i in t, TEit , can be derived as the conditional expectation on the composed error.Footnote 18 TEC is constructed as the (output-weighted) average of firm-specific efficiency scores, where l and n represent the size of the cross-section in period σ and, respectively, period t:

Technical change is derived on the basis of a time trend included in equation (1) as the (output-weighted) average of firm-specific technical change, hence as
![\[
\begin{array}
{\text{TC}}_{{\text{s}},{\text{t}}}\left[\frac{1}{l}\sum_{i=1}^l \left(\frac{\partial \ln y_{is}}{\partial t}\right) +\frac{1}{n}\sum^n_{i=1}\left(\frac{\partial \ln y_{it}}{\partial t}\right)\right]/2.
\end{array}
\](https://static.cambridge.org/binary/version/id/urn:cambridge.org:id:binary:20170301100743951-0915:S0022050716001005:S0022050716001005_eqn4.gif?pub-status=live)
Finally, output-oriented firm-specific scale efficiency in the presence of a translog function can be written as

where RTSit
(“returns-to-scale”) denotes the scale elasticity for firm i at point in time t, which is defined as the sum of partial output elasticities; thus, 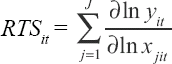 (Ray Reference Ray1998, pp. 188–89). When the most productive scale size is realized, RTSit equals one and scale efficiency equals 100 percent. Proportionally expanding or reducing input quantities once this point is realized would induce scale inefficiencies.Footnote
19
Industry-level scale efficiency change from σ to t may, again, be recovered from the estimation results as the (output-weighted) average over firm-specific scores, hence analogously to equation (3).
The sample of Ruhr coal-mining firms
Data Set
For the purpose of estimating equation (1), I constructed an original unbalanced panel covering 56 Ruhr coal-mining firms, providing 780 firm-year observations (see Appendix Table 1). More specifically, I collected data for 35 joint-stock companies (Aktiengesellschaften), 18 Gewerkschaften Neuen Rechts,Footnote 20 and three limited-liability companies (Gesellschaften mit beschränkter Haftung), of which 14 were vertically integrated (mostly foundry mines, or Hüttenzechen).
I obtained annual firm-level data on hard coal output in tons and the number of total mineworkers employed from the Jahrbuch für den Oberbergamtsbezirk Dortmund (since 1932 the Jahrbuch für den Ruhrkohlenbezirk) and from Die Bergwerke und Salinen im niederrheinisch-westfälischen Bergbaubezirk, published as a supplement to the Jahrbuch. Since work hours were subject to change in the study period, I used work hours, and not simply workers, as an input. This is challenging because I do not have firm-specific figures on shifts and hours per shift. Rather I inferred the average number of shifts per Ruhr coal worker from a series named output per man and shift in kilograms, constructed from several sources. In addition, I assume that the average shift lasted ten hours over 1914–1918 and 1924–1938, and 9.5 hours in the years in between.Footnote 21
Following the approach of Burhop and Lübbers (Reference Burhop and Lübbers2009), firm-specific capital stock was constructed from a great many commercial balance sheets, hand-collected from a variety of sources (that is, Jahrbuch für den Oberbergamtsbezirk Dortmund, Saling's Börsen-Papiere, Handbuch der deutschen Aktiengesellschaften, and Bestand S7 of the Westfälisches Wirtschaftsarchiv Dortmund). Although Gewerkschaften, unlike joint stock companies, were not obliged to publish annual business accounts, a fraction of them had voluntarily published them.Footnote 22 More specifically, I combined the accounting data with the perpetual inventory method, proposed by Eric B. Lindenberg and Stephen A. Ross (Reference Lindenberg and Ross1981), and Arvid Raknerud, Dag Ronningen, and Terje Skjerpen's (2007) method for correcting initial capital stock values. The procedure itself and measurement issues are detailed in Appendix 1.
It is important to ask whether one can generally trust the commercial balance sheets of the time. As Mark Spoerer (Reference Spoerer1995a, Reference Spoerer1995b, Reference Spoerer1998) notes in his seminal analysis of return-on-equity in German industry over 1925–1941, accounting rules offered opportunities to hide profits legitimately by building up hidden reserves. These came in the form of undervalued assets or overvalued liabilities. A common way to undervalue fixed assets was to write them down more quickly, with excessive depreciation rates (Spoerer Reference Spoerer1995b, pp. 64–68, 74–76). Since corporate income taxes were subject to marked increases in the interwar period, building up hidden reserves became an important issue for companies. Thus, the use of commercial balance sheets potentially biases any return-calculations. A more reliable source would be the tax balance sheets that, starting in 1925, joint-stock companies were obliged to draw up for the purpose of corporate income tax determination, as these balance sheets considerably lessened the opportunity to build up hidden reserves (Spoerer Reference Spoerer1995b, pp. 92–96).
Two factors, however, alleviate the problem of potentially biased accounting data. First, as the commercial balance sheet value of assets must be equal to or higher than the tax balance sheet value, we are, at worst, underestimating the true but unknown capital stock rather than overestimating it; so, more specifically, my estimates should be understood as reasonable lower bound estimates. Second, and more importantly, we have to distinguish between the firms' opportunities to build up hidden reserves and the actual extent to which they did so. If a company had no profits in the first place, there would have been nothing to hide. Spoerer (Reference Spoerer1995b, pp. 154–55) shows that mining companies actually realized quite low tax balance returns on equity from 1925 on and well into the early Nazi regime; a finding in line with the contemporary perception of mining firms' meager profit situation. Combined with Jörg Baten and Rainer Schulz's (Reference Baten and Schulz2005, p. 43) study on firms' profit during WWI, which found that the mining sector lost through war, it appears safe to say that the extent to which mining firms could have built up hidden reserves on their commercial balance sheets must have been rather low over much of the observation period. Hence, I feel confident in concluding that my capital data are reliable enough for the purpose of this article.
In addition to the standard inputs of labor and capital, geological factors play a key role in extractive industries affecting extraction costs and productivity (e.g., Zimmerman Reference Zimmerman1977; Hall and Hall Reference Hall and Hall1984, p. 365; Rodriguez and Arias Reference Rodriguez and Arias2008, p. 398).Footnote 23 I account for geology by incorporating the average depth at which a firm extracted coal in a given period into the production function's deterministic kernel.Footnote 24 While unobserved time-invariant site characteristics are accounted for by the fixed effects, geological characteristics varying with depth (such as roof pressure, temperature or water invasion) would be absorbed by the time trend if not otherwise accounted for. Thus, it is crucial to include average depth as an input to enable us to separate the influence of varying geological factors from other time effects that one may think of as technical change.Footnote 25 There is reason to expect the corresponding partial elasticity to have a negative sign, which meant that for a given input of labor and capital, output would be lower the greater the average depth of extraction. We have to consider two effects on output that counteract one another: on the one hand, the effect of those geological conditions that likely worsen with depth (e.g., roof and water conditions); and, on the other hand, the effect of conditions that may improve with depth (e.g., seam thickness). The elasticity's sign will actually tell us which effect is dominant. Based on accounts of the Ruhr district's geology (e.g., Burghardt Reference Burghardt1995, pp. 21–33; Bleidick 2013, pp. 358–60), I suspected that the elasticity is positive (on average) because better-quality seams lie deeper. To confirm this, I collected data from Joachim Huske (Reference Huske1998), which provides brief histories of every operating unit in the Ruhr coal district, including information on the progress in depth of extraction (Teufe) over time.
Descriptive statistics on coal output and the three inputs are displayed in Table 2. The average firm in the sample extracted about 2.2 million tons of coal from a depth of 565 meters, utilizing a total workforce of 8,161 and capital in the amount of 89 million marks/Reich marks. Average labor productivity amounted to 283 tons and capital intensity to not less than 11,700 marks/Reichmarks per worker. Compared to the averages for the German Kaiserreich, 1881–1913, average output doubled; labor input slightly more than doubled; and capital input almost quadrupled (Burhop and Lübbers Reference Burhop and Lübbers2009, p. 508). The average joint-stock company was significantly larger in terms of output and utilized labor and capital than the limited-liability company or the Gewerkschaft.
DESCRIPTIVE SAMPLE STATISTICS (1913–1938)

a Output, labor-hours, and capital are in millions.
Sources:
See the text.
Representativeness and Some Stylized Historical Patterns
My sample covers 71 percent of the Ruhr coal district's output on average. Coverage is slightly lower (55–67 percent) for the first half of the observation period and slightly higher (75–82 percent) for the second half. This corresponds to a share in Germany's total coal output of between 36 (1914) and 58 (1934) percent. The sample is sufficiently large to allow for general conclusions about the industry.
As depicted in Figure 2, estimated capital, at replacement costs, shows a marked increase of 89 percent over the war and a comparable decrease over its immediate aftermath; the capital stock increased again after rationalization and climbed to a new plateau of 3.75 billion Reichmarks.Footnote 26 Although increasing by 132 percent between 1914 and 1938, the capital stock declined again over 1933–1935. When the national socialists began to refigure the economy towards maintaining autarky in 1936, the capital stock increased, but did so rather modestly. The average depth of extraction continuously increased from about 520 to 640 meters between 1915 and 1938.
RUHR SAMPLE CAPITAL STOCK AND AVERAGE DEPTH OF EXTRACTION, 1914–1938

According to Figure 3, labor productivity, averaged over the sample firms, showed a marked V-shape corresponding with the pattern on the national level (Jopp Reference Jopp2015). The decline over the second half of the war has been attributed, in particular, to the absorption of less-qualified workers. With currency stabilization at the turn of 1923/24, labor productivity increased from about 75 tons per worker per year to about 440 tons towards the beginning of WWII. Except for the first six years of Nazi dictatorship, the pattern of labor productivity coincides well with the evolution of the capital intensity which I estimated to 6,700 marks per worker in 1914 and 14,100 marks in 1938 (a 110-percent growth).
RUHR SAMPLE LABOR PRODUCTIVITY AND CAPITAL INTENSITY, 1914–1938

Evidence ON TOTAL FACTOR PRODUCTIVITY OF RUHR COAL-MINING FIRMS
The Production Function
Based on a number of likelihood ratio tests concerning the functional form of the production frontier, all restricted specifications (e.g., excluding depth, technical change, interactions, or non-linearities), including the baseline Cobb-Douglas function, can be rejected as not properly accommodating the data.Footnote 27 Therefore I use the full translog specification with neutral and non-neutral technical change and depth of extraction as my third input.
Table 3 reports on the full translog model as my reference and, for illustrative purposes, on the Cobb-Douglas model. Neither model incorporates technical inefficiency effects (other than a constant).Footnote 28 The first panel shows the production function parameter estimates, while the middle panel reports additional statistics. The estimated parameters have been used to derive the output elasticities, displayed in the final panel. Evaluated at the sample means, we can say that Ruhr coal mining remained labor-intensive, but much less so compared to the pre-1914 period (Burhop and Lübbers Reference Burhop and Lübbers2009, p. 516). This is consistent with evidence on the generally high cost share of labor in coal mining at the time (Jüngst Reference James1924, pp. 13–50, 1931, pp. 496–517). The elasticity of capital input is unexpectedly low at 0.22 but exceeds the elasticity of depth (–0.02), which is negative, implying that going deeper costs output in net terms. Taken together, the evidence suggests that Ruhr coal mining operated with quite substantial decreasing returns to scale even after 1914, which, matches Burhop and Lübber's (Reference Burhop and Lübbers2009, pp. 516–17) findings for 1881–1913.
A STOCHASTIC PRODUCTION FRONTIER FOR RUHR COAL MINING, 1913–1938

aDependent variable is log of output. Labor, capital, and depth are in natural logs, as well. True fixed effects model is applied. Inefficiency term assumed to be truncated-normally distributed. No efficiency effects (besides constant) assumed.
Sources:
Author's own computations.
However, a more precise picture can be drawn by looking directly at annual averages over the firm-specific elasticity scores, which is appropriate since the translog specification allows elasticities to vary with input quantities and, thus, to vary over time. Figure 4 plots the annual partial elasticities and RTS. All series are output-weighted to take account of the firms' unequal size distribution. It turns out that coal was, in fact, mined with decreasing returns throughout the observation period, but not to the extent that the elasticities evaluated at the sample means would suggest. Furthermore, there is variation in RTS, suggesting that changes in scale efficiency occurred and, thus, mattered for TFP change. Interestingly, the partial elasticity of capital, when output-weighted, is negative for the first seven years and almost zero over 1927–1929, when the degree of mechanization of nearly 100 percent was reached. Finally, the partial elasticity of depth was positive throughout and exceeded that of capital (except for 1926). Thus, we can say that with increasing depth geological conditions improved, on average. The sensitivity of output to changes in the quantity of capital utilized still remains remarkably low.
ESTIMATED RETURNS-TO-SCALE IN RUHR COAL MINING

TFP and Its Components
I now examine the components of TFP. Figure 5 depicts the output-weighted estimates of mean technical (TE) and mean scale efficiency (SE) for the sample. Including (excluding) 1923, mean technical efficiency was 83.5 (86.4) percent in the study period.Footnote 29 The key implications can be summarized as follows: (i) TE decreased over the war from 93 percent to slightly over 80 percent, plummeting to poor 10 percent in 1923 when inflation peaked and the occupation of the Ruhr took place. It was slightly higher (92 percent) during the rationalization boom and the first years of Nazi dictatorship; (ii) TE dropped immediately after the war and remained below 80 percent as long as demobilization frictions prevailed; (iii) during the rationalization boom, TE recovered to a level of about 92 percent; (iv) during the depression years 1930–1932, TE declined to 83 percent but rapidly recovered to about 91 percent, where it stayed until 1936; and (v) over the last two years of the study period, TE dropped even below its level at the peak of the Great Depression in 1932, suggesting major frictions under the Four-Year-Plan regime.
ESTIMATED MEAN TECHNICAL AND SCALE EFFICIENCY IN RUHR COAL MINING

Mean SE in the study period was 94.1 percent. However, due to the weighting procedure, this does not necessarily mean that a large number of firms operated scale-efficiently. Rather, this means that a significant portion of coal was mined under conditions that are consistent with high SE, although this portion could have been produced by a rather small number of firms. Large firms, in my framework those above 2,500,000 tons annual production, produced around 55 percent of sample output before 1923, but they accounted for an even larger portion thereafter, reaching close to 90 percent in 1937. These firms' proportion rose from one-fifth to slightly more than one-half.
Moreover, plotted time effects, shown in Figure 6 suggest that the production technology almost continuously increased and with increasing speed. Technical change was negative over 1913–1917, which is compatible with the view that the war not only stopped early mechanization attempts, but also posed a serious problem to production, in that it diverted necessary resources away from mining. However, the production function began to shift outwards as early as in 1918. Throughout the early phase of rationalization, the speed of technical change did not accelerate to the degree that it had before and did again after 1927.Footnote 30
ESTIMATED TECHNICAL CHANGE IN RUHR COAL MINING

If I combine the estimates of TE, SE, and TC, I can estimate TFP growth in Ruhr coal mining. Figure 7 presents the growth rates year-by-year. Focusing on TFP growth first (Panel (a)), there were 11 negative productivity shocks: five during the war; three before currency stabilization (1919, 1921, and 1923); two during the Great Depression; and one in 1938. Of these shocks, those before 1924 were the largest, with TFP contracting by between four and 86 percent. Thus, there were 14 years with positive TFP growth. First, the growth in 1920 and 1922 should be highlighted, not the least because (sample) labor productivity (that is, here, output per man-hour) contracted (although the degree of mechanization had already increased). This finding does not well describe a problem-laden demobilization phase, often suggested in the qualitative historical accounts (e.g., Knortz Reference Knortz2010, pp. 35–114; Ziegler Reference Ziegler, Tenfelde, Berger and Seidel2013). Second, the rationalization boom saw positive TFP growth overall; the growth rate for 1924 is, of course, an outlier explainable only by the technical inefficiency shock of 1923. Third, I find continuous growth over the initial five years of Nazi dictatorship.
THE ESTIMATED GROWTH OF TOTAL FACTOR PRODUCTIVITY AND OF ITS COMPONENTS, 1914–1938


Panels (b) to (d) tell us more on the sources of TFP growth. Was TEC, the catching up to or falling short of the frontier, the main driver of TFP growth? Or, instead, was productivity determined by SEC, the movement along the frontier, and TC, the shift of the frontier? To answer these questions, I estimate the relative contribution of each component's growth to TFP growth, which is shown in Figure 8. I find that TEC determined at least 50 percent of TFP growth in 15 out of 25 observed years. In comparison, TC accounted for a comparatively large share in only six years (1928, 1931, and 1934–1937), and SEC accounted for such an explanatory share only in 1920 (60 percent). TEC, was, overall, the dominant source of TFP growth: (i) TEC dominated the beginning and final phase of the war; (ii) the marked drop in TFP in 1919 was due to a negative TE shock (≈ 89 percent); (iii) the phase 1921–1926, stretching over the peak years of inflation and over the first half of rationalization, likewise tells of TEC as the main driving force of productivity; (iv) with the exception of 1931, the negative TFP growth over the depression years 1930–1932 is also explained in large part by TEC; (v) and, finally, TEC was unimportant for only 1920, 1931, and the period 1934–1936, when SEC and TC had much more effect on TFP growth.
PERCENT OF TFP GROWTH EXPLAINED BY COMPONENT

Discussion
Table 4 summarizes the main empirical findings. First, average TFP growth in Ruhr coal mining was notably higher over the period 1924–1929 than it had been during the war and the inflation years and also well exceeded the long-term growth rates realized prior to 1913. Thus, we can confirm the existence of a rationalization wave in coal mining based on a proper measure of the rate of technological progress. Second, TFP growth over the first six years of Nazi dictatorship was even higher than during the Weimar rationalization period; this documents a rationalization wave carried forward, in fact, beyond the depression years 1930–1932 and the political caesura of 1933.Footnote 31
SUMMARY OF TOTAL FACTOR PRODUCTIVITY GROWTH BY SUB-PERIOD (IN PERCENT)

aThe growth rates in parentheses exclude the problematic years 1923 and 1924. Note that, due to the averaging process, TFP growth rates might not exactly add up to the sum of the components' growth rates.
Sources:
See the text.
These findings raise at least two important questions. First, how does the rate of technological progress in Ruhr coal mining compare with other industries or sectors of the Weimar economy or with the economy as a whole? It is helpful to have in mind that, as of 1936, the entire mining sector's share in net value added amounted to 2.2 percent making mining the 12th most important sector overall and the fifth most important industrial sector.Footnote 32 To date, we can only compare coal mining to agriculture, which had, as of the same year, a share in aggregate net value added of 11.4 percent.Footnote 33 Stephanie Degler and Jochen Streb (Reference Degler and Streb2008, p. 133) derive average TFP growth rates for agriculture for the periods 1925–1929, 1925–1932, 1933–1939, and 1950–1959. On the basis of a Solow-like growth accounting exercise, they found that TFP grew positively in each period by 4.9, 3.7, 2.1, and 5.7 percent, respectively, per annum.Footnote 34 In comparison, Ruhr coal mining experienced TFP growth over 1925–1929 of 4.7 percent; from 1925 through 1932, including the depression years, the growth rate dropped to +2.7 percent. Thus, agriculture experienced greater growth. In a comparison with the aggregate economy, Joan Roses and Nikolaus Wolf (Reference Roses, Wolf, Broadberry and O'Rourke2010, pp. 200–03) estimate residual TFP growth over 1922–1929, 1929–1938, and 1922–1938 to have been +5.2, +2.0, and +3.5 percent, respectively;Footnote 35 the corresponding growth rates for mining are +5.0, +3.3, and +4.1 percent, respectively. Over the combined late inflation and rationalization periods, coal mining did not perform above average but it did over the combined Depression and Nazi years. Thus, coal mining experienced an opposite trend to agriculture and the aggregate economy, which was that average TFP growth slowed down over the recession years and the Nazi regime.
Second, we might ask if it is really appropriate to think of TFP growth after 1933 as a delayed payoff for all the efforts made over 1924–1929. Should we not rather ascribe it to the Nazis' economic policy measures? More pointedly, how much of TFP growth after 1933 is Weimar, and how much is Nazi?Footnote 36 According to Adam Tooze (Reference Tooze2006, pp. 37–59), the Nazis generally inherited those measures taken by the last Weimar governments and benefited significantly from these measures, which, only later, took full effect in the form of an economic upswing. So, in brief, were there particular coal-related measures by the Nazis that would explain TFP growth after 1933? Shortage of coal was a persistent feature of the German economy after 1933. Considering that coal was desperately needed for achieving the Nazi goal of autarky in energy supply, it is striking that the war economy's future coal consumption needs and required production capacities were only properly projected the first time in 1939 (Petzina Reference Petzina1968, pp. 102, 129, 182; Gillingham Reference Gillingham1985, pp. 32, 50). In this context, there has been a critical debate as to whether the Ruhr coal managers more or less successfully opposed any regulation attempt by the Nazis or, rather, actively helped shape the regulations in their favor (Ziegler Reference Ziegler, Berghoff, Kocka and Ziegler2010, p. 273). There seems, however, to be agreement that a regulatory environment finally emerged that provided (not only) coal-mining firms with considerable room for independent business decisions and still enough market incentives for profit-seeking (Gillingham Reference Gillingham1985, pp. 34–35, 68; Parnell 1994, p. 51; Ziegler Reference Ziegler, Tenfelde, Berger and Seidel2013, p. 177).Footnote 37 For managers, one way to create a better production environment arguably was to raise average firm size in terms of output. Based on a complete collection of all mines in the Ruhr coal district (Jopp Reference Jopp2015), we can trace the trend in average firm size: It amounted to slightly over one million tons in 1925 and increased to 1.75 million tons in 1929. During the depression years, average firm size shrank to a level slightly below the 1913 level of 1.3 million tons. It took until 1936 to reach the level already realized in 1929. Yet, over 1937 and 1938, average firm size was pushed to an unprecedented level of roughly 2.5 million tons. This development reflects the gain in technical efficiency at the beginning of the Nazi regime and it also can explain the part of TFP growth due to scale efficiency gains (that is, growing towards optimal scale and, on the way, increase labor productivity). However, up to 1936, firms only caught up with the trend that has its roots in the Weimar Republic.Footnote 38
Conclusion
This article examines the rate of technological progress in German coal mining in the troubled period between 1914 and 1938, using a sample of the Ruhr coal-mining firms. Based on a rich set of firm-level data, including data on average depth of extraction and data from many commercial balance sheets to estimate the capital stock, I estimated a stochastic production frontier from which I derived total factor productivity growth.
My TFP growth estimates draw a more accurate picture of the productivity development in the coal industry. There were negative TFP shocks during WWI and the immediate post-war year 1919, at the height of inflation in 1923, during the Great Depression, and immediately before the outbreak of WWII in 1938. However, despite these expected negative shocks, average TFP growth in the industry was positive over the whole period from1913–1938, with 1.7 percent per annum. Positive TFP shocks occurred over the phase 1920–1922, throughout the “Golden Twenties” as the core phase of rationalization and mechanization, and during the first five years of Nazi dictatorship. However, it turns out that, TFP grew relatively fastest over 1934–1937 (+5.6 percent; 1933–1938: +5.3 percent) rather than during the rationalization period 1925–1929 (+4.7 percent).
This finding is surprising, as the traditional picture of coal mining under the Nazis is ambiguous regarding technological progress. Qualitative accounts (e.g., Bleidick Reference Bleidick, Tenfelde, Berger and Seidel2013; Ziegler Reference Ziegler, Tenfelde, Berger and Seidel2013) point out that coal extraction and labor productivity further improved beyond 1932. But the accounts also argue that this was only possible as coal managers could capitalize on the technological achievements of the pre-depression years. In this respect, negative rationalization in the form of the pre-1933 concentration process is said to have been crucial as consolidation led to much larger adjacent mining claims (Grubenfelder) per firm. This facilitated application of the new large-scale technologies (e.g., longwall mining; Bleidick Reference Bleidick, Tenfelde, Berger and Seidel2013, pp. 386–87) and led to a more efficient use of the now available mining techniques (Burghardt Reference Burghardt and Wengenroth1993, pp. 70–71).
However, the qualitative accounts lack quantitative evidence on the development of TFP as an accepted measure of the rate of technological progress. Based on such estimates, this study reinforces the view that the Nazis indeed inherited some good structures and policies from the Weimar Republic; those policies came into effect only with delay. Thus, a broader picture emerges that shows that the coal industry under the Nazis capitalized on the rationalization boom of the Golden Twenties. Had the rationalization movement not taken place, under-capacity in the coal industry and, thus, coal scarcity would likely have been even worse than they actually were. I can only speculate, but this would have had severe repercussions on war preparations. To close any resulting coal gap (which would have been larger than the one existing anyway), it might have required serious resource reallocations to compensate for it; and, the argument goes, if coal production had been maintained at the historically observable level, the resources spent on maintaining it (especially manpower) would have been lacking elsewhere in the economy.
The presented evidence adds yet another facet to our understanding of how the Nazi economy could flourish and wage a world war. My results encourage more industry-level TFP studies on the Weimar rationalization wave and its long-term effects which came into play after 1933. If we ended the account of the Weimar rationalization wave with 1932/33, as is usually done, we would be left with the impression that the Great Depression in Germany simply destroyed the economic gains from capital utilization of the rationalization period.
Appendix 1: Capital Stock Estimation
Preparation of Balance Sheet Data
Difficulties stem from the necessity to take inflation between 1914 and 1923 into account since it principally affected observed book values (Sweeney Reference Sweeney and Zeff1928). Factually, almost only financial and current assets needed to be corrected to assess inflationary impact, whereas fixed assets were predominantly balanced free of inflation. As correction factors, the yearly exchange rates of the German mark to the U.S. dollar were used, conditional on the effective accounting date of the balance sheet (Holtfrerich Reference Holtfrerich1980, p. 15). Equation (A.1) describes the correction procedure:

Atfree represents the resulting balance sheet item, which is free of inflation. At is the item affected by inflation. ERt is the mark-dollar exchange rate and ERPt the exchange rate parity at the beginning of WWI or, respectively, after the currency reform of 1923/24 (i.e., 4.2 marks/Reichmarks per dollar).
Another challenge arose in the context of vertically integrated firms whenever fixed assets linked with mine operation were not explicitly reported in the balance sheets for the entire period over which a firm was observed. In this case, I used information on the proportion of fixed mine assets to all fixed assets from the years with separate reporting to produce estimates for those years.
Finally, the balance sheets of the firms that had not chosen 31 December as their effective accounting date (but the end of March, June, or September) had to be transformed as though they had originally been produced at the end of the calendar year. If, for example, a balance sheet is dated 31 March 1914, I would construct a counterfactual balance sheet of 1914 consisting of one-quarter the historical balance sheet of 1914 and three-quarters the sheet of 1915.
Capital Stock at Replacement Costs
The method by Lindenberg and Ross (Reference Lindenberg and Ross1981) implicitly assumes that the production technology in use is replaced by the newest technology available on the market, and not only reproduced in kind. The replacement cost (RC) of firm i observed in t is given by

where TA is total assets; RNP is net plant at replacement cost; HNP is historical net plant; and RINV and HINV are the firm's inventories at replacement cost and at historical cost, respectively. Since inventories are assumed to have been valued at recent prices, the latter two summands drop out. Equation (A.3) presents the problem to be solved by recursive estimation:
![\[
\begin{array}
\displaystyle \mathrm{RNP}_{\mathrm{it}}=\sum_{\tau=0}^{t}\prod_{s=t-1}^{t}\left[\frac{1+\psi_{s}}{(1+\delta_{s})(1+\theta_{s})}\right]*\mathrm{I}_{\tau}+\mathrm{HNP}_{\mathrm{i}0}^{*}\prod_{s =0}^{t}\left[\frac{1+\phi_{s}}{(1+\delta_{s})(1+\theta_{s})}\right].
\end{array}
\](https://static.cambridge.org/binary/version/id/urn:cambridge.org:id:binary:20170301100743951-0915:S0022050716001005:S0022050716001005_eqna3.gif?pub-status=live)
This approach allows for depreciation (δ), the rate of technological progress at the economy level (θ), and capital price movements (φ). Iτ represents time-specific investment computed as (Iit = HNPit – HNPi,t– 1 + DEPit ), where DEP is scheduled depreciation from the profit and loss accounts. Theoretically, the exact depreciation profiles of every single asset have to be considered in calculating a firm's capital stock (Raknerud, Ronningen, and Skjerpen Reference Raknerud, Ronningen and Skjerpen2007, p. 402). However, I face a restriction here in the quality of available historical accounting data. Since, for a number of firms, depreciation is not differentiated by type of asset in the balance sheets and annual reports, the depreciation rate of firm i in year t was computed using the expression (δit = DEPit / HNPi,t–1 ). Hence, δit has to be understood as a firm- and time-specific mean depreciation rate across all fixed asset categories. This procedure might cause inaccuracies because it does not allow for changes in the composition of a firm's fixed asset portfolio or for the impact of extraordinary write-downs. Furthermore, obtaining a full time series of growth rates of a capital goods price index (φ) was challenging because of a lack of German price data for the inflation years 1914 to 1923.Footnote 39 For the period 1924 to 1938, I use Walther G. Hoffmann's (Reference Hoffmann1965, pp. 140, 598, 606) machine exports price index. For the period 1914 to 1923, I apply Charles H. Feinstein's (Reference Feinstein1972, T137) plant and machinery price index for the United Kingdom, assuming that the computed growth rates fit, at least approximately, with the true but unobservable growth rates of a German capital goods price index if the extraordinary inflationary trends in Germany after WWI had not existed.Footnote 40 This counterfactual perspective seems to be appropriate to determine the pure technical value of utilized fixed assets, which were independent of runaway inflation.Footnote 41
In order to approximate the rate of technical progress (θ), a simple neo-classical growth accounting exercise on the macro-level was carried out to estimate the “Solow residual” year-by-year. German gross national product (GNP) at market prices was taken from Albrecht Ritschl and Mark Spoerer (Reference Ritschl and Spoerer1997, p. 51), and the economy's capital stock and employment series are from Andrea Sommariva and Guiseppe Tullio (Reference Sommariva and Tullio1987, pp. 226–27); a labor income share of 0.78 was assumed.
Finally, a note on currency stabilization at the end of 1923 is necessary. When the currency was changed from marks to Reichmarks, firms were to draw up opening balance sheets (Goldmarkeröffnungsbilanzen) in the new currency, with the opportunity to fundamentally revalue assets and equity. Spoerer (Reference Spoerer1995b, p. 75) points out that those firms with pessimistic expectations for their profit situation in the near future would likely have undervalued their assets, while those with optimistic expectations would have valued them realistically. The question certainly arises as to whether revaluations occurred. Based on the aggregate HNP of all firms observed over the entire observation period, firms indeed appear to have used the opportunity for revaluations. The aggregate HNP in my sample dropped by 14 percent from 1923 to 1924; and the corresponding average growth rate among the respective firms was minus 6.7 percent. This brought the aggregate HNP back to somewhere between its 1920 and 1921 levels. However, we believe that this bias is tolerable, not the least because my estimates of the elasticity of output with respect to capital are constant between 1922 and 1926 (see Figure 4).
Initial Value Correction
Raknerud, Ronningen, and Skjerpen (Reference Raknerud, Ronningen and Skjerpen2007, pp. 405–12) propose a procedure for correcting the initial capital stock values of firms established before the first observation by applying cohort-specific correction factors. A cohort is defined as a group of firms being c years old in the first observed year. This procedure is intended to account for the age composition of the firms' fixed capital, assuming that firms established before the starting point use a mixture of older and newer machinery, equipment and so forth; in other words, the older the firm, the larger, presumably, is the share of older tangible fixed assets, which are not measured only in current prices, but also in historic prices of the subsequent periods.
The cohort-specific correction factors, εc , are expressed as:

The relative investment rates λt (t = –c) are computed using the expressions λt = It c / I0 c for the years 1888 to 1913 and λt–1 = 1/(1–w) ∗ λt for the years 1849 to 1887. I denotes cohort-specific mean investment, and w is the historical mean geometric growth rate of aggregate industry investment (8.43 percent per year). Following Holtfrerich (Reference Holtfrerich1973, p. 86), aggregated investment prior to and including 1887 is approximated by the growth of installed horsepower of steam engines. Firm-specific investment in 1888–1913 is calculated using additional balance sheet data of 34 joint-stock companies and two Gewerkschaften based on the above formula (see previous subsection). The required capital goods price index, π, is taken from Hoffmann (Reference Hoffmann1965, pp. 140–41). The depreciation rate, δ, is the average depreciation rate in the population of the 36 firms for which accounting data were available (essentially the set of firms used in Burhop and Lübbers Reference Burhop and Lübbers2009). According to Raknerud, Ronningen, and Skjerpen (Reference Raknerud, Ronningen and Skjerpen2007), it is assumed constant over time moving backwards from 1913 and averages 5.7 percent. Again, δ refers to all fixed asset categories.Footnote 42
The correction factors I apply to all firms entering the sample in 1914 or 1915, conditional on their age, are all smaller than 1.0.Footnote 43 This is due to the fact that capital-goods prices entering (A.4) in the denominator had fallen throughout the nineteenth century. Economically, this implies that tangible fixed assets of coal-mining firms were (part) overvalued on their balance sheets at the beginning of the observation period. The initial capital stocks of firms entering the sample in 1916 or later are not corrected for, regardless of the fact that they may have been established before 1914.
SAMPLE OF RUHR COAL–MINING FIRMS

 ).



