Introduction and backgro und
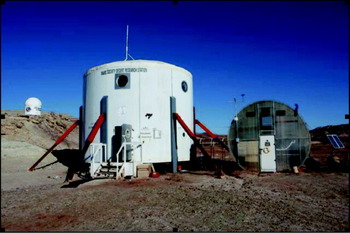
The Mars Desert Research Station (MDRS) is an analogue planetary surface habitat located in a remote area in south-central Utah. The MDRS offers a cost-effective way of simulating aspects of a planetary surface mission as it is equipped with most of the facilities and equipment that would be needed on these missions. The location in a barren reddish desert landscape makes it an impressive visual stand in for Mars. The centrepiece of the facility is the two-story cylindrical habitat representing a possible design for a landed Mars station (Zubrin et al. Reference Zubrin, Baker and Gwynne1991; Zubin et al. Reference Zubin, Wagner and Clark1997). Facilities and equipment provided at the MDRS include living and laboratory space, a ‘greenhab’ wastewater treatment centre, an optical observatory, simulated space suits, and ATV's for simulating unpressurized rover traverses. Electrical generators provide power at the site and it is equipped with satellite-based internet service enabling communication with ground operations. Figure 1 shows the main facilities of the MDRS.
MDRS facilities including habitat (centre), ‘greenhab’ biological wastewater treatment facility (right) and Musk Observatory (far left).

The MDRS was designed and erected by the privately funded Mars Society, a space interest group. Operational since 2001, the MDRS has been occupied by 94 crews (through spring 2010), typically in missions of 2-weeks duration. The MDRS supports projects proposed by individuals and groups interested in performing scientific or operations research in the area and is primarily focused on Mars analogue research or activities related to human missions to Mars.
Previous published research performed at the MDRS has covered a wide range of disciplines including human factors (Groemer et al. Reference Ehrenfreund2010), engineering (Paulson et al. Reference Paulson, Green and Rowland2003), microbial habitats (Wood & Clarke Reference Wood, Clarke and Cockell2004) and robotics (Dowding et al. Reference Dowding, Alena, Clancey, Graham and Sierhuis2006), to list a few of the disciplines investigated. Results from the EuroGeoMars 2009 campaign are published in this IJA special issue with emphasis on the analysis of samples (Direito et al. Reference Direito, Ehrenfreund, Marees, Staats, Foing and Röling2011; Ehrenfreund et al. Reference Gattinger, Günthner, Schloter and Munch2011; Foing et al. Reference Foing, Stoker, Zavaleta, Ehrenfreund, Thiel, Sarrazin, Blake, Page, Pletser, Hendrikse, Direito, Kotler, Martins, Orzechowska, Clarke, Gross, Wendt, Borst, Peters, Wilhelm and Davies2011; Kotler et al. Reference Kotler, Quinn, Foing, Martins and Ehrenfreund2011; Martins et al. Reference Martins, Sephton, Foing and Ehrenfreund2011; Orzechowska et al. Reference Orzechowska, Kidd, Foing, Kanik, Stoker and Ehrenfreund2011; Thiel et al. Reference Thiel, Ehrenfreund, Foing, Pletser and Ullrich2011). Student crews have done much of the work at MDRS and the facility has proven to be an excellent platform for student research and training (e.g. Sullivan & Morrison Reference Sullivan and Morrison2008).
Published work in the Earth sciences performed at MDRS has included regolith geology (Clarke & Pain Reference Clarke, Pain and Cockell2003), sedimentology (Battler et al. Reference Battler, Clarke, Coniglio and Clarke2006), geophysics (Shiro & Ferrone, Reference Shiro and Ferrone2010) and cartography and GIS (Hargitai et al. Reference Hargitai, Gregory, Osburg and Hands2007). These have all been preliminary investigations and considerably more work remains to be done.
In addition to its attributes as a human operations test bed, the MDRS field area is a useful analogue to develop science methodologies and test instrument technologies to help prepare for upcoming robotic and human Mars missions. The favourable characteristics for this purpose are summarized here.
The geomorphology of the MDRS area is dominated by physical processes, with analogues on the surface of Mars. Active processes include mass movement, episodic fluvial action, arid thermal cycling and both wind erosion and deposition. The result of these processes is a landscape evolution pattern with many similarities to those operating on Mars. The landscape at MDRS includes rocky and smooth plains, steep smooth and scree-mantled slopes, cliffs, gullies and dunes. As on Mars, ancient fluvial processes are recorded in layered sedimentary deposits (Malin & Edgett, Reference Malin and Edgett2000b; Battler et al. Reference Battler, Clarke, Coniglio and Clarke2006), dry channel features analogous to Martian rivers and gullies (Malin & Edgett Reference Malin and Edgett2000a; Clarke & Pain Reference Clarke, Pain and Cockell2003); channels exposed by relief inversion (Pain et al. Reference Pain, Clarke and Thomas2007; Williams et al. Reference Williams, Irwin and Zimbelman2009; Clarke & Stoker Reference Clarke and Stoker2011), and hydrated mineral phases, including sulfates and clays (Clarke & Pain Reference Clarke, Pain and Cockell2003; Bibring et al. Reference Bibring, Langevin, Gendrin, Gondet, Poulet, Berthé, Soufflot, Arvidson, Mangold and Mustard2005; Gendrin et al. Reference Gómez-Silva, Rainey, Warren-Rhodes, McKay, Navarro-González, Dion, Nautiyal and Varma2005; Poulet et al. Reference Poulet2005; Battler et al. Reference Battler, Clarke, Coniglio and Clarke2006; Bibring et al. Reference Bibring, Arvidson, Gendrin, Gondet, Langevin, Le Mouelic, Mangold, Morris, Poulet, Quantin and Sotin2007).
The geology of the MDRS region is diverse. Although it lacks the basaltic lithologies that characterize much of the Martian crust, the area exhibits a range of evaporitic and fluvial sediments with complex diagenetic features that are interesting analogues for such features on Mars. Basaltic rocks are present further afield in Capitol Reef National Park and intermediate intrusives are in the Henry Mountains to the south. Rocks derived from both igneous provinces are common in the study area itself having been transported there through fluvial action. Martian mineralogy consists of silicates (olivine, pyroxenes and plagioclase), phyllosilicates (clay minerals such as montmorillonite and nontronite (Poulet et al. Reference Poulet2005; Mustard et al. Reference Mustard, Murchie, Pelkey, Ehlmann, Milliken, Grant, Bibring, Poulet, Bishop and Dobrea2008)), evaporites especially sulfates (Bibring et al. Reference Bibring, Arvidson, Gendrin, Gondet, Langevin, Le Mouelic, Mangold, Morris, Poulet, Quantin and Sotin2007), iron oxides (haematite and magnetite), iron oxyhydroxides (goethite and ferrihydrite) and traces of carbonates (Poulet et al. Reference Poulet2005; Ehlmann et al. Reference Filmore2008). At MDRS, sedimentary deposits of sands evaporites and clays are found; gypsum and a variety of clay minerals have been detected (Borst et al. Reference Borst, Peters, Foing, Stoker, Wendt, Gross, Zavaleta, Sarrazin, Blake, Ehrenfreund and Boche-Sauvan2010; Kotler et al. Reference Kotler, Quinn, Foing, Martins and Ehrenfreund2011). Iron oxides produce red-coloured soils and sandstones (Chan et al. Reference Chan, Beitler, Parry, Ormö and Komatsu2004; Ormo et al. Reference Ormo, Komatsu, Chan, Beitler and Parry2004).
The search for evidence of life is a primary goal of the United States Mars Exploration Program (MEPAG Reference Johnson2008). If life currently exists on Mars, it had to adapt to extreme conditions: very low temperatures (average daily temperature −60°C), dryness, high ultraviolet radiation, strongly oxidizing conditions and a thin atmosphere (∼6 mbar). Evidence that warmer wetter conditions existed in the past (reviewed in Fairen et al. Reference Gendrin, Mangold and Bibring2010) has led to a strategy for searching for traces of life left in sediments deposited under aqueous conditions preserved from early Mars (McCleese et al. Reference McCleese2006). Characterizing the extant life in desert ecosystems provides clues that inform that search. Like other deserts, the MDRS area poses environmental challenges to biology including temperature extremes, soil salinity, oxidized rocky soils and aridity. MDRS is located in a cold arid desert with an average annual temperature of 12°C with −36°C and +46°C as the lowest and highest temperatures recorded. Typical daily temperature variations are 20°C. Annual average precipitation is 140 mm with often months without any precipitation (Godfrey et al. Reference Groemer, Gruber, Bishop, Peham, Wolf and Hogl2008). Some soils in the area, particularly those of the Morrison formation (MF) immediately adjacent to the MDRS habitat are nearly devoid of plant life. However, sheltered micro-environments associated with cliffs, seeps and transparent rocks provide a diversity of niches for life.
The work reported here results from a study called DOMMEX (acronym for Drilling on the Moon and Mars in Human Exploration) in which crews stationed at MDRS perform subsurface science activities including geologic field studies, acquiring and analysing subsurface samples at the MDRS station to accomplish science objectives and to support documentation and sample curation. Post-mission analysis of selected samples is also performed to achieve science objectives. Additional mission objectives involve field tests of flight prototype instruments and sampling systems. The crew activities at MDRS are designed to be relevant test and training experiences for future Mars exploration missions both human and robotic.
We report on results from subsurface sampling of soils for geological and biological characterization of geologic units represented in the MDRS area. Activities performed included (1) geologic reconnaissance; (2) collection of soil cores from each of four geologic units in the area that were acquired with a human-operated coring tool; (3) mineralogical analysis of samples in the habitat using a Terra X-ray diffractometer (XRD) (Innov-X Systems, Inc.), a prototype of the CheMin instrument (Sarrazin et al. Reference Sarrazin, Blake, Feldman, Chipera, Vaniman and Bish2005; Bish et al. Reference Bish, Blake, Sarrazin, Treiman, Hoehler, Hausrath, Midtkandal and Steele2007; Blake et al. Reference Blake, Vaniman, Anderson, Bish, Chipera, Chemtob, Crisp, Desmarais, Downs and Farmer2009) selected for the Mars Science Laboratory (MSL) mission; and (4) biological sample analysis in the habitat using DNA extraction followed by polymerase chain reaction (PCR) analysis. Results are also reported from post-mission sample analysis to complete the soil's characterization. Results from other objectives of the DOMMEX activity are reported elsewhere (Messeri & Stoker Reference Messeri and Stoker2010; Stoker et al. Reference Stoker, Zavaleta, Bell, Direto, Foing, Blake and Kim2010b; Clarke & Stoker Reference Clarke and Stoker2011).
Objectives
Selection of sampling sites, sample acquisition, field characterization and archiving for later post-mission laboratory characterization were principle mission science objectives, and are the topic of the present paper. These activities and their approach are analogous to things that could be performed by a human crew on an early Mars mission. The locations visited and sample analyses performed are also relevant to preparing for future missions, importantly the Mars Science Laboratory scheduled to land on Mars in August 2012. We focused on the collection and analysis of soil cores and supporting samples that constitute a survey of example soils in the area surrounding MDRS. Mineralogical, chemical, organic and biological characterization of soils was performed as part of the mission and follow on laboratory work.
Geologic setting
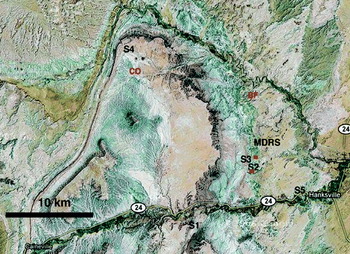
Figure 2 shows an aerial view of the MDRS area. The MDRS is located in the San Rafael Swell (Stokes Reference Stokes1988; Filmore Reference Godfrey2000; Hintze & Kowallis Reference Hintze and Kowallis2009), a unique geological formation created when deeply buried Precambrian rocks faulted and folded during the Laramide orogeny, about 60 million years ago. These basement rocks below the present-day Swell moved upwards relative to the surrounding areas and caused the overlying sedimentary rocks of the Swell to fold into an anticline. The geology of the regional area is a compelling analogue to many terrains on Mars. Subsequent erosion has exposed the geologic layers, resulting in older rocks becoming exposed in the middle of the Swell, and younger rocks exposed around the edges.
Satellite image (Google Earth) of regional area surrounding MDRS showing the location where soil cores S1–S5 were collected. Additional samples collected only for biological analysis are shown as red on the map. Red squares denote positions of YE samples (see Table 5). North is up on the image.

The habitat is located on the Jurassic-aged Morrison formation (MF) immediately adjacent to Cretaceous outcrops. The geology near the habitat includes the Middle Jurassic Summerville formation (SF), the Late Jurassic MF, the early Cretaceous Dakota Sandstone (DS) and the middle cretaceous Mancos Shale (MS) formations. Surficial deposits include dissected gravel sheets derived from the Henry Mountains to the South, Pleistocene terrace deposits along the Fremont River, along with recent alluvial and Aeolian deposits. The area is relevant as an analogue to many terrains on Mars, and the area has strong public appeal for its scenic beauty.
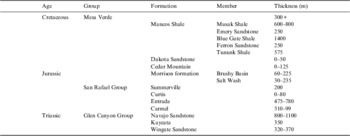
Table 1 shows the local stratigraphic units in the area. A description of the geology surrounding the MDRS follows. Geologic units are listed from younger to older, reflecting the stratigraphy.
Stratigraphy of the Jurassic and Cretaceous near Hanksville, Utah

Mancos Shale
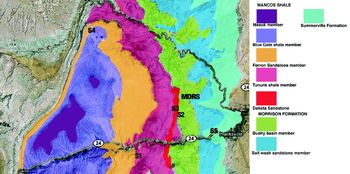
The MS was deposited in a deep sea during the Cretaceous period when western North America was largely covered by water. The geologic record shows two large-scale sea-level fall and rise cycles during the Cretaceous period in this area. Periods of high sea level are presented by shale and periods of low sea level by sandstone. The massive MS is up to 1000 m thick and is dramatically exposed in Factory Butte near the MDRS. Soil cores and supporting samples were collected in the area north of the major cliff exposure of Factory Butte (Figs 2 and 3). The MS in the area sampled is composed of dark (grey to black) thin plates of shale, rich in smectites (Nadeau & Reynolds, Reference Nadeau and Reynolds1981). The MS is divided into the older Tununk shale and the younger Blue Gate Shale by the Ferron Sandstone (Corbeanu et al. Reference Corbeanu, Wizevich, Bhattacharya, Zeng and McMechan2001; Montgomery et al. Reference Montgomery, Tabet and Barker2001). The lower part of Factory Butte is an example of the Blue Gate shale. The Tununk member of the MS was deposited in the deep reaches of a seaway, far from shore where a thick pile of black mud accumulated. The deposition of the coal-bearing Ferron Sandstone took place in fluvial, deltaic, and near shore environments as the sea withdrew. In the next marine transgression, the Blue Gate member of the MS was deposited. This was a deep sea depositional environment where carbon-rich and sulfidic black mud was deposited. The MS is also rich in sulfates. In many locations, gypsum crystals form on the surface of the soils collected in this unit. Large (10–30 cm) concretions of calcite are found embedded in the walls of buttes formed by the Tununk member (Core S1). The Emery Sandstone (Reyer 1983) overlies the Blue Gate Shale and represents a second period of low sea level and fluvial to deltaic deposition.
Geologic map covering same area as Fig. 2. Geologic units are taken from the USGS geologic map of south central Utah (Williams & Hackman, Reference Williams and Hackman1971). Soil cores S1–S5 are marked where acquired from the MS Blue Gate member (S1) the MF (S2), the DS (S3), the MS Tununk shale member (S4) and the SF (S5).

On Mars, areas of phyllosilicates were first identified by orbital spectral measurements with the Observatoire pour la Minéralogie, l'Eau, les Glaces et l'Activité (OMEGA) instrument on Mars Express (Poulet et al. Reference Poulet2005). These deposits are of particular interest for Mars since they indicate aqueous environments. Although relatively rare on Mars, sites where they occur are high priority as future landing sites. Many of the sites under consideration for the Mars Science Lander (MSL) contain spectral signatures of phyllosilicates, and are preferred both for their inferred aqueous history and because they are good environments for organic preservation. The MSs thus represent the type of materials that may have been deposited on Mars during the early Noachian period when liquid water was most plentiful (Bibring et al. Reference Bibring, Langevin, Gendrin, Gondet, Poulet, Berthé, Soufflot, Arvidson, Mangold and Mustard2005; Poulet et al. Reference Poulet2005).
Dakota sandstone
The Dakota sandstone (DS) was formed in the late Cretaceous in a transgressive environment passing from fluvial to shallow marine (Young Reference Young1960; Ulicny Reference Ulicny1999; Filmore Reference Godfrey2000). It is coarse sedimentary sandstone composed of mixed, interbedded fine and coarse conglomerate sands. The base of the DS is coarse cross-bedded sandstones that grade upward into finer siltstones rich in black carbonaceous material including some coal seams. The uppermost DS (exposed on the ridge behind MDRS) is a marine shoreline deposit that contains vast beds of oyster shells. The coarse sandstones host fossils such as wood and dinosaur remains, and iron-rich concretions (Battler et al. Reference Battler, Clarke, Coniglio and Clarke2006) of similar size to those that have been discovered on Mars by the MER rovers (Klingelhofer et al. Reference Klingelhofer, Morris, Bernhardt, Schroder, Rodionov, de Souza, Yen, Gellert, Evlanov and Zubkov2004; McLennan et al. Reference McLennan, Bell, Calvin, Christensen, Clark, de Souza, Farmer, Farrand, Fike and Gellert2005); although on Mars these are found in sulfate-rich sediments whereas the concretions in the DS are silica sands cemented by carbonate.
Morrison formation
The late Jurassic MF was deposited in a predominantly flood plain environment (Demko et al. Reference Demko, Currie and Nicoll2004; Kjemperud et al. Reference Kjemperud, Schomacker and Cross2008). Near MDRS it is composed primarily of clay and mudstone deposits, with occasional lenses of conglomerate sandstone and thin iron and silica-rich fossil soil horizons. Petrified wood and dinosaur bones are locally present. The outcrops are rich in smectite clays that disaggregate through shrink-swell behaviour to form a popcorn-like texture at the surface but remain coherent and form an impermeable layer just below the surface (Keller Reference Clarke, Pain and Cockell1962). Clay hill slopes undergo extensive piping where water flows underground. At the base of these hills are areas of salt efflorescence where water accumulates and evaporates. Vegetation is nearly absent, possibly due to the swelling nature of the clays and high salt content (Clarke & Pain Reference Clarke, Pain and Cockell2003). Most of the clays are red in colour, indicating strong oxidation. Some beds are dark green to olive, indicating that they were deposited under reducing conditions. White beds are leached of iron and are composed mostly of sandstone but some clay-rich beds are also present.
The MDRS is located within the Brushy Basin member of the MF. This unit has been widely studied because it yields some of the richest deposits of dinosaur fauna in the world. In fact, fossil deposits are abundant in the vicinity of MDRS. Mixed throughout the shale hills of the Brushy basin member are conglomerate deposits left by stream channels. Many conglomerates are elevated above the surroundings because they are more resistant than the shales. These inverted stream deposits have been cited as analogues for similar deposits on Mars (Pain et al. Reference Pain, Clarke and Thomas2007; Clarke & Stoker, Reference Clarke and Stoker2011 and references therein). These features hold important clues to landscape evolution and fluid history. The sandstone hosts fossil structures such as wood and dinosaur remains. Small concretions analogous to the concretions found on Mars also occur within sandy lenses within the MF (Clarke & Stoker, Reference Clarke and Stoker2011).
Summerville formation
Underlying the MF is the middle Jurassic SF. During this epoch the area was covered with clastic evaporitic tidal flats (Petersen & Pack Reference Petersen and Pack1982; Anderson & Lucas Reference Anderson and Lucas1994). The SF consists of thinly interbedded red and brown mudstone, siltstone, sandstone, with lenses of gypsum and carbonate. The gypsum occurs as scattered crystals, nodules, large concretions and lenses up to a metre or more in thickness. Vertical fractures in the horizontally bedded walls are filled with evaporites. Preserved sedimentary structures include ripple marks, cross lamination and mud cracks. Cross-bedded sandstone occurs in lenses that are interpreted as tidal channel fills. Horizontal, vertical and low-angle selenitic gypsum veins formed during diagenesis. The sulfates are expected to contain fluid inclusions indicating depositional conditions and may contain biomarkers from the microbial communities that lived on the tidal flat (Griffith et al. Reference Fairén, Davila, Lim, Bramall, Bonaccorsi, Zavaleta, Uceda, Stoker, Wierzchos and Dohm2008).
The SF is an excellent analogue to the Burns formation at Meridiani on Mars that is also composed of interbedded sulfates and silt and sand-sized clastic sediments. Other Martian layered sulfate-bearing deposits may well be similar.
Methods
Prior to the mission, traverses were planned for visits to specific sites to reconnoiter and characterize the local geology and to select locations for specific activities that addressed mission objectives. These traverses were selected to find sites that met requirements identified in advance and were planned using aerial imaging support from Google Earth and topographic maps of the area showing roads and tracks. Identification of the geological units visited was based on field observations and reference to a published geological map (Williams & Hackman, Reference Williams and Hackman1971). The main purpose of this reconnaissance phase was to characterize the local geology, identify good locations to collect soil cores and to identify and characterize one or more locations to perform deep drilling on a future mission. We visited each of the major geologic units in the area and selected sites where further activities were subsequently performed.
Soil core collection and analysis
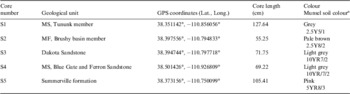
We acquired soil cores from each of the four geologic units near the habitat (Fig. 2). Due to its interest as an organic and phyllosilicate-rich unit, and the deep fines found there, we acquired soil cores in two different locations of the MS with a manually operated percussive soil coring tool (AMS Equipment Soil Sampling Kit). The core section of the tool was fitted with sterile polycarbonate liner inserts after first sterilizing the core tube by flaming. Each core section was a length of 19 cm. The holes were measured at the beginning and end of each insertion, and the core tube was pounded into the ground by 19 cm after each insertion. Due to the pounding nature of the device, some wall material was knocked to the bottom of the hole during sampling, causing some overlap and mixing between sections.
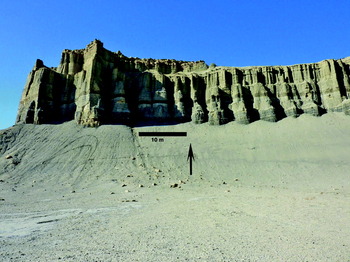
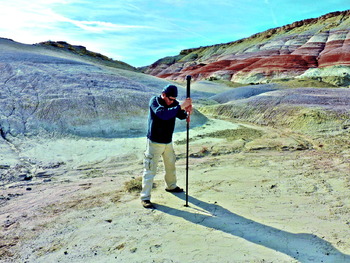
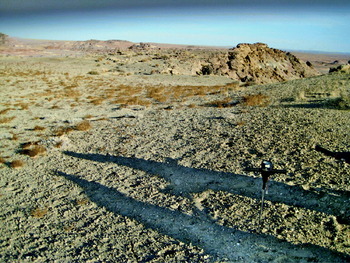
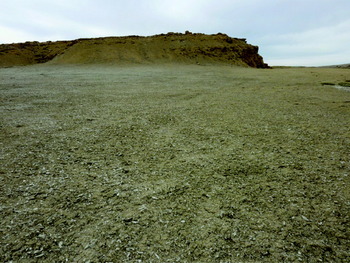
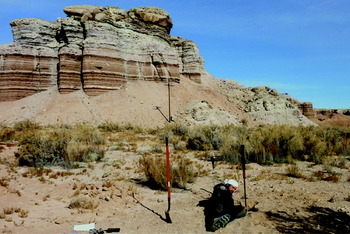
Figures 2 and 3 show the locations and geologic units where soil cores were collected. Table 2 shows additional soil core details. Core S1 was collected high on a steep talus slope below a cliff formed of MS (Fig. 4). Round nodules of gypsum were embedded in the cliff and some were found at the base of the talus slope. Core S2 was collected in a channel fill between rounded hills formed from the Brushy-Basin member of the MF, and approximately 100 m from the foot of the retreating scarp formed where this unit is capped by DS (Fig. 5). Core S3 was collected in DS soil (Fig. 6) on a ridge overlooking the MDRS. The Williams & Hackman (Reference Williams and Hackman1971) geologic map shows the soil core location to be at the intersection of MS and DS. Core S4 was collected in a flat valley in the MS (Tununk member) bordered on the east and west margins by outcrops of Ferron Sandstone. The valley surface was covered by tabular selenite crystals and the soil was very fluffy suggesting gypsum was a component of the soil (Fig. 7). Core S5 was collected in channel fill at the base of a SF cliff comprised of finely layered sediments (Fig. 8).
Core S1 was collected on a scree slope eroding from the MS (Tununk member). The arrow points to location where soil core was collected.

Collecting a soil core at site S2. The site was in channel fill in between shale hills in the Brushy basin member of the MF. The tool has a sliding weight that is lifted and dropped by the operator, causing an impact that impels the core tube into the soil.

Dakota Sandstone site where soil core S3 was collected. Actual core was collected where soil probe is located in the photograph.

The location where core S4 was collected in the MS (Blue Gate member) in a broad valley with adjacent sandstone outcrops of Ferron Sandstone. Gypsum crystals are abundant on the surface of this valley.

The location where soil core S5 was collected at the base of SF layered sedimentary structure.

Soil cores acquired

a From Munsel soil colour charts using colour chips, 2009 edition.
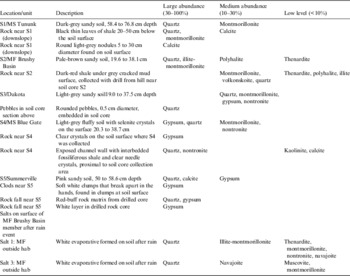
Soil samples from the cores along with some examples of nearby outcrops were analysed in the habitat using a Terra (Innov-X Systems, Inc.) field portable XRD.
Post mission, a full core subsection from the middle depth acquired was dried, ground and homogenized. Small subsamples were analysed with the Terra XRD (Table 3), and the remaining bulk was subjected to chemical analysis by a service laboratory (see below). Since soils represent a weathered collection of minerals, we attempted to acquire representative source rock for the soils to obtain a better representation of the native mineralogy. These, along with soil core XRD analyses, are shown in Table 3.
XRD analysis of soil cores and associated rocks

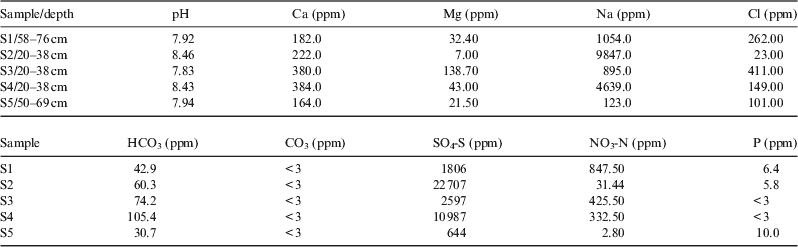
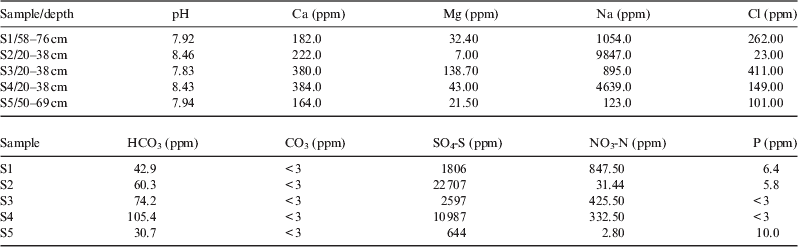
Chemical analysis of samples from the core segments was performed by the University of California Davis College of Agricultural and Environmental Science analytical laboratory. These analyses included pH, Ca, Mg, Na, Cl, B, HCO3, CO3, nitrate, sulfate and phosphate (Table 4).
Results from chemical analysis of the soils
*Samples analysed were the same core section as for XRD analysis (Table 5).
Sulfate analysis was performed by extraction with monocalcium phosphate. This method estimates the quantitative concentration of sulfate sulfur (SO4-S) in the soil by extraction with monocalcium phosphate following the procedure originally outlined by Schulte & Eik (Reference Schulte and Eik1988) with the following exception: (1) elimination of activated carbon and (2) determination of S by inductively coupled plasma atomic emission spectrometry (ICP-AES). The ICP-AES determines all sulfur, both organic and inorganic. This method is appropriate only for soil containing less than 4% organic matter. The method is quantitative only for the time of sampling since sulfur is constantly being mineralized in the soil. The method has a detection limit of approximately 0.5 mg kg−1 sulfur as sulfate and is generally reproducible within 8%.
Phosphate was determined using the Olsen-P method (Olsen & Sommers, Reference Olsen, Sommers and Page1982). This method estimates the relative bioavailability of inorganic ortho-phosphate (PO4-P) in soils with neutral to alkaline pH. It is not appropriate for soils that are mild-to-strongly acidic (pH <6.5). The method is based on the extraction of phosphate from the soil by 0.5 N sodium bicarbonate solution adjusted to pH 8.5. In the process of extraction, hydroxide and bicarbonate competitively desorb phosphate from soil particles and secondary absorption is minimized because of high pH. The orthophosphate ion reacts with ammonium molybdate and antimony potassium tartrate under acidic conditions to form a complex. This complex is reduced with ascorbic acid to form a blue complex that absorbs light at 880 nm. The absorbance is proportional to the concentration of orthophosphate in the sample. The method has a detection limit of 1.0 mg/kg (soil basis) and is generally reproducible within 8%.
Soil nitrate was determined using a method that involves the extraction of nitrate (NO3-N) and ammonium (NH4-N) from soils using an equilibrium extraction with 2.0 N KCl solution. Nitrate is determined by reduction to nitrite via a copperized cadmium column. The nitrite is then determined by diazotizing with sulfanilamide followed by coupling with N-(1-naphthyl) ethylenediamine dihydrochloride. The absorbance of the product is measured at 520 nm. Ammonia is determined by heating with salicylate and hypochlorite in an alkaline phosphate buffer. The presence of ethylenediaminetetraacetic acid (EDTA) prevents precipitation of calcium and magnesium. Sodium nitroprusside is added to enhance sensitivity. The absorbance of the reaction product is measured at 660 nm and is directly proportional to the original ammonia concentration. Extracts can be stored for up to 3 weeks at low temperature (<4°C). The method has a detection limit of approximately 0.10 ppm (on a soil basis).
The pH of soil was determined using a saturated paste prepared from the soil and a pH meter. It is most applicable to soils with a pH ranging from 4.0 to 9.0. It is not possible to determine the total acidity or alkalinity of the soil from pH because of the nature of the colloidal system and junction potential. This method does, however, provide information on the disassociated H-ions affecting the sensing electrode. The method is generally reproducible within 0.2 pH units.
Carbonate and bicarbonate were estimated using a method that quantifies bicarbonate (HCO3) and carbonate (CO3) levels in a soil water extract, such as from saturated paste extract. Quantification is by titration with 0.025 N H2SO4 followed by immediate measurement due to the potential of the extract being super-saturated relative to calcium carbonate (CaCO3). The method has a detection limit of approximately 0.1 meq l−1.
Chloride was measured by a method that quantifies the amount of Cl− in a soil water extract, the saturated paste extract. Thiocyanate ion is liberated from mercuric thiocyanate by the formation of soluble mercuric chloride. In the presence of ferric ion, free thiocyanate ion forms the highly coloured ferric thiocyanate, of which the absorbance is proportional to the chloride concentration. The absorbance of the ferric thiocyanate is read at 480 nm. Plant tolerance to chloride can be related to the concentration of chloride in the saturated paste extract. The method has a detection limit of 0.1 meq l−1 of Cl− and is generally reproducible within 5%.
The concentration of K, Na, B, S, Ca and Mg were determined in the saturated paste extract using ICP-AES for Ca, B, S and Mg and flame atomic emission spectrometry (AES) for K and Na. Sulfur results are assuming that all sulfur present is in the sulfate form. K, Na, Ca and Mg are generally the dominant cations in the saturated paste extract of soils. Concentration of soluble Na, Ca and Mg is used to determine the sodium adsorption ratio (SAR) of soils. Extract solutions containing greater than 10,000 mg l−1 (1.0%, w/v, estimated from ECe) require dilution since solutions of this salt concentration may impair instrument operation. Detection limits for these ions are:
- B
0.05 mg l−1
- Ca
0.10 meq l−1
- K
0.1 mg l−1
- Mg
0.10 meq l−1
- Na
0.10 meq l−1
- S
0.1 mg l−1
Subsamples from soil cores were analysed to determine the total organic carbon content using a modified Walkley–Black method (Nelson & Sommers, Reference Nelson, Sommers and Page1982). This method quantifies the amount of oxidizable organic matter by oxidizing it with a known amount of chromate in the presence of sulfuric acid. The remaining chromate is determined spectrophotometrically at 600 nm wavelength. The calculation of organic carbon is based on organic matter containing 58% carbon. The method has a detection limit of approximately 0.10% and, on homogeneous sample material, is generally reproducible within 8%.
Biological analysis methods – PCR
Biological analysis of selected soil cores and a few other soil samples were performed in the habitat. Soil samples and subsurface soil cores collected using sterile technique were analysed using PCR to amplify DNA. DNA was extracted from a total of 30 different samples, including subsurface soil cores (S1, S4C4 and S6) and other soils collected nearby MDRS or at other locations indicated in Table 5. DNA was isolated using PowerSoil DNA Kit (MO BIO Laboratories, Solana Beach, CA, USA; 0.25 g soil sample). 16S rRNA gene fragments of Bacteria and Archaea, and 18S rRNA gene fragments of Eukarya were amplified by PCR using a Primus 25 Advanced (PeqLab, Germany) PCR machine. A total volume of 25 μl was used in each PCR reaction, containing 0.4 μM forward and reverse primers; 0.4 mg/ml BSA (Bovine Serum Albumin; New England BioLabs, Leusden, The Netherlands); 12.5 μl Fidelitaq PCR Master Mix (2×) (USB Corporation, Cleveland, OH, USA); 8.5 μl DNase and RNase-free water and 1 μl template. For Bacteria, primers F357 and R518 (Muyzer et al. Reference Muyzer, Dewaal and Uitterlinden1993) were utilized. The PCR program was set for an initial denaturation at 94°C for 5 minutes; 35 cycles of 94°C for 30 seconds, 54°C for 30 seconds and 72°C for 30 seconds; plus a final elongation step at 72°C for 8 minutes. For Archaea, a nested approach PCR was performed: PRA46f and Univ0907r (first set) and PARCH340f and PARCH519r (second set) (Øvreås et al. Reference Øvreås, Forney, Daae and Torsvik1997; Vetriani et al. Reference Vetriani, Jannasch, MacGregor, Stahl and Reysenbach1999). For both sets, an initial denaturation was performed at 94°C for 4 minutes; 35 cycles of 94°C for 30 seconds, 54°C for 1 minute and of 72°C for 1 minute; plus a final elongation step at 72°C for 5 minutes. For Eukarya, primers Euk1A and Euk516r were used (Díez et al. Reference Díez, Pedrós-Alió, Marsh and Massana2001). The initial denaturation was at 94°C for 130 seconds; 35 cycles of 94°C for 30 seconds, 56°C for 45 seconds and 72°C for 130 seconds; plus a final elongation step at 72°C for 7 minutes. In order to visualize the PCR products, 1.2% agarose gels (SYBR Green/SYBR Safe, Invitrogen, CA, USA) were run on E-Gel iBase Power System (Invitrogen, Germany), visualized with E-Gel Safe Imager Real-time Transilluminator (Invitrogen, Germany) and photographed. This system (PCR and visualization equipment) was previously and successfully used at MDRS by Thiel et al. (Reference Thiel, Ehrenfreund, Foing, Pletser and Ullrich2011).
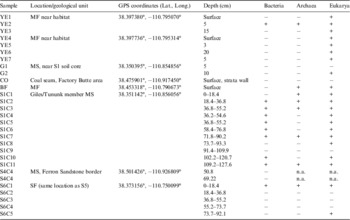
Results from PCR experiments: detection of the three domains of life in various soils and soil core samples from the area around MDRS.

‘+’ indicates amplification, ‘−’ indicates no amplification, ‘n.a’ indicates not analysed.
Phospholipid fatty acid analysis (PLFA) methods
A set of aseptically collected soil cores was kept frozen for post-mission analysis. These were analysed for total biological load and distribution among the major bacterial groups by Microbial Insights commercial laboratory using PLFA. Phospholipids fatty acids are a main component of the membrane (essentially the ‘skin’) of microbes and provide a powerful tool for assessing microbial responses to changes in their environment. Analysis of the types and amount of PLFA provides a broad-based understanding of the entire microbial community with information obtained in three key areas: viable biomass, community structure and metabolic activity. PLFA analysis is one of the most reliable and accurate methods available for the determination of viable microbial biomass. Phospholipids break down rapidly upon cell death (21, 23), and so biomass calculations based on PLFA content do not contain ‘fossil’ lipids of dead cells. Viable biomass is determined from the total amount of PLFA detected in a given sample. Since, phospholipids are an essential part of intact cell membranes they provide an accurate measure of viable cells.
The PLFA in a sample can be separated into particular types, and the resulting PLFA ‘profile’ reflects the proportions of the categories of organisms present in the sample. Because groups of bacteria differ in their metabolic capabilities, determining which bacterial groups are present and their relative distributions within the community can provide information on what metabolic processes are occurring at that location. This, in turn, can also provide information on the subsurface conditions (i.e. oxidation/reduction status, etc.).
Sample analysis results
Chemistry and mineralogy
Table 2 shows the location and depth of soil cores acquired. Refer to Fig. 2 for the map position of the core location. Table 3 shows the results obtained by the XRD analysis of subsamples from the soil cores and of rocks samples obtained near the soil cores. The rocks were analysed since they represent mineral sources for the soils and are more representative of the mineralogy of the geologic unit since they are less weathered than the soils. Results are reported as primary, secondary or trace to account for sample to sample variation. Much more detailed calibration and comparison with known sample mixtures would be required for more quantitative abundance determinations using this instrument.
Table 4 shows the results obtained by the chemical analyses of soils from the same core section as the XRD shown in Table 3. The pH of all samples is slightly alkaline. Sodium is the most abundant cation and sulfate is the most abundant anion in samples S1–S4, suggesting the presence of sodium sulfates. Indeed, sodium and sulfate appear to be highly correlated in all samples.
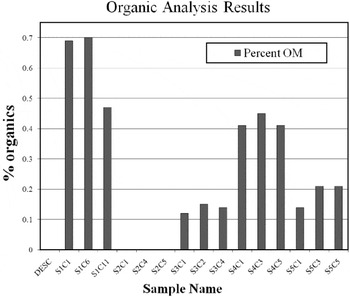
Figure 9 shows the extractable organic carbon measured in the top, middle and bottom section from each soil core. All the soil cores were low in oxidizable organic matter as expected for low-vegetation desert soils. The phyllosilicate-rich MS soils (S1 and S4) have the highest organic concentration. The MF soils (S2), also derived from phyllosilicate-rich shales, have no detectable organic matter. Even the porous sandy soils from the DS (S3) were more organic rich than the MF soils. The organic content of the SF is moderately high, though still lower than the MS soils. Its organic content may not reflect organic storage from the original deposition since the vegetation in this area (Fig. 8) may add modern organics. Vegetation was virtually absent from the areas where the other soil cores were collected.
Extractable organic content in soil cores. Three samples from each soil core were analysed from the surface section, middle section and deepest section. The numbers C1–C11 denote which core section was analysed. Core lengths were 18.4 cm. Depth at the top of each core section is: S1C1 (0 cm), S2C6 (58.4 cm), S1C11 (109.2 cm), S2C1 (0 cm), S2C4 (29.2 cm), S2C5 (36.8 cm), S3C1 (0 cm), S3C2 (18.4 cm), S3C4 (53.3 cm), S4C1 (0 cm), S4C3 (40.0 cm), S4C5 (50.8 cm), S5C1 (0 cm), S5C3 (36.8 cm), S5C5 (86.3 cm).

Biology results
Table 5 shows the results from the PCR analysis. All three domains of life (Archaea, Bacteria and Eukarya) were present but could not be found in all samples. The samples designated YE were collected near the surface using hand tools in the MF near MDRS. These tested positive for Eukarya only, with exception for YE2 where all domains of life were detected. G1 and G2 samples were collected with hand tools near the S1 soil core and revealed Eukarya only in G2. CO sample was collected from a coal seam within the MS and amplification was never successful. Coal usually is very rich in complex organic matter which could be a carbon source for micro-organisms (Strapoc et al. Reference Strapoc, Picardal, Turich, Schaperdoth, Macalady, Lipp, Lin, Ertefai, Schubotz and Hinrichs2008). However, previous studies have shown that DNA may be difficult to extract from samples with very high organic content (e.g. Zhou et al. Reference Zhou, Bruns and Tiedje1996). Archaea and Eukarya were detected in BF, a soil sample collected with hand tools at a location where fungi filaments (hyphae) were observed with the naked eye.
All domains of life were detected in core S1. This core was comprised of 11 sections from different depths labelled from S1C1 (top) to S1C11 (bottom). The three domains were detected in S1C2, S1C3, S1C7 and S1C11. Archaea and Eukarya were encountered in S1C1 and Bacteria and Eukarya in S1C4, S1C5, S1C6 and S1C10. S1C8 revealed Eukarya only and PCR amplification was never successful with S1C9. Core S6 was collected at the same location of core S5. All domains of life were detected in S6C1 section and Eukarya was the only domain detected in S6C5. In contrast, PCR amplification was never successful with S6C2, S6C3 and S6C4. Section S4C4 (DNA extract from the top and the bottom of this S4 core section) was only tested for Bacteria but this domain was not encountered.
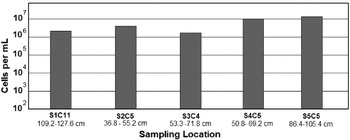
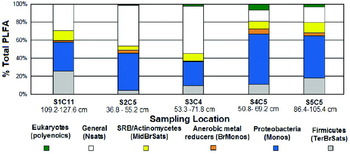
Results from biological analysis on the soil samples obtained by the PLFA method are shown in Figs 10 and 11. The PLFA analysis was done on the deepest soil core obtained to get furthest away from the photic zone and any plant litter layer. As the soil organic matter is highest in soil core S1 and lowest in soil core S2, one might expect that the microbial number density would similarly track this in the subsurface since heterotrophy should dominate subsurface populations but instead, the microbial numbers are somewhat higher in S2 than S1. The population distribution of microbes from Cores S1 and S4 might be expected to be similar since they are from the same geologic unit, but in fact they are quite different but samples S4 and S5, the most widely separated in both location and lithology, have very similar microbial populations.
Cell number densities measured in the deepest soil core obtained in each location. The letter C denotes the core interval. The depth interval represented by the core section is noted below each section number.

Relative percentages of microbial groups identified by PLFA in the deepest depth sampled at each location (S1 through S5). The depth interval analysed is noted.

Discussion
The MDRS area is a valuable analogue site that will help with planning for and interpretation of results from upcoming missions. The following features illustrate the analogue value:
1. Presence of layered deposits.
2. Presence of sulfates, similar species as observed on Mars (Ca, Mg and Fe rich).
3. Presence of phyllosilicates – similar species as observed on Mars.
4. Ancient aqueous channel deposits, some now forming positive relief features.
5. Role of ground water in aqueous alteration of the primary deposits.
6. Sediments bearing concretions.
7. Preservation and oxidation of organics from an earlier epoch.
8. Highly oxidizing conditions at present.
The Mars Science Laboratory mission plans to land on Mars in August 2012. At the time of this writing the exact landing site has not been chosen but the mission will go to a site containing orbital evidence of phyllosilicate minerals. The data acquired in our study are comparable to the type of data that the mission acquires. In particular, we used the Terra XRD instrument for mineralogical analysis that is a commercial version of the CheMin instrument on MSL. The instrument yielded results that compare well with previous results obtained using more sophisticated instrumentation and laboratory techniques (Whittig et al. Reference Whittig, Deyo and Tanji1982; Truillo Reference Truillo, Foster and Lucas2006).
Mineralogy results
Detailed analysis of a small number of samples from locations selected to be representative of specific geologic units is typical of the kind of data that will be acquired on Mars by future robotic missions. Even human missions will not have the opportunity for exhaustive sampling of the type often accomplished in terrestrial field research. With that in mind, we endeavour to show how our results compare to the broader literature about the sampled area, and to compare the findings at our sites with current information about Mars. We have examined natural phyllosilicate and sulfate-rich samples with instruments relevant to future missions. It is important to note that we did not select the samples because we knew them to be enriched in these minerals, but rather as representative examples of recognized geologic provinces previously mapped in the area.
Our analysis of the MS samples with the Terra XRD (Table 3) revealed the presence of carbonate salts in the least weathered sample location (S1) and gypsum in the more weathered location (S4). Both locations show a moderate abundance of smectites. Montmorillonite is seen in S1 and montmorillonite and nontronite in S4. Quartz is the highest-abundance component in the soils from all areas.
The MS is the major source of solutes and suspended load in the Colorado River and numerous sulfate minerals have been reported (Whittig et al. Reference Whittig, Deyo and Tanji1982; Larrone Reference Whittig, Deyo and Tanji1981) including gypsum (CaSO4·2H2O), epsomite (Mg2SO4·10H2O), hexahydrite (MgSO4·6H2O), pentahydrite (MgSO4·5H2O), starkeyite (MgSO4·4H2O), kieserite (MgSO4·H2O), loewite (Na4Mg2(SO4)4·5H2O), bloedite (Na2Mg(SO4)2·4H2O), mirabilite (NaSO4·10H2O) and thenardite (Na2SO4). The predominance of sodium sulfate species is particularly noteworthy. Their presence makes the soils highly dispersive and easily eroded thus contributing to the solute and suspended load of runoff (Azimi-Zoooz & Duffy Reference Azimi-Zoooz and Duffy1993). Our data on the composition of salts in soils from the older units such as the Morrison and the SF indicate that the salts present are broadly very similar to those of the MSs including gypsum, thenardite and polyhalite (K2Ca2Mg(SO4)4·2(H2O) among them. Some of this similarity across formation and geomorphic boundaries may be attributed to aeolian activity. Wind gusts are very active in the area and readily mobilize surface particles as soon as they form (Fig. 12). This activity is likely to homogenize the most soluble species in soils across the area, at least at regional scales (Godfrey, Reference Gómez-Silva, Rainey, Warren-Rhodes, McKay, Navarro-González, Dion and Nautiyal1997; Howard Reference Gómez-Silva, Rainey, Warren-Rhodes, McKay, Navarro-González, Dion and Nautiyal1994). Analogous processes, occurring over geologic time, appear to have globally homogenized the soils of Mars (Clark et al. Reference Clark, Morris, McLennan, Gellert, Jolliff, Knoll, Squyres, Lowenstein, Ming and Tosca2005).
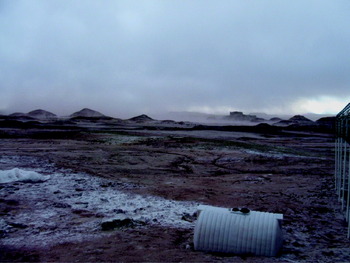
View from the front of MDRS. The white material at the left is an evaporite that formed after a rain storm. Wind soon removed this material from the surface. Dust clouds are seen at the horizon.

The XRD data we acquired from the MF soil (Table 3 site S2) show phyllosilicates including montmorillonite and illite. The underlying bedrock contained montmorillonite and volkonskoite in addition to traces of illite. Sulfates polyhalite and thenardite were seen in both soils and bedrock. The bottom of Table 3 shows XRD analysis of two samples that were collected of a white precipitate formed on the surface of the MF soil immediately adjacent to the MDRS habitat. This soil has significant quantities of navajoite. The white precipitate is probably thenardite, whereas the navajoite may be a component of the soil that could not be completely separated from the evaporite.
Volkanskoite and navajoite in the MF soils probably are mineral biomarkers that help explain the lack of organic matter in MF samples (see also Ehrenfreund et al. Reference Gattinger, Günthner, Schloter and Munch2011, this issue). Volkanskoite is a chromium-bearing clay that is associated with vanadium- and uranium-bearing deposits (McConnell Reference McConnell1953). It commonly fills voids left by the decomposition of organic matter (see description at webmineral.com). Navajoite is a hydrated vanadium pentoxide (Weeks et al. Reference Weeks, Thompson and Sherwood1954). These minerals were deposited during diagenesis when organic matter was dissolved and replaced by vanadium-bearing clays and chlorites (Hansley & Spirakis, Reference Hansley and Spirakis1992), and demark the former presence of biologically derived organic compounds.
Martian basalts are known to be enriched in Cr by a factor of 10 over terrestrial counterparts (see data in Lodders & Fegley Reference Lodders and Fegley1998). Since Martian phyllosilicate most likely derive from basalt, Cr-enriched phyllosilicates are plausible. Volkanskoite is representative of the type of biomarker mineral that could be identified on Mars with the CheMin instrument. Obviously, the presence of minerals in Utah does not forecast their presence on Mars. However, the fact that they were unexpectedly identified with the Terra at MDRS and provide insight into the geologic history of the region illustrates the enormously powerful new analytical capability that CheMin will bring to the understanding of Mars.
The XRD data from the Dakota soil show the phyllosilicate nontronite and the sulfate gypsum. Some Dakota soil samples are highly enriched in gypsum and can be up to 70% sulfates (see Kotler et al. Reference Kotler, Quinn, Foing, Martins and Ehrenfreund2011, this issue). These soils may have accumulated sulfates washed out of the overlying MSs when percolating groundwater reached the less porous cemented DS layer. Similarly, some examples of sulfate deposits on Mars may be a signature of ground water rather than evaporates formed at the surface.
Unlike the other formations, the Jurassic era SF does not display phyllosilicates. This unit is comprised of cliff forming quartz sandstones cemented by calcite. The nearly horizontal beds (Fig. 8) suggest low-energy deposition in an aqueous environment. Some of the layers in the beds are nearly pure gypsum, suggesting that these formed in a more acidic environment than the calcite-cemented layers. Fractures running perpendicular to the bedding plane are also filled with pure gypsum suggesting that sulfate-rich ground water flowed subsequent to sediment burial.
The lithologies our data have revealed have strong analogues in those indicated on Mars on the basis of orbital remote sensing. Phyllosilicates have been reported in relatively small localized areas confined to ancient terrains (Bibring et al. Reference Bibring, Langevin, Gendrin, Gondet, Poulet, Berthé, Soufflot, Arvidson, Mangold and Mustard2005; Mustard et al. Reference Mustard, Murchie, Pelkey, Ehlmann, Milliken, Grant, Bibring, Poulet, Bishop and Dobrea2008). The phyllosilicates detected on Mars are Fe, Mg and Al smectite clays. The orbital Compact Reconnaissance Imaging Spectrometer for Mars (CRISM) instrument (Mustard et al. Reference Mustard, Murchie, Pelkey, Ehlmann, Milliken, Grant, Bibring, Poulet, Bishop and Dobrea2008) has detected kaolinite, chlorite, nontronite, saponite, illite, muscovite and hydrated silica. Phyllosilicates are seen in excavated craters (hundreds of examples) and in some sedimentary deposits. Mawrth Vallis shows spectral features of montmorillonite and kaolinite in layered outcrops. An inverted channel in Miyamoto crater shows phyllosilicates proximal to the paleochannel but not in the (more indurated) ridge (Marzzo et al. Reference Marzzo, Roush, Lanza, McGuire, Newsom, Ollila and Wiseman2009). Inverted morphology paleochannel features are prominent features of the MF in the MDRS area (see Clarke & Stoker Reference Clarke and Stoker2011, this issue).
The sulfates found in abundance in Utah also are similar to those found on Mars. Many layered terrains on Mars are rich in sulfates (Gendrin et al. Reference Gómez-Silva, Rainey, Warren-Rhodes, McKay, Navarro-González, Dion, Nautiyal and Varma2005). The sulfates identified include Mg sulfates (kieserite MgSO4·H2O), Ca sulfates: gypsum(CaSO4·2H2O) or bassanite (2CaSO4·H2O) and polyhydrated sulfates such as epsomite (MgSO4·7H2O) and copiapite (Fe2+Fe43+(SO4)6(OH)2·20H2O). Sulfates are observed from orbit in Valles Marineris layered deposits, Candor and Melas, and Juvantae Chasmas. Gypsum and keiserite form in layers hundreds of metres thick. In Terra Meridiani, sulfates are found over large areas in etched units. Large areas of keiserite are associated with etched units, underlying the haematite explored by MER. On Mars, the sulfates and phyllosilicates appear to be associated with different formation eras. The phyllosilicates are seen only in the oldest (Noachian) rocks whereas the sulfates appear in younger (Hesperian) rocks (Bibring et al. Reference Bibring, Langevin, Gendrin, Gondet, Poulet, Berthé, Soufflot, Arvidson, Mangold and Mustard2005) and the different formation (Bibring et al. Reference Bibring, Langevin, Mustard, Poulet, Arvidson, Gendrin, Gondet, Mangold, Pinet and Forget2006) epochs are related to a change in the amount of water available at formation (Chevrier & Mathe, 2007), and changes in pH conditions from neutral to acidic. Based on orbital measurements, Martian sulfate and phyllosilicate terrains appear to be geographically separated and confined to discrete areas. In Utah, we see mixtures with the sulfates mixed in with the phyllosilicates. However, the scale of layering, and the composition of materials that can be observed from orbit may bias the interpretation. At ground scale on Mars, mixtures of materials may also be found where the ancient rocks were subsequently weathered under more acidic conditions.
In summary, while there are clearly differences, the soils of the MDRS area in Utah provide useful mineralogical analogues for Mars. The Martian crust is predominantly basaltic in composition (Murchie et al. Reference Murchie, Mustard, Ehlmann, Milliken, Bishop, McKeown, Dobrea, Seelos, Buczkowski, Wiseman and Arvidson2009) and the surface materials are derived from this protolith with varying degrees of alternation. Although alternation is sometimes intense, the original protolith can still be identified. The primary mineralogy is therefore minerals such as olivine, pyroxene and plagioclase. In contrast, the rocks at MDRS are terrestrial and marine siliciclastic sediments derived from a granitic crust via weathering and erosion with deposition in marine and terrestrial environments. The dominant minerals are therefore quartz and a range of clays. Basaltic elements are absent, except as fluvial clasts in Quaternary sediments derived from the Aquarius Plateau to the west. Despite this first-order dissimilarity, there are many minerals common to Mars and at MDRS, even though their abundances and proportions may be different. Those seen on Mars include phyllosilicates such as montmorillonite and nontronite (Murchie et al. Reference Murchie, Mustard, Ehlmann, Milliken, Bishop, McKeown, Dobrea, Seelos, Buczkowski, Wiseman and Arvidson2009), calcium sulfates such as gypsum and magnesium sulfates such as kieserite (Murchie et al. Reference Murchie, Mustard, Ehlmann, Milliken, Bishop, McKeown, Dobrea, Seelos, Buczkowski, Wiseman and Arvidson2009), sodium sulfates such as thenardite (Clark et al. Reference Clark, Morris, McLennan, Gellert, Jolliff, Knoll, Squyres, Lowenstein, Ming and Tosca2005) and iron oxides such as haematite (Murchie et al. Reference Murchie, Mustard, Ehlmann, Milliken, Bishop, McKeown, Dobrea, Seelos, Buczkowski, Wiseman and Arvidson2009). While it was not identified in our study, jarosite is also expected in the study area from the oxidation of sulfides. Therefore, we conclude that there are many overall similarities that may be important and provide useful tests of instruments planned for Mars.
Discussion, results of soil chemical analysis
Cations in sites S1–S4 are distributed as Na>Ca>Mg but site 5 is Ca>Na>Mg. Sites S1–S4 are on weathered bedrock, but site 5 is derived from the SF bedrock but is also within the floodplain of the Fremont River. The alluvium would be flushed by river floods and so would be expected to have a lower concentration of the more soluble sodium and magnesium salts. This process would be helped by the better draining nature of the floodplain sediments – silt and fine sands – rather than weathered clays and sandstones of the other sites. For the three major anions, sites S1 and S3–S5 have SO4>>>Cl> HCO3/CO3 but site 2 is SO4>>>HCO3/CO3>Cl. Carbonate/bicarbonate may be greater than Cl at site S2 because of the carbonate cements in the sandstones of the Dakota formation that overlie it (see Battler et al. Reference Battler, Clarke, Coniglio and Clarke2006; Kotler et al. Reference Kotler, Quinn, Foing, Martins and Ehrenfreund2011). The predominantly sodium and calcium sulfate salts with lesser magnesium sulfate salts that would be expected from these data are consistent with that reported in the literature from the weathered MS across the Colorado Basin (Whittig et al. Reference Whittig, Deyo and Tanji1982; Azimi-Zoooz & Duffy Reference Azimi-Zoooz and Duffy1993).
The distribution of two important biological nutrients, nitrate and phosphorous, is problematic. The three soil samples that have high nitrate (S1, S3 and S4, Table 4) also have high inherited marine organic content, and so it is possible that the high nitrate originates from the weathering of nitrogenous organic compounds. If so, then there may be a trend due to weathering with the least weathered site S1 having the highest nitrate and the most weathered site S4 the least. This hypothesis would explain why site S2 has very low nitrate (no detected organic matter). It does not explain why the alluvium at site S5 has almost no nitrate, as it also has relatively elevated organic content. Perhaps the plants observed in that area have utilized the available nitrate. The high phosphate in the relatively fresh MS (site S1) and in the alluvium of site S5 may be related to the relatively high organic matter in these samples.
Information on the availability of nitrate on Mars is important for determining its habitability (Stoker et al. Reference Stoker, Zent, Catling, Douglas, Marshall, Archer, Clark, Kounaves, Lemmon and Quinn2010a), and currently there are no relevant observations. The nitrogen abundance in the Martian atmosphere is low, and the ability of bacteria to fix nitrogen under low pressures is uncertain.
When comparing the soil chemistry results from all sites (Table 4), a high correlation between sulfate and sodium ions can be seen, suggesting that sodium sulfates such as thenardite (Na2SO4), and/or mirabilite (Na2SO4·10H2O) may predominate at all the sites. While sodium sulfate minerals have not yet been directly detected on Mars, brine evolution modelling (Tosca & McLennan Reference Tosca and McLennan2006) suggests that thenardite, bloedite (MgSO4·Na2SO4·4H2O), and glauberite (Na2SO4) should be present in brines such as those that formed the Meridiani Planum evaporite deposits. Modelling of analytical results from the Opportunity rover indicates the presence of minor thenardite (Clark et al. Reference Clark, Morris, McLennan, Gellert, Jolliff, Knoll, Squyres, Lowenstein, Ming and Tosca2005); however, it is not yet clear as to whether this is a primary evaporate phase or the result of weathering. Thenardite facilitates the detection of certain classes of organic compounds, such as aromatic amino acids, by laser desorption Fourier transform mass spectrometry (LD-FTMS) (Richardson et al. Reference Richardson, Hinman and Scott2009). Sodium sulfates, like other sulfates, have the ability to trap organic compounds during their formation (Aubrey et al. Reference Aubrey, Cleaves, Chalmers, Skelley, Mathies, Grunthaner, Ehrenfreund and Bada2006) and can be a by-product of microbial activity (Richardson et al. Reference Richardson, Hinman and Scott2009). We propose that the sodium sulphate-rich soils at MDRS are valuable in three ways: as analogues for some Martian regolith materials, as possible favourable hosts of identifiable organic materials and as potential by-products of microbial activity. Further study of these may assist in the differentiation between primary and secondary evaporate minerals on Mars, potential biological roles in their formation and as natural experiments for organic molecule detection methodologies.
Discussion of relationships between soil chemistry, organics and biology
The chemistry and mineralogy are important factors influencing the biology and the distribution of different types of microbes in soils. While the relationships are complex and a complete analysis is beyond the scope of this work, we discuss some general features. Nitrogen is an important nutrient for the biosphere (Prescott et al. Reference Prescott, Harley and Klein2005). The microbial numbers varied with location between the different soils, with the highest microbe number found in soil core S5. This core also has the lowest value found for nitrate. However, while the vegetation was sparse, there was still more vegetation than at any other location we sampled. The combination of high microbe number and more vegetation could be inversely correlated with the nitrate abundance since both bacteria and vegetation would use it. For example, in the Atacama Desert there are large accumulations of nitrate (of lightning/atmospheric origin) due to the lack of microbial denitrification (Gómez-Silva et al. Reference Ehlmann, Mustard, Murchie, Poulet, Bishop, Brown, Calvin, Clark, Des Marais and Milliken2008a, Reference Griffith, Willcox, Powers, Nelson and Baxterb).
The highest concentration of organics was found in Core S1, a fresh exposure of MS known for being rich in organics. The organic analysis results from these samples bode well for finding organics in fresh exposures of ancient phyllosilicate deposits on Mars. However, the complete absence of detectable organic matter (<0.1%) in soils derived from the Brushy Basin of the MF (soil core S2) suggests that all phyllosilicates will not host organics. The lack of organics in the MF can be explained through several factors. First, the original depositional environment was probably low in organic matter as compared to the depositional environment in the MS. The Brushy Basin member of the MF was deposited on a fluvial plain in an arid to semi-arid paleoclimate (Demko & Parish Reference Demko and Parish2001; Demko et al. Reference Demko, Currie and Nicoll2004). Vegetation would have been sparse, close to water courses and the resulting organic deposition was low. As discussed previously, minerals we identified in the MF by XRD (volkanskoite and navajoite) likely resulted from organic replacement during diagenesis. Furthermore, the sediments are, for the most part, highly oxidized containing Fe3+ minerals such as goethite, haematite and nontronite, and any organic matter in the sediments would have been rapidly oxidized soon after deposition. Finally, the soils of the Brushy Basin member seem inimical to modern vegetation, probably due to the high alkalinity and salinity, and the swelling nature of the clays disrupts root formation. As a result very little, if any, organic matter is added to the soils from the modern biota. The soils are still highly oxidizing because of their inherited mineralogy, and the preservation potential of any contemporary organic matter, for example that transported in by wind, is still expected to be low.
Other analyses of MF soils in proximity to MDRS also suggest that they are low in organic matter (Martins et al. 2011; Orzechowska et al. Reference Orzechowska, Kidd, Foing, Kanik, Stoker and Ehrenfreund2011). Clays are known to strongly absorb and bind organic molecules, often preventing their extraction for detection (Ehrenfreund et al. Reference Gattinger, Günthner, Schloter and Munch2011). In spite of this risk factor, the excitement generated by the discovery of phyllosilicates on Mars has led to these deposits being targeted by the next Mars mission.
The core S5 may be enriched in organics (relative to S2 and S3) due to the fact that this area is more vegetated than these other locations. Frequently higher organic matter contents are encountered under vegetation (e.g. Cammeraat & Imeson, Reference Cammeraat and Imeson1999).
We do not see a noticeable correlation between soil organic concentration and microbial numbers. This is surprising since organic matter is a potential carbon source for micro-organisms, and subsurface microbes should be dominated by heterotrophic organic scavengers, but the organics available might be difficult for micro-organisms to use (i.e. organic matter that few organisms can degrade). This is suggested by the fact that the organic carbon released by the Wakely–Black method (typically used to assess the agricultural availability of organic carbon) is very low in all the soils.
PCR analysis performed at MDRS showed that all three domains of life (Archaea, Bacteria and Eukarya) were present but could not be found in all samples (Table 5). Note that ‘not detected’ is not the same as ‘is it not present’, previous experiments have shown the necessity of adding a spike to account for possible DNA losses during extraction (Direito et al. Reference Direito, Ehrenfreund, Marees, Staats, Foing and Röling2011), and this becomes more relevant when analysing samples with an elevated clay content. Certain soils and, in particular, clays are known to adsorb DNA (e.g. Saeki & Sakai, Reference Saeki and Sakai2009). Losses during DNA extraction also indicate the necessity of using very sensitive techniques. Sensitive amplification-based methods targeting hereditary molecules are therefore a good option for life detection (Direito et al. Reference Direito, Ehrenfreund, Marees, Staats, Foing and Röling2011).
The PLFA analysis results (Fig. 10) for microbe distribution shows that all the soils have rather similar distribution of microbial groups. This is consistent with the chemical similarities between all the soils. PLFA content in the cores collected at MDRS revealed values, in cell equivalents, between 3.0×10⁶ and 1.8×10⁷ (Fig. 8). This is less than ten times higher than in the hyperarid Yungay area of Atacama Desert in Chile, a region known for low levels of organics and soil bacteria (Gómez-Silva et al. Reference Ehlmann, Mustard, Murchie, Poulet, Bishop, Brown, Calvin, Clark, Des Marais and Milliken2008a, Reference Griffith, Willcox, Powers, Nelson and Baxterb), where values between 2.0×10⁶–2.4×10⁶ cells g−1 were seen for subsurface samples (Lester et al. Reference Lester, Satomi and Ponce2007). In addition, PLFA analysis of MDRS core samples, revealed Actinomycetes (Actinobacteria), Proteobacteria and Firmicutes in all deepest core sections analysed (Fig. 9). In the Yungay area, the detectable microbial community, based on PLFA, was also primary composed by Actinobacteria, Proteobacteria and Firmicutes; with the amount of PLFA indicative of Proteobacteria decreasing ∼10–20% from surface to subsurface and an increase of Firmicutes from surface to subsurface samples (Lester et al. Reference Lester, Satomi and Ponce2007). Firmicutes were detected in all deepest soil cores sections we analysed, while this phylum was only a minor component in MDRS surface samples (Direito et al. Reference Direito, Ehrenfreund, Marees, Staats, Foing and Röling2011). Firmicutes includes anaerobic and aerobic spore formers, often associated with soils such as Bacilli and Clostridium (Connon et al. Reference Connon, Lester, Shafaat, Obenhuber and Ponce2007). Proteobacteria was the microbial group with the highest abundance in core samples (Fig. 9). Culture-independent molecular analyses directed at ribosomal RNA genes on MDRS surface samples revealed that members of the Actinobacteria, Proteobacteria, Bacteroidetes and Gemmatimonadetes phyla were most frequently found and with significant contributions (Direito et al. Reference Direito, Ehrenfreund, Marees, Staats, Foing and Röling2011).
All cores except for S3 show a population of anaerobic metal reducers. This is not surprising since minerals with bioactive metals are prevalent in the area. Metals play an integral role in the life processes of microbes. Some metals, such as Cr, Ca, Mg, Mn, Cu, Na, Ni and Zn are essential as micronutrients for various metabolic activities and for redox processes (Ramasamy et al. Reference Ramasamy, Kamaludeen, Banu, Singh and Tripathi2007). Organisms may be reducing iron from sulfides, releasing sulfates such as gypsum or could be associated with more cryptic metals such as uranium and vanadium, or the Cr-containing clay volkanosite that was identified in Brushy basin member soils by our XRD studies.
Comparing PCR results with PLFA, Eukaryotes were encountered in all analysed cores by PLFA, except in S1C11, while this domain was detected in this core section by PCR analysis. Eukarya were detected in S6C1 and S6C5 by PCR and this domain was also detected by PLFA analysis in S5C5 (deepest section of core S5 collected nearby S6). On the other hand, PLFA revealed different Bacteria groups in S5C5, while Bacteria were only detected by PCR in S6 top core section (S6C1). These results show the importance of using different techniques that can complement each other. PLFA analysis can be used to determine some Bacteria microbial groups and Eukarya presence but not Archaea, for this purpose analysis such as phospholipid etherlipid (PLEL) would be required (Gattinger et al. Reference Godfrey, Everitt and Duque2003). The PCR data show that Archaea are present but does not reveal number distributions. The absence of microbial degradation due to low water activities in desert soils may help preserve PLFA, DNA and other cellular markers long after cell death (Lester et al. Reference Lester, Satomi and Ponce2007). Preservation of biomarkers will be an important factor when searching for evidence of life on Mars.
Summary and conclusions
The DOMMEX mission performed a survey where soil cores were collected from representative locations in each of the four main geologic units surrounding the MDRS. These soils and representative samples of the rocks from which they were derived were analysed for mineralogy, soluble ion chemistry, organics and microbial population. These measurements allow a general characterization of the environment, and are representative of the type of environmental survey that can be performed by a human crew on a Mars mission. The soils of the MDRS locality have important similarities chemically and mineralogically with soils on Mars.
The MDRS area is an excellent Mars analogue for geomorphologic and sedimentary processes that occur or once occurred on Mars. Aspects of the mineralogy, in particular the presence of smectite clays, local acidic weathering and sulfates, and highly oxidized minerals are analogous to what is found on Mars. These features, in combination with the MDRS facility, make the area both a valuable scientific analogue to Mars and a useful site to test exploration technologies and methodologies. The environment with its extremes of temperature, high salinity, overall lack of moisture and diverse bedrock geology allows investigation of the distribution and fate of both inherited and introduced organic matter in different soil types. These soils host a diverse assemblage of microbes (see also Direito et al. Reference Direito, Ehrenfreund, Marees, Staats, Foing and Röling2011).
Aeolian dust redistribution is inferred to have resulted in a relatively homogeneous distribution of labile salts across the surface in the MDRS area. These are dominated by sodium sulfates with lesser amounts of calcium and magnesium sulfates.
The MDRS area is a useful analogue to test instruments and compare results for the upcoming MSL mission that lands a long-range rover on Mars in 2012. The MSL mission science goals (JPL 2010) include:
1. Assessing the biological potential of at least one target environment by determining the nature and inventory of organic carbon compounds, searching for the chemical building blocks of life and identifying features that may record the actions of biologically relevant processes.
2. Characterizing the geology of the landing region at all appropriate spatial scales by investigating the chemical, isotopic and mineralogical composition of surface and near-surface materials and interpreting the processes that have formed rocks and soils.
This paper, along with others in this special issue on MDRS (Martins et al. Reference Martins, Sephton, Foing and Ehrenfreund2011; Orzechowska et al. Reference Orzechowska, Kidd, Foing, Kanik, Stoker and Ehrenfreund2011; Ehrenfreund et al. Reference Gattinger, Günthner, Schloter and Munch2011) show that the MDRS site contains a range of organic matter preservation styles, from preservation of primary organic matter in the MS to its complete destruction in the MF. We show also that preservation in the MS co-varies with the degree of weathering. Furthermore, Thiel et al. (Reference Thiel, Ehrenfreund, Foing, Pletser and Ullrich2011), Direito et al. (Reference Direito, Ehrenfreund, Marees, Staats, Foing and Röling2011) and this paper show that diverse communities of microbes are present in the subsurface environment in highly variable abundances. These papers also show that the organic matter and microbial communities in the MDRS area are present in sediments deposited in a range of environments that, in many respects, are analogous to those predicted to have occurred on Mars during its early history, including marine, evaporitic and fluvial sediments. Furthermore, subsequent modification of the essentially flat-lying succession through exhumation and denudation and the associated highly oxidizing regolith parallels Martian landscape evolution (this paper, Clarke & Pain Reference Clarke, Pain and Cockell2003; Clarke & Stoker Reference Clarke and Stoker2011).
We propose that the MDRS site is a prime analogue for terrestrial testing of instruments and procedures to assist in addressing the goals of the MSL mission. In particular, MDRS will assist with the following questions:
• Recognition of primary organic matter in sediments.
• Effects of progressive oxidative weathering on the detection of primary organic matter.
• Relationship of thenardite (and other sodium sulfate species) on organic detection.
• Relationship of clay mineralogy to preservation potential, extraction and detection of organic compounds.
• Co-variability of biosignatures with regolith parameters such as oxidation, pH, salinity, nutrients and mineralogy.
Acknowledgements
The work represented in this paper was funded by the NASA Moon and Mars Analogs (MAMA) research program. Susana Direito was supported by ESA grant for Ground based facilities: ‘Simulations of organic compounds and micro-organisms in Martian regolith analogues: SocMar’. The Mars Society provided access to the MDRS, and we thank the Director Artemis Westinberg, and volunteer staff and mission support, for their tireless efforts to provide an operational environment for human exploration related studies and training. The University of California Davis provided sample analysis and assisted with interpretation of the results for soil chemistry. We thank ILEWG and Ecole de l Air for support to the EuroMoonMars crews that contributed in the field studies. Finally, we are grateful to Mary Sue Bell, Larry Lemke, and Joshua Nelson for contributing time and energy as crew members of MDRS mission that supported our sample collection activity. Samples were acquired at MDRS crew 83 (November 2009).