Introduction
Waterhemp [Amaranthus tuberculatus (Moq.) Sauer] is a highly prolific, dioecious, broadleaf weed that is of great economic importance in many cropping systems across North America. Amaranthus tuberculatus is a member of the Amaranthaceae family and is among the most competitive weed species (Costea et al. Reference Costea, Weaver and Tardif2005). Amaranthus tuberculatus interference can reduce soybean [Glycine max (L.) Merr.] and corn (Zea mays L.) yields up to 73% and 74%, respectively (Steckel and Sprague Reference Steckel and Sprague2004; Vyn et al. Reference Vyn, Swanton, Weaver and Sikkema2007). Furthermore, A. tuberculatus has high fecundity; Steckel et al. (Reference Steckel, Sprague, Hager, Simmons and Bollero2003) reported A. tuberculatus seed production in excess of 1 million plant−1 in Illinois, while Hartzler et al. (Reference Hartzler, Battles and Nordby2004) reported 4.8 million seeds from a single plant in Iowa. As an obligate outcrossing species, A. tuberculatus has high genetic diversity resulting in increased potential for selection of herbicide-resistant (HR) biotypes (Liu et al. Reference Liu, Davis and Tranel2012; Steckel Reference Steckel2007).
Globally, A. tuberculatus has been confirmed to be resistant to herbicides targeting seven distinct sites of action, including resistance to the acetolactate synthase (ALS) inhibitors (Weed Science Society of America Site of Action [WSSA SAO] Group 2), synthetic auxins (WSSA SOA Group 4), photosystem II (PS II) inhibitors (WSSA SOA Group 5), 5-enolpyruvylshikimate 3-phosphate synthase inhibitors (WSSA SOA Group 9), protoporphyrinogen oxidase (PPO) inhibitors (WSSA SOA Group 14), very-long-chain fatty-acid elongase inhibitors (WSSA SOA Group 15), and 4-hydroxyphenylpyruvate dioxygenase inhibitors (WSSA SOA Group 27) (Heap Reference Heap2021). Even more troublesome are reports of six-way multiple herbicide–resistant (MHR) A. tuberculatus in Missouri and Illinois (Shergill et al. Reference Shergill, Barlow, Bish and Bradley2018; Strom et al. Reference Strom, Gonzini, Mitsdarfer, Davis, Riechers and Hager2019). In Ontario, HR A. tuberculatus was first reported in 2002 in Lambton County with a population resistant to both ALS and PS II inhibitors (Costea et al. Reference Costea, Weaver and Tardif2005; Vyn et al. Reference Vyn, Swanton, Weaver and Sikkema2007). In 2014, Schryver et al. (Reference Schryver, Soltani, Hooker, Robinson, Tranel and Sikkema2017b) reported a population to be resistant to Group 2, 5, and 9 herbicides. Most recently in Ontario, A. tuberculatus populations have been confirmed resistant to Group 2, 5, 9, and 14 herbicides (Benoit et al. Reference Benoit, Hedges, Schryver, Soltani, Hooker, Robinson, Laforest, Soufiane, Tranel, Giacomini and Sikkema2019).
PS II–inhibitor resistance is not a new phenomenon. Ryan (Reference Ryan1970) reported the first PS II–inhibitor resistant weed when both atrazine and simazine failed to control a population of common groundsel (Senecio vulgaris L.). PS II–inhibitor resistant A. tuberculatus was first reported in 1990 in Nebraska (Anderson et al. Reference Anderson, Roeth and Martin1996). The mechanisms of herbicide resistance are commonly divided into target-site resistance (TSR) and non–target site resistance (NTSR). Initial reports found PS II–inhibitor resistance in A. tuberculatus was conferred by TSR, specifically, by a mutation in the psbA gene, which encodes the D1 protein (Foes et al. Reference Foes, Tranel, Wax and Stoller1998). The most common substitution that confers PS II–inhibitor resistance in A. tuberculatus is the glycine-264-serine amino acid substitution (Heap Reference Heap2021). Patzoldt et al. (Reference Patzoldt, Dixon and Tranel2003) identified NTSR in A. tuberculatus in Illinois that conferred resistance to atrazine (symmetrical triazine) but not to metribuzin (asymmetrical triazinone). Ma et al. (Reference Ma, Kaundun, Tranel, Riggins, McGinness, Hager and Riechers2013) further determined this NTSR was due to increased glutathione-S-transferase (GST) activity, which conferred resistance to atrazine in an A. tuberculatus population in Illinois. Evans et al. (Reference Evans, O’Brien, Ma, Hager, Riggins, Lambert and Riechers2017) found that a single GST enzyme, AtuGSTF2, correlated strongly with PS II resistance in A. tuberculatus. In other weed species, NTSR has been found to confer PS II–inhibitor resistance by P450 monooxygenase, which was recently reported to confer metribuzin resistance in rigid ryegrass (Lolium rigidum Gaudin) in Australia (Ma et al. Reference Ma, Lu, Han, Yu and Powles2020). Amaranthus tuberculatus with PS II resistance due to NTSR is resistant to atrazine but sensitive to metribuzin (Patzoldt et al. Reference Patzoldt, Dixon and Tranel2003; Vennapusa et al. Reference Vennapusa, Faleco, Vieira, Samuelson, Kruger, Werle and Jugulam2018). The chlorine at the one position of the atrazine molecule provides a binding site for the GST enzyme, resulting in conjugation of atrazine to glutathione; the GST enzyme does not bind to the oxygen at the one position of the metribuzin molecule (O’Brien et al. Reference O’Brien, Davis and Riechers2018). In contrast, A. tuberculatus resistant to atrazine due to the D1 glycine-264-serine amino acid substitution was found to also be resistant to metribuzin (Heap Reference Heap2021; PJT, unpublished data).
Metribuzin is commonly used preemergence for weed control before soybean emergence (OMAFRA 2018). Metribuzin is also utilized postemergence in processing tomatoes (Solanum lycopersicum L.). In Ontario, A. tuberculatus control with metribuzin has been variable. Vyn et al. (Reference Vyn, Swanton, Weaver and Sikkema2007) reported that metribuzin (1,120 g ha−1) applied preemergence controlled A. tuberculatus 24% and 99% at Petrolia and Cottam, ON, respectively, at 10 wk after emergence (WAE). Schryver et al. (Reference Schryver, Soltani, Hooker, Robinson, Tranel and Sikkema2017a) reported that metribuzin (1,120 g ha−1) controlled A. tuberculatus 88% at 8 wk after application (WAA) at sites located on Walpole Island and near Cottam, ON.
There is little published research on the biological activity of metribuzin on PS II–inhibitor resistant A. tuberculatus conferred by NSTR and TSR mechanisms. Studies have been undertaken using metribuzin to determine whether PS II–inhibitor resistance in a population is conferred by TSR or NTSR, but no studies have directly compared populations of A. tuberculatus with TSR and NTSR (Evans et al Reference Evans, Strom, Riechers, Davis, Tranel and Hager2019; Patzoldt et al. Reference Patzoldt, Dixon and Tranel2003). Within Ontario, A. tuberculatus populations possess either target-site or non-target site mechanisms of resistance (or maybe both mechanisms to PS II–inhibitors), with atrazine routinely providing poor control, while metribuzin has provided variable control dependent upon the mechanism of resistance (Schryver et al. Reference Schryver, Soltani, Hooker, Robinson, Tranel and Sikkema2017a; Vyn et al. Reference Vyn, Swanton, Weaver and Sikkema2007). The objective of this study was to determine the biologically effective dose (BED) of metribuzin applied preemergence and postemergence for control of MR and MS PS II–inhibitor resistant A. tuberculatus in Ontario.
Materials and Methods
Field Studies
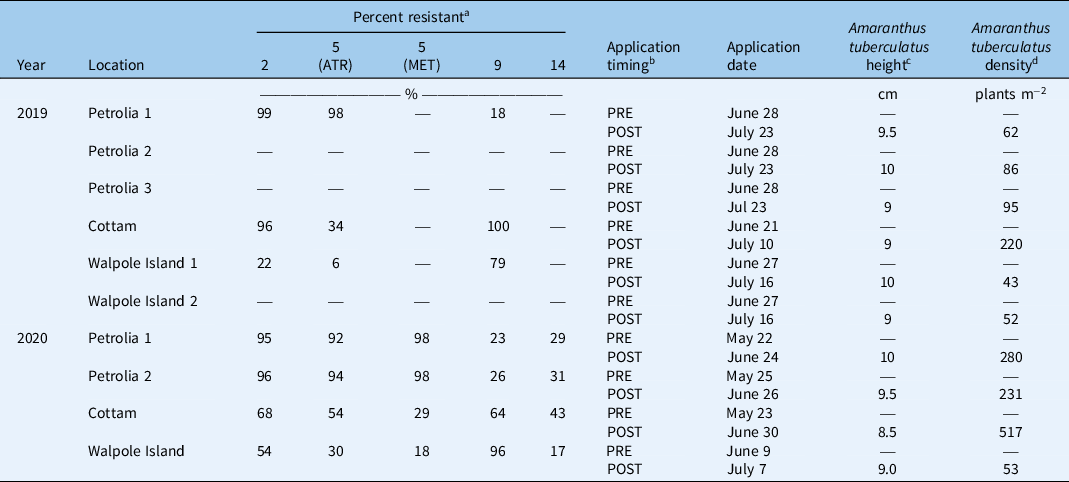
Two separate field studies were conducted over 2 yr. Each study had three experiments in 2019 and two in 2020 for a total of 5 site-years per study. The locations near Cottam (42.149°N, 82.683°W) and on Walpole Island (42.561°N, 82.503°W; 42.551°N, 82.479°W), ON, were previously confirmed to have NTSR PS II–inhibitor resistant A. tuberculatus conferred by enhanced metabolism, while A. tuberculatus at the sites near Petrolia (42.864248, -82.212616; 42.864618, -82.215652; 42.873273, -82.216026), ON, were confirmed to have PS II–inhibitor TSR A. tuberculatus due to a glycine-264-serine substitution (ML, unpublished data; PJT, unpublished data). For the remainder of this paper A. tuberculatus with TSR and NTSR will be referred to as metribuzin-resistant (MR) and metribuzin-sensitive (MS), respectively.
All experiments were conducted in non-cropped areas, because metribuzin postemergence would kill soybean. The MS A. tuberculatus sites were prepared with one pass of a tandem disk followed by a second pass with a field cultivator in 2019 and 2020. The MR A. tuberculatus sites were prepared with a tractor-mounted rototiller set to a shallow depth (<10 cm) in 2019, and two passes of a field cultivator in 2020. Due to the differences in A. tuberculatus resistance profile among sites, different cover sprays were used to control all other weed species (Table 1). At the MS sites, glyphosate (Roundup WeatherMax®, Bayer CropScience, Calgary, AB, Canada) (450 g ha−1) was applied postemergence to control all other species. At the MR sites, imazethapyr (Pursuit®, BASF Canada, Mississauga, ON, Canada) (75 g ha−1) applied preemergence followed by quizalofop-p-ethyl (Assure® II, AMVAC Canada, Vancouver, BC, Canada) (72 g ha−1) + Sure-Mix™ (oil-surfactant blend, AMVAC Canada) (0.5% v/v) applied postemergence were used to control annual broadleaf and grass weeds, respectively. Additionally, experimental sites were hand weeded and hand hoed as necessary to control all weeds other than A. tuberculatus.
Year, location, resistance profile, and application information for 10 field experiments conducted in 2019 and 2020 in Ontario, Canada.

a Numbers representing WSSA Group 2 (acetolactate synthase inhibitors), Group 5 (photosystem II inhibitors); ATR, atrazine; Met, metribuzin, Group 9 (5-enolpyruvylshikimate 3-phosphate synthase inhibitors), and Group 14 (protoporphyrinogen oxidase inhibitors).
b POST, postemergence; PRE, preemergence.
c Average height of plant on day of application. Mean of two measurements per replication.
d Mean density based on the average of two density counts in non-treated control within each replication.
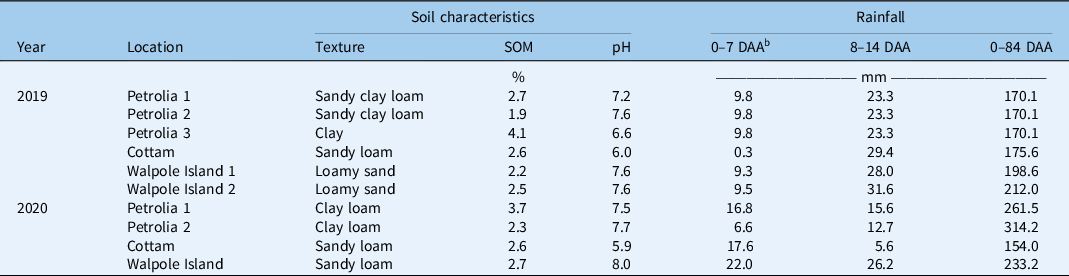
Experiments were set up in a randomized complete block design with four replications. Plots measured 2.25-m wide by 8-m long with a 2-m alley between replicates. Each replicate included a non-treated control. Metribuzin (Sencor® 480 F, Bayer CropScience, Calgary, AB) was applied at 70, 140, 280, 560, 1,120, 2,240, and 4,480 g ai ha−1 preemergence and postemergence at the MS A. tuberculatus sites. At MR A. tuberculatus sites, metribuzin was applied at 70, 140, 250, 560, 1,120, 2,240, 4,480, 8,960, and 17,920 g ha−1 preemergence and postemergence. Pyroxasulfone/flumioxazin (Fierce®, Valent Canada, Guelph, ON, Canada) (240 g ai ha−1) preemergence was included for both MR and MS A. tuberculatus sites, as it is currently considered the industry standard for A. tuberculatus control in soybean (Hedges et al. Reference Hedges, Soltani, Robinson, Hooker and Sikkema2018; Schryver et al. Reference Schryver, Soltani, Hooker, Robinson, Tranel and Sikkema2017a). Fomesafen (Reflex®, Syngenta Canada, Guelph, ON, Canada) (240 g ai ha−1) + Turbocharge® (oil-surfactant blend, Syngenta Canada) (0.5%) was included in all experiments as the industry standard postemergence (Vyn et al. Reference Vyn, Swanton, Weaver and Sikkema2007). Herbicides were applied using a CO2-pressurized backpack sprayer calibrated to deliver a spray volume of 200 L ha−1 at 240 kPa. The spray boom was equipped with four ULD 110-02 nozzles (Pentair, New Brighton, MN, USA) spaced 50 cm apart, producing a spray width of 2.0 m. Preemergence herbicides were applied after the last tillage pass. Rainfall was recorded at each site (Table 2). Postemergence herbicides were applied when A. tuberculatus reached 10 cm in height.
Year, location, soil characteristics, and rainfall information for 10 field experiments conducted in 2019 and 2020 in Ontario, Canada. a

a Abbreviations: SOM, soil organic matter of the upper 15 cm of the soil profile; DAA, days after application.
b Days after preemergence application.
Amaranthus tuberculatus control was assessed visually as the A. tuberculatus biomass reduction relative to the non-treated control at 2, 4, 8, and 12 WAA, on a 0 to 100 scale, with 0 representing no control and 100 complete control. Amaranthus tuberculatus density and biomass were collected at 8 WAA. Density was determined by randomly placing two 0.25-m2 quadrats in each plot and counting the A. tuberculatus plants inside the quadrats. The A. tuberculatus plants were then cut at the soil surface, placed in paper bags, dried in a kiln to a constant moisture, and weighed to determine dry biomass.
Controlled Environment Studies
Controlled environment experiments were conducted in 2020 in both Ridgetown and Guelph, ON. Amaranthus tuberculatus seeds were collected from two MS locations (collected near Cottam and on Walpole, ON) and two MR locations (collected near Petrolia, ON). MS and MR with metribuzin applied preemergence and postemergence were repeated twice in time for a total of eight controlled environment experiments. The A. tuberculatus seeds were stratified via refrigeration at a constant temperature of 3.5 C for 7 wk before germination.
For the metribuzin postemergence experiments, A. tuberculatus seeds were germinated in trays of soilless mixture (Agro-Mix® G5, Fafard®, Agawam, MA, USA) and transplanted at the first true leaf stage into individual pots (10-cm diameter) containing the same soilless mixture. The ingredients of the soilless mixture included peat, perlite, limestone, balanced nutrient charge with micronutrients, and gypsum. When the average A. tuberculatus height was 10 cm, metribuzin was applied at 70, 140, 280, 560, 1,120, 2,240, and 4,480 g ai ha−1 for the MS populations and 280, 560, 1,120, 2,240, 4,480, 8,960, and 17,920 g ai ha−1 for the MR populations. Fomesafen (240 g ai ha−1) + Turbocharge® (0.5%) was included in both the MR and MS experiments to represent the industry standard. Applications were made in a spray chamber calibrated to deliver 200 L ha−1 using a flat-fan nozzle at 280 kPa while moving at 2.15 km h−1.
For the metribuzin preemergence experiments, trays (14.5-cm long, 10-cm wide, and 5-cm deep) were filled with approximately 3.5 cm of topsoil (loamy sand, 8.4% organic matter, 7.3 pH). Seventy A. tuberculatus seeds were spread evenly on the soil surface of each tray and then covered with 0.5 cm of topsoil; the trays were watered and then allowed to equilibrate overnight. Metribuzin was applied the following day at the rates mentioned in the previous paragraph. Pyroxasulfone/flumioxazin (240 g ai ha−1) preemergence was included to represent the industry standard for preemergence herbicides. Herbicides were applied in a spray chamber; in Ridgetown, the spray chamber was calibrated to deliver 200 L ha−1 using flat-fan nozzles at 280 kPa while moving at 2.15 km h−1; and in Guelph, the spray chamber was calibrated to deliver 210 L ha−1 at 276 kPa while moving at 4 km h−1. Following herbicide application, the trays were then returned to the controlled environment (Ridgetown) or growth room (Guelph) and watered with approximately 15 mm of water to ensure herbicide activation. Controlled environment experiments were set up in a completely randomized design with two non-treated controls per replicate.
Amaranthus tuberculatus control was assessed visually as the A. tuberculatus biomass reduction relative to the non-treated control at 1, 3, and 5 WAA, on a 0 to 100 scale, with 0 representing no control and 100 complete control. Fresh weight was determined at 5 WAA by cutting the plant material at the soil surface and weighing it. Fresh weight is presented as fresh weight per tray.
Statistical Analysis
Both MR and MS field studies and controlled environment studies were analyzed separately.
Nonlinear Regression
PROC NLIN in SAS v. 9.4 (SAS Institute, Cary, NC, USA) was used to determine parameter estimates, which were then utilized to calculate the effective doses (ED) for 50%, 80%, and 95% A. tuberculatus control for each assessment timing, preemergence and postemergence, for both the MS and MR A. tuberculatus populations. For the field studies, A. tuberculatus control at 2, 4, 8, and 12 WAA at the preemergence application timing were regressed against metribuzin doses using an ascending four-parameter log-logistic model (Equation 1). Preemergence A. tuberculatus density (plants m−2) and biomass (g m−2) were regressed against metribuzin doses using a descending four-parameter log-logistic model (Equation 2). As for A. tuberculatus control, the ED of metribuzin was calculated for 50%, 80%, and 95% reduction in density and biomass relative to the non-treated control. For the postemergence study, A. tuberculatus control data for the MS experiments were fit to an ascending four-parameter log-logistic model (Equation 1), while for the MR experiments the data were fit to an exponential to maximum model (Equation 3); A. tuberculatus density and biomass were fit to an inverse exponential model (Equation 4). For the controlled environment studies, for both the MR and MS populations, A. tuberculatus control data at 1, 3, and 5 WAA were fit to an ascending four-parameter log-logistic model (Equation 1), and fresh weight at 5 WAA was fit to a descending four-parameter log-logistic model (Equation 2). Root mean-square error and modeling efficiency coefficient were calculated and used to determine the best fit of the models (data not presented). The model of best fit was utilized to determine the ED. Where the ED could not be calculated by the regression model or was outside the range of doses utilized, “non-est” (non-estimable) is presented in the tables, as extrapolation outside the doses evaluated in these studies would be unsuitable.
The four-parameter log-logistic equation (ascending) is:
 $y = C + (D - C)/(1 + e^{\{-b^*[log(dose)-log(I_{50})]\}}) $
where C is the lower asymptote of percent control; D is the upper asymptote of percent control; b is the slope about I50; and I50 is the dose eliciting a response equidistant between C and D
The four-parameter log-logistic equation (descending) is:
 $y = C + (D-C)/(1 + e^{\{b^*[log(dose)-log(I_{50})]\}}) $
where C is the lower asymptote of percent relative density or dry biomass reduction; D is the upper asymptote of percent relative density/biomass reduction; b is slope about I50; and I50 is the dose eliciting a response equidistant between C and D.
The exponential to maximum equation is:
 $y = a-b (e^{-c \;dose}) $
where a is the upper asymptote, b is the magnitude, and c is the slope.
The inverse exponential equation is:
 $y = a + b (e^{-c \;dose}) $
where a is the lower asymptote, b is the reduction in y from intercept to asymptote, and c is the slope.
Least-Square Means Comparisons
PROC GLIMMIX was used in SAS v. 9.4 (SAS Institute) to perform a generalized linear mixed-model analysis of variance comparing the non-treated control, metribuzin (560 and 1,120 g ai ha−1), and the industry standards of pyroxasulfone/flumioxazin preemergence and fomesafen postemergence. The random effects were environment, replication within environment, and the treatment by environment interaction. Herbicide treatment was considered the fixed effect. For controlled environment experiments, the random effects were environment and treatment by environment interaction. PROC UNIVARIATE was used to test for normality using the Shapiro-Wilk statistic. Amaranthus tuberculatus control data were modeled using a normal distribution with the identity link function. Amaranthus tuberculatus density and biomass were modeled using a lognormal distribution with an identity link, with data being back-transformed using the omega method (M Edwards, Ontario Agricultural College Statistician, University of Guelph, personal communication). Treatment means were separated using the Tukey-Kramer test (P < 0.05), and letters were assigned for presentation.
Results and Discussion
BED of Metribuzin Applied Preemergence for the Control of MS and MR Amaranthus tuberculatus
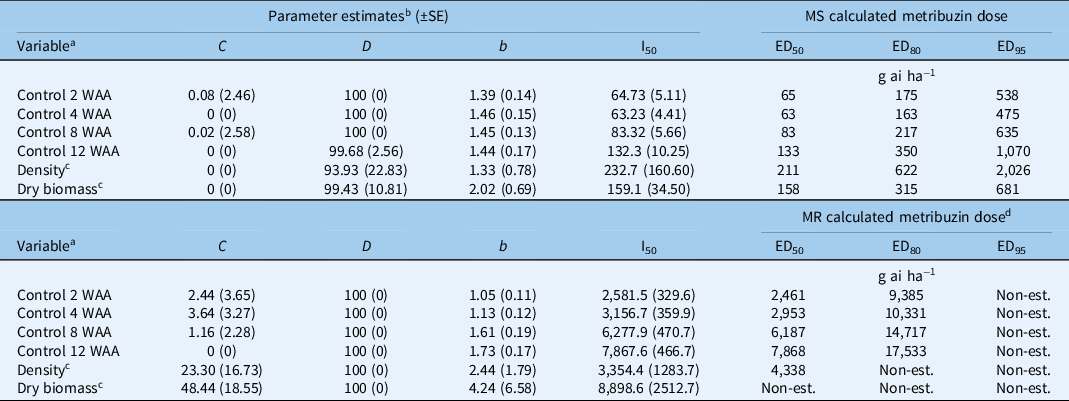
The calculated metribuzin doses applied preemergence for 50%, 80%, and 95% MS A. tuberculatus control were 65, 175, and 538 g ha−1 at 2 WAA (Table 3). At 12 WAA, the calculated metribuzin doses applied preemergence for 50%, 80%, and 95% MS A. tuberculatus control increased to 133, 350, and 1,070 g ai ha−1, respectively. The higher calculated doses at 12 WAA are attributed to metribuzin degradation in the soil and prolonged A. tuberculatus emergence. The calculated metribuzin doses applied preemergence for 50%, 80%, and 95% decreases in MS A. tuberculatus density were 211, 622, and 2,026 g ha−1 and for biomass were 158, 315, and 681 g ha−1, respectively. The higher calculated doses for a density compared with biomass reduction are attributed to the presence of greater number of small A. tuberculatus plants of low biomass at 8 WAA.
Parameter estimates and calculated biologically effective doses of metribuzin applied preemergence for control, and dry biomass and density reduction of metribuzin-sensitive (MS) and metribuzin-resistant (MR) Amaranthus tuberculatus biotypes from 10 field experiments completed in 2019 and 2020 in Ontario, Canada.

a Abbreviation: WAA, weeks after application.
b Regression parameters: y = C + (D − C)/(1 + e(−b*(log(dose)−log(I 50 )))) (ascending); y = C + (D − C)/(1 + e(b*(log(dose)−log(I 50 ))))(descending); C = lower asymptote of percent control or percent relative density/dry biomass, D = upper asymptote of percent control or percent relative density/biomass, b = slope about I50, I50 = the dose eliciting a response equidistant between C and D, ED n , effective dose to elicit response level n.
c Percent of density and dry biomass relative to non-treated control plots within replications.
d Non-est., predicted dose for any parameter was outside of the range of doses used in this study or could not be computed by the model.
The calculated metribuzin doses applied preemergence for 50%, 80%, and 95% MR A. tuberculatus control were 2,461, 9,385, and >17,920 g ha−1, respectively, at 2 WAA, and increased to 7,868, 17,533 and >17,920, respectively, at 12 WAA. The higher calculated doses as the time interval between application and assessment increased are attributed to metribuzin degradation in the soil and prolonged A. tuberculatus emergence. The calculated dose for a 50% reduction in MR A. tuberculatus density was 4,338 g ha−1 at 8 WAA; the calculated doses for 80% and 95% reduction in MR A. tuberculatus and 50%, 80%, and 95% reduction in MR A. tuberculatus biomass were greater than the highest doses used in this study.
The metribuzin resistance factor values for the MR A. tuberculatus biotype for 50% control at 2, 4, 8, and 12 WAA and 50% reduction in density were 38, 47, 75, 59, and 20, respectively (Table 3). The resistance factor value for a 50% reduction in MR A. tuberculatus biomass was not calculable from the doses included in this study.
Field-applied metribuzin dose depends on crop tolerance and soil characteristics. In Ontario, the registered rate of metribuzin preemergence in soybean ranges from 408 to 1,080 g ai ha−1 (Anonymous 2020). For the MS A. tuberculatus populations, the calculated dose for 95% control 12 WAA was 1,070 g ha−1, which is similar to the maximum dose on the label. Sweat et al. (Reference Sweat, Horak, Peterson, Lloyd and Boyer1998) reported that metribuzin (420 g ha−1) applied preemergence controlled A. tuberculatus 98% to 100% at 4 WAA. Hausman et al. (Reference Hausman, Tranel, Riechers, Maxwell, Gonzini and Hager2013) found that metribuzin (420 g ha−1) controlled A. tuberculatus 92% and 73% in 2010 and 2011, respectively, at 60 d after treatment. Evans et al. (Reference Evans, Strom, Riechers, Davis, Tranel and Hager2019) documented that metribuzin applied preemergence at 280 and 560 g ha−1 controlled PS II–inhibitor resistant A. tuberculatus 79% and 95%, respectively, at 4 WAA; PS II–inhibitor resistance was due to NTSR-enhanced metabolism. PS II–inhibitor resistant A. tuberculatus control with metribuzin at 280 and 560 g ai ha−1 decreased to 67% and 88%, respectively, at 6 WAA. Vennapusa et al. (Reference Vennapusa, Faleco, Vieira, Samuelson, Kruger, Werle and Jugulam2018) found similar results, metribuzin (560 g ha−1) controlled PS II–inhibitor resistant (GST mediated) A. tuberculatus. In contrast, Vyn et al. (Reference Vyn, Swanton, Weaver and Sikkema2007) found that metribuzin (1,120 g ha −1) controlled PS II–inhibitor resistant A. tuberculatus with TSR 62% and 24% at 4 and 10 WAE, respectively. In the same study, metribuzin (1,120 g ha−1) did not reduce TSR PS II–inhibitor resistant A. tuberculatus density and biomass.
BED of Metribuzin Applied Postemergence for the Control of MS and MR Amaranthus tuberculatus
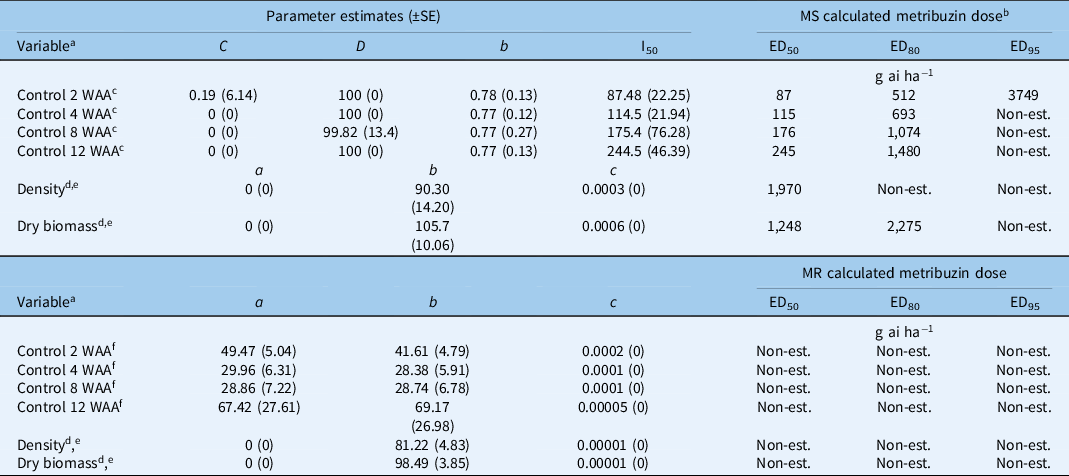
Higher calculated metribuzin doses were required when applied postemergence compared with preemergence for A. tuberculatus control and density and biomass reduction; metribuzin is less efficacious applied postemergence for MR and MS A. tuberculatus. The calculated metribuzin doses applied postemergence for 50%, 80%, and 95% MS A. tuberculatus control were 87, 512, and 3,749 g ha−1 at 2 WAA (Table 4). The calculated metribuzin doses applied postemergence for MS A. tuberculatus control increased as the time interval between application and assessment increased. At 12 WAA, the calculated metribuzin doses applied postemergence increased to 245, 1,480, and >4,480 g ha−1 for 50%, 80%, and 95% control, respectively, of MS A. tuberculatus. The calculated metribuzin dose for a 50% reduction in MS A. tuberculatus density was 1,970 g ha−1, and calculated metribuzin doses for a 50% and 80% reduction in MS A. tuberculatus biomass were 1,248 and 2,275 g ha−1, respectively.
Parameter estimates and calculated effective doses of metribuzin applied postemergence for control, and dry biomass and density reduction of metribuzin-sensitive (MS) and metribuzin-resistant (MR) Amaranthus tuberculatus biotypes from 10 field experiments completed in 2019 and 2020 in Ontario, Canada.

a Abbreviation: WAA, weeks after application.
b Non-est., predicted dose for any parameter was outside of the range of doses used in this study or could not be computed by the model.
c Regression parameters: y = C + (D − C)/(1 + e(−b*(log(dose)−log(I 50 )))) (ascending), where C = lower asymptote of percent control, D = upper asymptote of percent control, b = slope about I50, I50 = the dose eliciting a response equidistant between C and D, ED n , effective dose to elicit response level n.
d Regression parameters: y = a + b(e–c dose), where a is the lower asymptote, b is the reduction in y from intercept to asymptote, and c is the slope.
e Percent of density and dry biomass relative to non-treated control plots within replications.
f Regression parameters: y = a − b (e−c dose), where a is the upper asymptote, b is the magnitude, and c is the slope.
The calculated metribuzin doses applied postemergence for 50%, 80%, and 95% MR A. tuberculatus control and 50%, 80%, and 95% reduction in density and biomass could not be estimated from the doses evaluated in this study.
There is limited published research on metribuzin applied postemergence. Patzoldt et al. (Reference Patzoldt, Dixon and Tranel2003) reported that metribuzin applied postemergence at 32 and 44 g ha−1 reduced growth of uniformly sensitive and segregating for PS II–inhibitor resistant A. tuberculatus populations, respectively, by 50% in controlled environment studies.
MS and MR Amaranthus tuberculatus Control with Metribuzin Compared with Industry Standards
Metribuzin Preemergence Compared with Flumioxazin/Pyroxasulfone
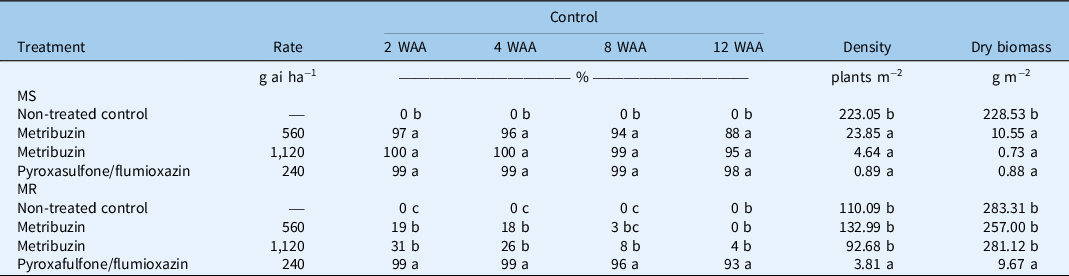
Metribuzin (560 and 1,120 g ha−1) was compared with the current industry standard pyroxasulfone/flumioxazin (240 g ai ha−1) applied preemergence on both the MS and MR A. tuberculatus (Table 5). Metribuzin and pyroxasulfone/flumioxazin controlled MS A. tuberculatus 97% to 100%, 96% to 100%, 94% to 99%, and 88% to 98% at 2, 4, 8, and 12 WAA; there was no difference in control among the three treatments evaluated (Table 5). All treatments reduced MS A. tuberculatus density and biomass similarly at 89% to 100%.
Metribuzin-sensitive (MS) and metribuzin-resistant (MR) Amaranthus tuberculatus control and density and dry biomass reduction at 8 wk after application (WAA) for herbicides applied preemergence from 10 field experiments conducted in Ontario, Canada in 2019 and 2020. a

a Means followed by the same letter within a column under the same heading are not statistically different at α = 0.05 according to Tukey-Kramer’s multiple-range test.
Metribuzin (560 and 1,120 g ha−1) preemergence controlled MR A. tuberculatus 19% to 31%, 18% to 26%, 3% to 8% and 0% to 4% at 2, 4, 8, and 12 WAA, respectively; there was no difference in control among the two rates of metribuzin (Table 5). In addition, metribuzin preemergence did not reduce MR A. tuberculatus density and biomass. In contrast, pyroxasulfone/flumioxazin controlled MR A. tuberculatus 93% to 99% at 2, 4, 8, and 12 WAA and reduced MR A. tuberculatus density and biomass 97%. Schryver et al. (Reference Schryver, Soltani, Hooker, Robinson, Tranel and Sikkema2017a) and Hedges et al. (Reference Hedges, Soltani, Robinson, Hooker and Sikkema2018) reported that pyroxasulfone/flumioxazin (240 g ai ha−1) controlled A. tuberculatus 97% at 12 WAA.
Metribuzin Postemergence Compared with Fomesafen
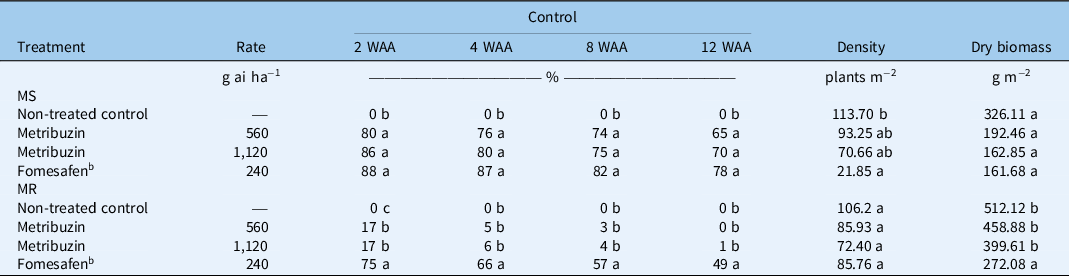
Similar to the BED of metribuzin for both MS and MR A. tuberculatus, control was reduced when metribuzin was applied postemergence compared with preemergence. Metribuzin (560 and 1,120 g ha−1) was compared with the current industry standard fomesafen (240 g ai ha−1) applied postemergence on both the MS and MR A. tuberculatus (Table 6). Metribuzin and fomesafen controlled MS A. tuberculatus 80% to 88%, 76% to 87%, 74% to 82%, and 65% to 78% at 2, 4, 8, and 12 WAA; there was no difference in control among the three treatments evaluated. All treatments reduced MS A. tuberculatus density and biomass similarly at 18% to 81% and 41% to 50%, respectively.
Metribuzin-sensitive (MS) and metribuzin-resistant (MR) Amaranthus tuberculatus control and density and dry biomass reduction at 8 wk after application (WAA) for herbicides applied postemergence from 10 field experiments conducted in Ontario, Canada in 2019 and 2020. a

a Means followed by the same letter within a column under the same heading are not statistically different at α = 0.05 according to Tukey-Kramer’s multiple-range test.
b Included Turbocharge® at 0.5% v/v.
Metribuzin (560 and 1,120 g ha−1) postemergence controlled MR A. tuberculatus 17%, 5% to 6%, 3% to 4%, and 0% to 1% at 2, 4, 8, and 12 WAA, respectively; there was no difference in control among the two rates of metribuzin (Table 6). In addition, metribuzin postemergence did not reduce MR A. tuberculatus density and biomass. Fomesafen controlled MR A. tuberculatus 75%, 55%, 57%, and 49% at 2, 4, 8, and 12 WAA, respectively, and reduced MR biomass 47% but there was no decrease in density.
The lower control of MR compared with MS A. tuberculatus with fomesafen may be due to greater late-season emergence of A. tuberculatus at the MR sites (Table 1). Before significant PPO–inhibitor resistant A. tuberculatus occurred in Illinois, Patzoldt et al. (Reference Patzoldt, Tranel and Hager2002) found that fomesafen (330 g ai ha−1) controlled all 59 A. tuberculatus populations tested in a greenhouse survey. Fomesafen (395 g ai ha−1) controlled 10- to 15-cm tall A. tuberculatus 89% at 2 WAA (Hausman et al. Reference Hausman, Tranel, Riechers and Hager2016). Sweat et al. (Reference Sweat, Horak, Peterson, Lloyd and Boyer1998) reported variable A. tuberculatus control with fomesafen (280 g ha−1) postemergence; it provided 74% to 79% and 86% to 87% control at Richmond and Ashland Bottoms, KS. Vyn et al (Reference Vyn, Swanton, Weaver and Sikkema2007) reported that fomesafen (240 g ai ha−1) controlled A. tuberculatus at Petrolia, ON, in 2004 100% at 4 and 10 WAA and reduced A. tuberculatus density and biomass similar to the weed-free control; in contrast, in 2005, fomesafen controlled A. tuberculatus 66% and 60% at 4 and 10 WAA, respectively. The reduced A. tuberculatus control with fomesafen at Petrolia, ON, in 2005 was attributed to prolonged A. tuberculatus emergence. At Cottam, ON, the same rate of fomesafen controlled A. tuberculatus 98% at 4 and 10 WAA. Field studies conducted by Hager et al. (Reference Hager, Wax, Bollero and Stoller2003) documented that fomesafen at 87, 175, and 350 g ai ha−1 controlled 5-cm-tall A. tuberculatus 63%, 74%, and 85% and controlled 10-cm-tall A. tuberculatus 53%, 61%, and 77%, respectively, at 3 WAA. Fomesafen postemergence provides variable A. tuberculatus control depending on density, weed size, emergence pattern, and weather conditions.
Controlled Environment Experiments
BED of Metribuzin Applied Preemergence for Control of MS and MR Amaranthus tuberculatus
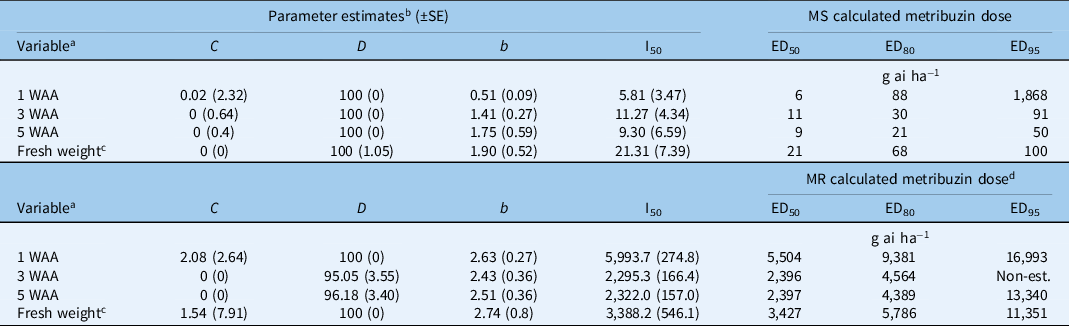
Controlled environment experiments were conducted in 2020; lower metribuzin doses were required for MS and MR A. tuberculatus control when compared with the field studies. The calculated metribuzin doses applied preemergence for 50%, 80%, and 95% MS A. tuberculatus control were 6, 88, and 1,868 g ha−1 at 1 WAA, respectively (Table 7). The higher calculated dose for 95% control was due to the short time frame between application and assessment; A. tuberculatus had germinated but was not yet controlled. The calculated metribuzin doses for 50%, 80%, and 95% MS A. tuberculatus control were 9, 21, and 50 g ha−1 at 5 WAA, respectively. The calculated metribuzin doses applied preemergence for 50%, 80%, and 95% MS A. tuberculatus fresh weight reduction were 21, 68, and 100 g ha−1, respectively. The calculated metribuzin dose applied preemergence for 50%, 80%, and 95% MR A. tuberculatus control at 1, 3, and 5 WAA and MR A. tuberculatus fresh weight reduction was ≥2,396 g ha−1. The metribuzin resistance factor values for the MR A. tuberculatus biotype for 50% control at 1, 3, and 5 WAA and 50% reduction in fresh weight were 917, 218, 266, and 163, respectively.
Parameter estimates and calculated effective doses of metribuzin applied preemergence on control and fresh weight reduction of metribuzin-sensitive (MS) and metribuzin-resistant (MR) Amaranthus tuberculatus biotypes from four controlled environment experiments completed in 2020 in Ontario, Canada.

a Abbreviation: WAA, weeks after application.
b Regression parameters: y = C + (D − C)/(1 + e(−b*(log(dose)−log(I 50 )))) (ascending); y = C + (D − C)/(1 + e(b*(log(dose)−log(I 50 )))) (descending); where C = lower asymptote of percent control or percent relative fresh weight, D = upper asymptote of percent control or percent relative fresh weight, b = slope about I50, I50 = the dose eliciting a response equidistant between C and D, ED n , effective dose to elicit response level n.
c Percent of fresh weight relative to non-treated control plots within replication.
d Non-est., predicted dose for any parameter was outside of the range of doses used in this study or could not be computed by the model.
BED of Metribuzin Applied Postemergence for the Control of MS and MR Amaranthus tuberculatus
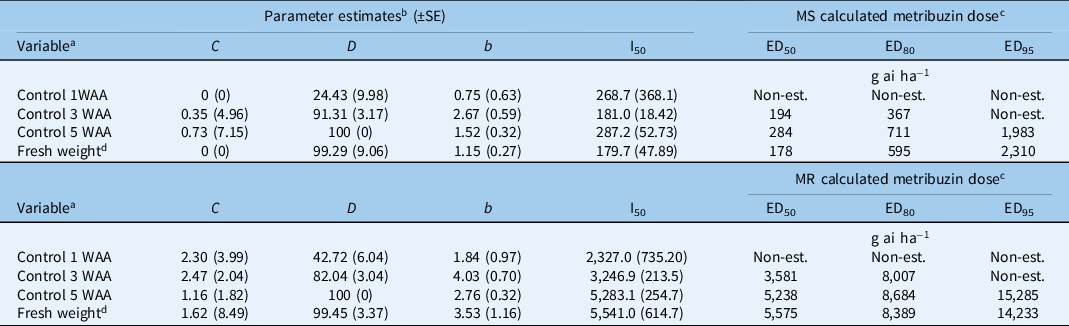
The metribuzin dose applied for MS and MR A. tuberculatus was not calculable at 1 WAA from the doses evaluated in this study (Table 8). The calculated metribuzin postemergence doses for 50%, 80%, and 95% MS A. tuberculatus control were 284, 711, and 1,983 g ha−1, respectively, at 5 WAA. The calculated metribuzin postemergence doses for a 50%, 80%, and 95% MS A. tuberculatus fresh weight reduction were 178, 595, and 2,310 g ha−1, respectively. The calculated metribuzin postemergence doses for 50%, 80%, and 95% MR A. tuberculatus control were 5,238, 8,684, and 15,285 g ha−1, respectively, at 5 WAA. The calculated metribuzin postemergence doses for 50%, 80%, and 95% MR A. tuberculatus fresh weight reduction were 5,575, 8,389 and 14,233 g ha−1, respectively. The metribuzin resistance factor values for the MR A. tuberculatus biotype for 50% control at 3 and 5 WAA and 50% reduction in fresh weight were 18, 18, and 31, respectively.
Parameter estimates and calculated effective doses of metribuzin applied postemergence on control and fresh weight reduction of metribuzin-sensitive (MS) and metribuzin-resistant (MR) Amaranthus tuberculatus biotypes from four controlled environment experiments completed in 2020 in Ontario, Canada.

a Abbreviation: WAA, weeks after application.
b Regression parameters: y = C + (D − C)/(1 + e(−b*(log(dose)−log(I 50 )))) (ascending); y = C + (D − C)/(1 + e(b*(log(dose)−log(I 50 ))))(descending); where C = lower asymptote of percent control or percent relative fresh weight, D = upper asymptote of percent control or percent relative fresh weight, b = slope about I50, I50 = the dose eliciting a response equidistant between C and D, ED n , effective dose to elicit response level n.
c Non-est., predicted dose for any parameter was outside of the range of doses used in this study or could not be computed by the model.
d Percent of fresh weight relative to non-treated control plots within replication.
MS and MR Amaranthus tuberculatus Control Compared with Industry Standards
Metribuzin Preemergence Compared with Flumioxazin/Pyroxasulfone
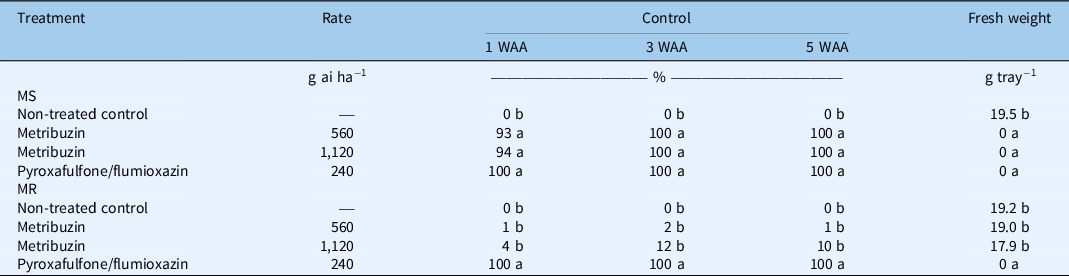
Metribuzin (560 and 1,120 g ha−1) and pyroxasulfone/flumioxazin preemergence controlled MS A. tuberculatus 93% to 100% at 1, 3, and 5 WAA; there was no difference in MS A. tuberculatus control among the three herbicide treatments evaluated (Table 9). Metribuzin (560 and 1,120 g ai ha−1) and pyroxasulfone/flumioxazin all reduced fresh weight by 100%.
Metribuzin-sensitive (MS) and metribuzin-resistant (MS) Amaranthus tuberculatus control at 1, 3, and 5 weeks after application (WAA) and fresh weight at 5 WAA, with herbicide applied preemergence from four controlled environment experiments conducted in Ontario, Canada in 2020. a

a Means followed by the same letter within a column under the same heading are not statistically different at α = 0.05 according to Tukey-Kramer’s multiple-range test.
Metribuzin (560 and 1,120 g ai ha−1) preemergence controlled MR A. tuberculatus 1% to 12% at 1, 3, and 5 WAA and did not reduce MR A. tuberculatus fresh weight; there was no difference in MR A. tuberculatus between the two rates of metribuzin evaluated. In contrast, pyroxasulfone/flumioxazin preemergence controlled MR A. tuberculatus 100% and reduced fresh weight 100%.
Metribuzin Postemergence Compared with Fomesafen
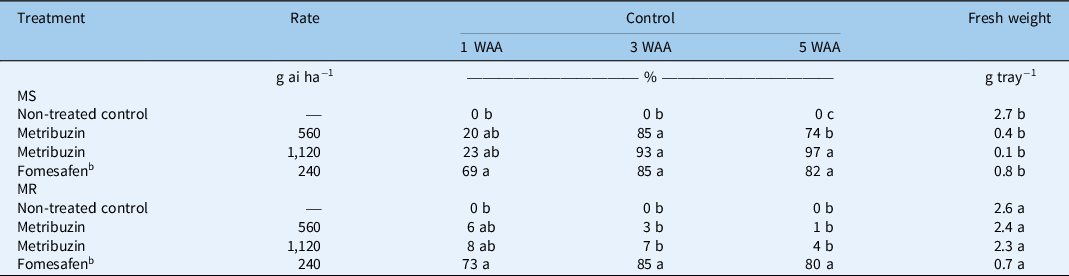
Metribuzin (560 and 1,120 g ai ha−1) and fomesafen postemergence controlled MS A. tuberculatus 20% to 69%, 85% to 93%, and 74% to 97% at 1, 3, and 5 WAA, respectively, and reduced MS A. tuberculatus fresh weight 70% to 96%; there was no difference among the three herbicide treatments evaluated (Table 10). Metribuzin (560 and 1,120 g ai ha−1) controlled MR A. tuberculatus 6% to 8%, 3% to 7%, and 1% to 4% at 1, 3, and 5 WAA, respectively, and did not reduce MR A. tuberculatus fresh weight. In contrast, fomesafen controlled MR A. tuberculatus 73% to 85% at 1, 3, and 5 WAA and did not reduce fresh weight.
Metribuzin-sensitive (MS) and metribuzin-resistant (MR) Amaranthus tuberculatus control at 1, 3, and 5 weeks after application (WAA) and fresh weight at 5 WAA with herbicide applied postemergence from four controlled environment experiments conducted in Ontario, Canada in 2020. a

a Means followed by the same letter within a column, under the same heading, are not statistically different at α = 0.05 according to Tukey-Kramer’s multiple-range test.
b Included Turbocharge® at 0.5% v/v.
This research will allow growers and advisors to make better-informed management decisions, including those based on the mechanism of resistance to PS II-inhibitors in an A. tuberculatus population. Previous research in corn and soybean has found metribuzin to provide effective control of A. tuberculatus (Oliveira et al. Reference Oliveira, Jhala, Gaines, Irmak, Amundsen, Scott and Knezevic2017; Schryver et al. Reference Schryver, Soltani, Hooker, Robinson, Tranel and Sikkema2017a). Metribuzin can used to control A. tuberculatus populations with complex resistance profiles such as populations in Illinois with resistance to five sites of action, including NTSR to PS II inhibitors (Evans et al. Reference Evans, Strom, Riechers, Davis, Tranel and Hager2019).
In conclusion, metribuzin applied preemergence provided better control of MS and MR A. tuberculatus than metribuzin applied postemergence. Based on the field studies, the calculated metribuzin doses applied preemergence for 50%, 80%, and 95% MS A. tuberculatus control were 133, 350, and 1,070 g ai ha−1 of metribuzin, respectively; the calculated metribuzin doses for 50% and 80% MR A. tuberculatus control were 7,868 and 17,533 g ai ha−1, respectively, at 12 WAA. The calculated metribuzin doses applied postemergence for 50% and 80% MS A. tuberculatus control were 245 and 1,480 g ai ha−1, respectively, at 12 WAA. The metribuzin doses applied postemergence in this study did not achieve 50% control of MR A. tuberculatus. Metribuzin (560 g ai ha−1 and 1,120 g ai ha−1) and pyroxasulfone/flumioxazin preemergence controlled MS A. tuberculatus 88%, 95%, and 98%, respectively; the same treatments controlled MR A. tuberculatus 0%, 4%, and 93%, respectively, at 12 WAA. Metribuzin (560 g ai ha−1 and 1,120 g ai ha−1) and fomesafen postemergence controlled MS A. tuberculatus 65%, 70%, and 78%, respectively, while the same treatments controlled MR A. tuberculatus 0%, 1%, and 49%, respectively, at 12 WAA. Results from controlled environment studies followed similar trends. The metribuzin preemergence resistance factor value for the MR A. tuberculatus biotype for 50% control at 2, 4, 8, and 12 WAA and 50% reduction in density was 20–75. The metribuzin postemergence resistance factor value for the MR A. tuberculatus biotype could not be calculated from the rates evaluated in this study. There was a substantial effect of PS II resistance mechanisms on two PS II–inhibitor resistant A. tuberculatus biotypes. The PS II–inhibitor resistant A. tuberculatus with NTSR (enhanced metabolism) was controlled with metribuzin applied preemergence and postemergence, while the PS II–inhibitor resistant A. tuberculatus with TSR (glycine-264-serine altered target site) was not controlled with metribuzin. This study illustrates the need for determining herbicide-resistance mechanisms on a field-by-field basis, as it influences weed management on commercial farms in Ontario.
Acknowledgments
The authors would like to thank Kristen Obeid and Chris Kramer for their assistance with the project, Francois Tardif for his assistance with the Guelph controlled environment experiments, and Michelle Edwards and Christy Shropshire for their help with the statistical analysis. Funding for this project was provided by the Grain Farmers of Ontario and the Ontario Agri-Food Innovation Alliance. No other conflicts of interest have been declared.