Introduction
The phytophagous mites Oligonychus punicae Hirst and Oligonychus perseae Tuttle, Baker and Abbatiello (Acari: Tetranychidae) are severe pests of avocado (Persea americana Mill) in Mexico which is the primary producer of avocados worldwide (FAO, 2012). Both mite species feed on the leaves of avocado trees. However, O. punicae feeds mainly on the adaxial leaf surface and O. perseae on the abaxial leaf surface (Jeppson et al., Reference Jeppson, Keifer and Baker1975; Helle & Sabelis, Reference Helle and Sabelis1985). These mites reproduce rapidly, producing multiple generations in a year; without control measures population densities can reach high levels causing severe defoliation of avocado trees and reduced production (Kerguelen & Hoddle, Reference Kerguelen and Hoddle2000).
The most important region for avocado production in Mexico is Michoacan state, where pest management and agronomical activities are intensive. This is in contrast to avocado production in Mexico state, where production is on a smaller and less intensive scale. Given these differences, it is likely that the selection pressures on mite populations in these two regions will be different. Population genetic structure can be modified by different factors. These include pesticide resistance (Tsagkarakou et al., Reference Tsagkarakou, Navajas, Papaioannou-Souliotis and Pasteur1998; Bailly et al., Reference Bailly, Migeon and Navajas2004; Nishimura et al., Reference Nishimura, Hinomoto and Takafuji2005) and habitat fragmentation (Harrison & Hastings, Reference Harrison and Hastings1996; Hutchinson & Templeton, Reference Hutchinson and Templeton1999; Knutsen et al., Reference Knutsen, Rukke, Jorde and Ims2000) which are related to agronomic practices, but also host specificity (Grbić et al., Reference Grbić, Van Leeuwen, Clark, Rombauts, Rouzé, Grbić, Osborne, Dermauw, Thi Ngoc, Ortego, Hernández-Crespo, Diaz, Martinez, Navajas, Sucena, Magalhães, Nagy, Pace, Djuranović, Smagghe, Iga, Christiaens, Veenstra, Ewer, Mancilla Villalobos, Hutter, Hudson, Velez, Yi, Zeng, Pires-daSilva, Roch, Cazaux, Navarro, Zhurov, Acevedo, Bjelica, Fawcett, Bonnet, Martens, Baele, Wissler, Sanchez-Rodriguez, Tirry, Blais, Demeestere, Henz, Gregory, Mathieu, Verdon, Farinelli, Schmutz, Lindquist, Feyereisen and Van de Peer2011) and the dispersal capabilities of the species concerned (Sun et al., Reference Sun, Lian, Navajas and Hong2012). Designing an effective control strategy for these mites requires an understanding of their population structure, and particularly the factors that influence its dynamics (Carbonnelle et al., Reference Carbonnelle, Hance, Migeon, Baret, Cros-Arteil and Navajas2007). Although these mites are economically important pests that affect avocado production in Mexico (APROAM, 2007), to date, studies determining their population genetic structure are nonexistent. A greater understanding of the factors affecting population genetic structure will facilitate more accurate population estimates and allow us to assess the potential risk of acaricide resistance genes spreading (Yuan et al., Reference Yuan, Wang, Lu, Hu, Wei, Dou and Wang2011; Sun et al., Reference Sun, Lian, Navajas and Hong2012).
Currently, molecular markers have been used to resolve taxonomic relationships, determine phylogenetic relationships between species and quantify genetic variation within the same population of a particular mite species (Navajas & Fenton, Reference Navajas and Fenton2000, Cruickshank, Reference Cruickshank2002); such studies are important when defining appropriate control strategies (David et al., Reference David, Huber, Failloux and Meyran2003; Carbonnelle et al., Reference Carbonnelle, Hance, Migeon, Baret, Cros-Arteil and Navajas2007). In order to obtain information on the genetic population structure of O. perseae and O. punicae, we carried out an extensive survey in avocado orchards in Michoacan and Mexico states. Collected samples were first identified morphologically, the phylogenetic relationship between both species was assessed based on the mitochondrial cytochrome oxidase subunit I (COI) and on the nuclear ribosomal internal transcribed spacer (ITS) and finally, using only ITS data we studied the population genetic structure and genetic variation among populations within each mite species.
Material and methods
Mite sampling
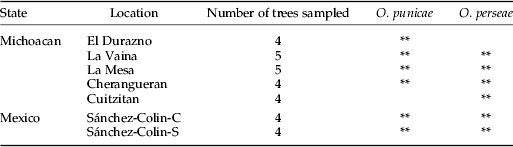
Mites were collected from five orchards of P. americana variety Hass in Michoacan state and two orchards in Mexico state (table 1, fig. 1). Samples were only taken from trees with visible mite damage on leaves; therefore, the final number of trees sampled differed among locations (table 1). From each selected tree, four leaves were sampled from each cardinal point in the canopy (16 leaves per tree), placed inside transparent plastic bags and transported to the laboratory in an icebox.
Map showing the six localities sampled in our study in Michoacan (A) and Mexico (B) states, Mexico. For details about localities see Table 1.

Collection sites in Michoacan and Mexico states, Mexico.
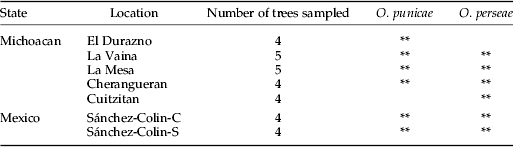
** Represents the presence of either of the mite species in each location.
Mite identification
Adult mites were removed from leaves with the aid of a stereomicroscope. Oligonychus spp. were distinguished from other genera by their morphological attributes (e.g., a claw-like empodium with proximoventral hairs and a tarsus I with distal and adjacent duplex setae) (Bolland et al., Reference Bolland, Gutierrez and Flechtmann1998). Oligonychus perseae and O. punicae adults were separated based on colour and location on the avocado leaf; O. perseae are transparent and found on the abaxial surface of the leaf, whereas O. punicae are red-brown in colour and found on the adaxial surface of the leaf (Jeppson et al., Reference Jeppson, Keifer and Baker1975; Helle & Sabelis, Reference Helle and Sabelis1985). To conclusively confirm the identifications, approximately three male and three female mites (six mites in average) were randomly sampled from each species on each tree and stored in 70% ethanol prior to mounting in Hoyer's medium (Krantz & Walter, Reference Krantz and Walter2009). Species identity was then confirmed using the taxonomic keys of Baker & Tuttle (Reference Baker and Tuttle1994) and Bolland et al. (Reference Bolland, Gutierrez and Flechtmann1998).
Molecular protocols
Preliminary DNA extractions carried out using just one adult lead to unsuccessful or inconsistent polymerase chain reaction (PCR) reactions; therefore, DNA was extracted from mites pooled within each species for each avocado tree (i.e., two pooled samples of mites from each tree, one from each species) and used as a template for PCR. For each sample (tree) DNA was extracted from at least 2 mg of mites (to achieve a minimum of 5 ng of DNA per sample). Mites were first placed in 1.5 ml Eppendorf tubes and maintained at −80 °C prior to DNA extraction. For DNA extraction, mites were crushed with a plastic pestle in the 1.5 ml Eppendorf tube containing 200 μl of extraction buffer (2% CTAB, 1.4 M NaCl, 1% polyvinylpyrrolidone, 20 mM EDTA, 100 mM Tris–HCl) and the DNA extracted as described by Weeks et al. (Reference Weeks, Van Opijnen and Breeuwer2000). The DNA pellet was suspended in TE 1X (Promega®) and maintained at −20 °C until required. DNA concentration was estimated using a NanoDrop (Thermo Fisher Scientific, Inc. Waltham, MA, USA).
PCR and sequencing
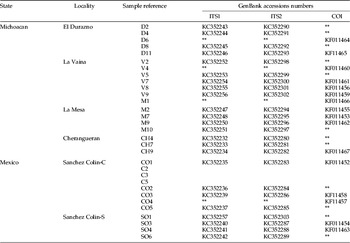
Partial sequences of the COI gene were obtained using the primers LCO1490 and HCO2198 (Hebert et al., Reference Hebert, Cywinska, Ball and De Waard2003). Preliminary analysis showed that successful amplification of COI fragments were only achieved in samples with more than 10 ng of DNA (data not shown), hence samples were selected based on DNA concentration but at the same time trying to have representatives from all samples locations; therefore, 14 and 7 samples of O. punicae and O. perseae, respectively, were selected and analysed (tables 2 and 3). PCR was performed in a 20 ml reaction volume containing 2 μl of buffer 10X (Tris–HCl, KCl, (NH4)2SO4, 15 mM MgCl2; pH 8.7), 0.2 mM of each primer, 0.2 mM of dNTPs, 0.5 U of TaqDNA polymerase (QIAGEN®, GmbH, Hilden, Germany), 1.5 mM of MgCl2 (QIAGEN) and 4 μl (∼40 ng) of DNA. PCR amplifications were performed with a MyCycler™ (BIO-RAD Laboratories Inc., Hercules, CA, USA) using the following thermal conditions: one cycle of 60 s at 94 °C; five cycles of 60 s at 94 °C, 90 s at 45 °C and 90 s at 72 °C, followed by 35 cycles of 60 s at 94 °C, 90 s at 60 °C and 60 s at 72 °C with a final extension at 72 °C for 60 s. PCR products were visualized on 1% agarose gels in 1X TAE. GelPilot® 50 and 100 bp Plus (QIAGEN®, GmbH, Hilden, Germany) size markers were used. The gels were stained with ethidium bromide (0.1 μg ml−1) and photographed.
Sampling sites where O. punicae were collected and GenBank accession numbers for DNA extracted from these samples for ITS1, ITS2 and COI sequencing and phylogenetic analysis.

** Represents no sequence were obtained for this sample.
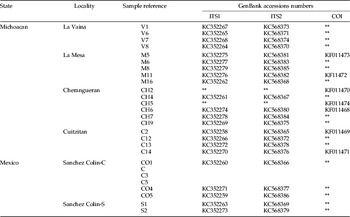
Sampling sites where O. perseae were collected and GenBank accession numbers for DNA extracted from these samples for ITS1, ITS2 and COI sequencing and phylogenetic analysis.

** Represents no sequence were obtained for this sample.
Partial sequences of the ITS regions 1 and 2 (ITS1 and ITS2) from the rDNA gene were amplified and sequenced separately from 24 and 22 samples of O. punicae and O. perseae, respectively (tables 3 and 4). The ITS1 region was amplified using the primers 5′-AGAGGAAGTAAAAGTCGTAACAAG-3′ and 5′-CGTTCTTCATCGATTGGTA-3′ (Hurtado et al., Reference Hurtado, Ansaloni, Cros-Arteil, Jacas and Navajas2008). The ITS2 region was amplified using the primers 5′-GTCACATCTGTCTGAGAGTTGAGA-3′ and 5′-GTARCCTCACCTRMTCTGAGATC-3′ (Ben-David et al., Reference Ben-David, Melamed, Gerson and Morin2007). PCR reactions were as described previously. Thermal conditions for the ITS1 region was one cycle of 94 °C for 4 min, 35 cycles of 60 s at 92 °C, 60 s at 50 °C and 30 s at 72 °C, followed by one extension cycle of 10 min at 72 °C. Thermal conditions for the ITS2 region was one cycle of 4 min at 94 °C; 35 cycles of 30 s at 94 °C, 40 s at 51 °C and 40 s at 72 °C, followed by a final extension cycle of 10 min at 72 °C. PCR products were visualized and photographed as describe previously. All PCR products were purified using a Qiaquick PCR purification kit (Qiagen®, GmbH, Hilden, Germany) following the manufacturer's recommendations and samples were sent to Macrogen Inc. (South Korea) for direct sequencing in both directions (forward and reverse) using the same primers for each fragment as in conventional PCR.
All sequence traces were assembled using BioEdit (Hall, Reference Hall1999). Multiple sequence alignments were carried out using the Clustal W program (Thompson et al., Reference Thompson, Higgins and Gibson1994). After alignment and trimming, the final length of the COI sequences was 518 (14 sequences in total) and 470 (28 sequences in total) bp for O. punicae and O. perseae, respectively. The sequences for ITS1 and ITS2 regions for O. punicae (48 sequences in total) were 539 and 407–410 bp and for O. perseae (44 sequences in total) were 431–437 and 291–293 bp, respectively. GenBank accession numbers for O. punicae and O. perseae are listed in tables 2 and 3, respectively. As sequences from both mite species and all sampling localities were obtained for ITS1 and ITS2 regions, these were used for further analysis. Data from ITS1 and ITS2 were combined and analysed together. Genetic differences among haplotypes were first detected in a maximum parsimony (MP) network (Templeton et al., Reference Templeton, Crandall and Sing1992) using TCS v. 1.21 (Clement et al., Reference Clement, Posada and Crandall2000).
Data analysis
Phylogenetic relationships between both co-occurring Oligonychus species based on COI and ITS sequences were assessed using MP, maximum likelihood (ML), both with the nearest neighbour interchange algorithm, and neighbour-joining (NJ) using the p-distance method. All analyses were done in the Molecular Evolutionary Genetic Analysis (MEGA) software ver. 5.0 for Windows (Tamura et al., Reference Tamura, Paterson, Peterson, Stecher, Nei and Kumar2011). The robustness of branches was estimated by bootstrap analysis with 1000 repeated samples from the data (Felsenstein, Reference Felsenstein1985). In addition, one sequence for each of the species Oligonychus coffeae (Nietner), Oligonychus clavatus (Ehara), Oligonychus rubicundus (Ehara) and Oligonychus biharensis (Hirst) were retrieved from GenBank and used as outgroups. The three statistical analyses carried out showed a similar tree topology for both markers (COI and ITS); therefore, we are presenting the tree obtained after MP analysis only but including the bootstrap values produced by the three analysis.
Because a full set of sequences for both mite species and all sampling localities were obtained for the ITS region, this marker was used for further analyses. Calculations of Kimura (Reference Kimura1980) 2-parameter (K2P) analyses were made in Arlequin ver. 3.5.1.3 (Excoffier & Lischer, Reference Excoffier and Lischer2010) to assess the genetic distances among populations within each mite species. Genetic differences among haplotypes were detected in a MP network (Templeton et al., Reference Templeton, Crandall and Sing1992) using TCS v. 1.21 (Clement et al., Reference Clement, Posada and Crandall2000). The connection limit among haplotypes was set to the default value of 95%. The partition of genetic variation between groups (Michoacan and Mexico states), among populations within each group and finally among all populations was assessed by analysis of molecular variance (AMOVA), estimated by computing F-statistics using Arlequin v. 3.5 (Excoffier & Lischer, Reference Excoffier and Lischer2010) with 10,000 permutations. In addition, the Mantel test was conducted to assess the correlation between genetic and geographic distances using the Isolation by Distance (IBD) web service (Jensen et al., Reference Jensen, Bohonak and Kelley2005) for each mite species.
Results
Mite species identity in relation to location
Oligonychus punicae and O. perseae were present in all sampled orchards except for ‘El Durazno’ and ‘La Vaina’ where only O. punicae was found, and in ‘Cuitzitan’ where only O. persea was found (table 1, fig. 1).
Phylogenetic analysis
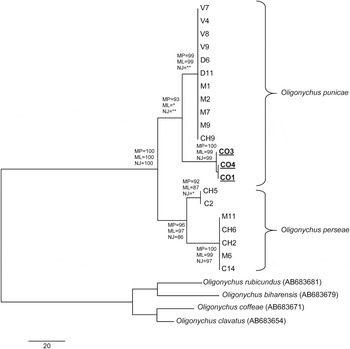
The phylogenetic analysis carried using COI (fig. 2) and ITS (fig. 3) sequences showed a clear separation between both species with a 100% bootstrap value for both markers. For O. punicae, both phylogenetic analyses also showed a clear separation between samples from Michoacan and Mexico states. This grouping was more evident when ITS sequences were analysed as this separation was supported in the three analyses by bootstrap values ranging from 95 to 100% (fig. 2). When the COI sequences of O. punicae were analysed, the separation between Michoacan and Mexico states was significant only with the MP analysis, with a bootstrap value of 93%, but not significant for the other two analyses (ML and NJ) (fig. 3). When the O. perseae sequences were analysed, no clear separation was observed between samples from Michoacan and Mexico states (figs 2 and 3).
Dendrogram inferred from MP, ML and NJ analyses of the COI sequence data of O. punicae and O. perseae. Samples named in bold and underlined were collected in Mexico state. Four sequences representing four Oligonychus species retrieved from GenBank were used as outgroups (accession numbers are in brackets). Only bootstrap values above 80% are shown.

Dendogram inferred from MP, ML and NJ analyses of the combined ITS1 and ITS2 data from O. punicae and O. perseae. Samples named in bold and underlined were collected in Mexico state. Haplotype designations are shown for each mite species, for the O. perseae all samples represent an individual haplotype except those marked in red, which were grouped in one haplotype (see Fig. 5). Four sequences representing four Oligonychus species retrieved from GenBank were used as outgroups (accession numbers are in brackets). Only bootstrap values above 80% are shown.

Genetic variation among O. punicae populations
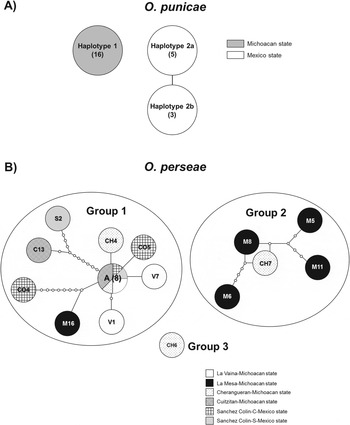
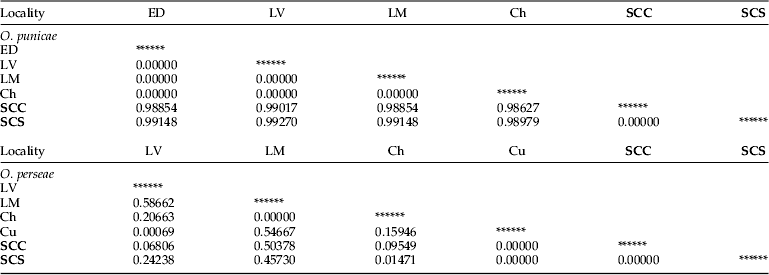
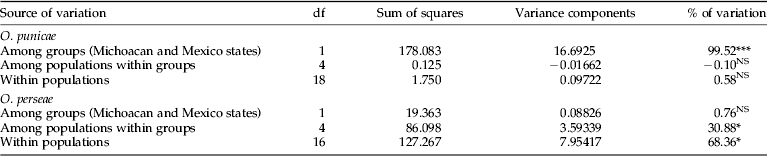
Pairwise distances estimated by the K2P analysis showed a significant separation between populations collected in Michoacan and Mexico states, with more than 90% sequence divergence (table 4). No sequence divergence was found within Michoacan state populations or within Mexico state populations (table 4). Haplotype network analysis revealed the existence of three haplotypes clearly separated into two groups (fig. 4A). Haplotype 1 contained all samples from Michoacan state and Haplotypes 2a and 2b contained samples from Mexico state. Haplotype 1 was the most common representing 66.7% of the samples analysed, followed by Haplotypes 2a and 2b (separated by a single mutational change) with 20.8 and 12.05% of the samples analysed, respectively. AMOVA analysis showed that the greatest amount of total variation (99.52%) could be explained by the separation between Michoacan and Mexico states. All other comparisons, among populations within Michoacan and within Mexico states, and among all populations regardless of geographical origin were not significant (table 5). Mantel tests on pairwise genetic and geographic distances for populations from Michoacan and Mexico states showed a significant IBD pattern (fig. 5A), suggesting that geographic distance between populations explains the genetic variation among the sampled locations (r=−0.3419, P=0.0070).
Most parsimonious haplotype network for (A) O. punicae and (B) O. perseae. Haplotypes are connected with a 95% confidence limit. Each line in the network represents a single mutational change. Small circles indicate missing haplotypes. Numbers of samples per haplotype are shown in parentheses. Colours indicate different populations within each group (Michoacan and Mexico states) where each haplotype was present.

Mantel test graphs showing correlation between genetic variations (based on ITS sequence data) found in mite populations and distance (km) for (A) O. punicae populations and (B) O. perseae populations.

Genetic distances (K2P method) among populations of O. punicae and O. perseae from six different localities in Michoacan and Mexico (presented in bold) states.
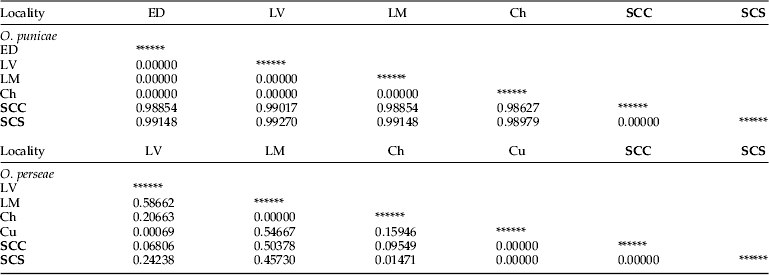
Distances are given for the combined ITS1 and ITS2 sequence data.
LV, La Vaina; LM, La Mesa; Ch, Cherangueran; Cu, Cuitzitan; ED, El Durzano; SCC, Sanchez Colin-C; SCS, Sanchez Colin-S. More information on localities are given in Table 1.
Results of AMOVA analysis of ITS sequences from O. punicae and O. perseae populations.
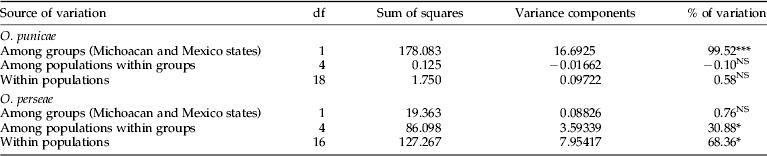
* P<0.05; *** P<0.001; NS, not significant.
Genetic variation among O. perseae populations
Pairwise distances estimated by the K2P analysis did not show a clear separation between Michoacan and Mexico states (table 4), genetic divergence ranged from 0 to 58.6% where the highest observed percentage (58.6%) was obtained between La Vaina and La Mesa (Michoacan), with no genetic divergence (0%) found between Cuitzitan (Michoacan) and the two localities in Mexico state (SCC and SCS) (table 4). No genetic divergence was obtained between the two localities in Mexico state (table 4). Haplotype network analysis revealed the existence of 15 haplotypes that were split into three separate groups (fig. 4B). Group 1 contained nine haplotypes with haplotype A being the most frequent as it was found in 36.36% of all the samples, followed by the other 14 haplotypes, each with one sample. There was no clear separation between populations from Michoacan and Mexico states. This was confirmed by the AMOVA analysis, where the greatest variation was within populations regardless of the geographical origin (68.36%), followed by variation within populations from each state (Michoacan and Mexico states) (30.88%), and finally by the variation between states (0.76%) which was not significant (table 5). Mantel tests on pairwise genetic and geographic distances for populations from Michoacan and Mexico states did not show a significant IBD pattern (fig. 5B), which suggests that geographic distance did not have a significant effect on the genetic variation among sampling localities (r=0.4167, P=0.9540).
Discussion
Oligonychus punicae and/or O. perseae were found in all avocado orchards sampled. Both species produced characteristic damage symptoms on leaves and adults could be accurately identified using colour and location traits (as confirmed by morphological assessment using Hoyer-fixed specimens and taxonomical keys). Additionally, COI and ITS sequence information allowed accurate species separation (figs 2 and 3), which will be very useful in the future as any developmental stage can be used for DNA analysis to obtain accurate identification, unlike the conventional methods where only adults can be identified.
Previous works, including studies on mites, have suggested that geographical separation can be an important factor affecting population structure (Balloux & Lugon-Moullin, Reference Balloux and Lugon-Moulin2002; Carbonnelle et al., Reference Carbonnelle, Hance, Migeon, Baret, Cros-Arteil and Navajas2007). Sampling locations in Michoacan and Mexico states were separated by ∼240 km (fig. 1) which is, potentially, a substantial geographical separation and sufficient to allow populations to evolve independently. Our initial hypothesis was that the genetic population structure of O. perseae and O. punicae would be differentially affected by this geographical separation because dispersal capability would be different in the two species. We predicted that, being on the abaxial surface of the leaves and in compact colonies, would limit O. perseae mites from being readily dispersed by climatic factors such as wind compared with O. punicae which does not form compact colonies and occurs on the adaxial leaf surface, from where it could be readily dispersed by wind (Aponte & McMurtry, Reference Aponte and McMurtry1997). However, our results using ITS sequence analysis (that had been used successfully in other mite species (Yuan et al., Reference Yuan, Wang, Lu, Hu, Wei, Dou and Wang2011)), suggest the contrary, and in fact demonstrated that dispersal was occurring between Michoacan and Mexico states in O. perseae but not in O. punicae. Specifically, O. perseae had genetically diverse populations (15 haplotypes, fig. 4B) with no geographic structuring as demonstrated by the Mantel test (fig. 5B) and the K2P analysis (table 4), compared with O. punicae which was less genetically diverse (fig. 4A), with a clear separation between populations from Michoacan and Mexico states as confirmed by the Mantel test assessing IBD (fig. 5A) and the K2P analysis (table 4), suggesting a limited potential gene flow for this species between these two locations.
We now suggest that the greater dispersal in O. perseae compared with O. punicae, is because O. perseae forms more compact colonies that are composed only of related (sibling) individuals, whereas O. punicae forms more diffuse colonies of related and unrelated individuals that are widely distributed over the adaxial leaf surface; therefore, we would expect selection pressure favouring O. perseae dispersal to be stronger than in O. punicae possibly as a consequence of kin avoidance. Crowding and kin avoidance is known to be a very important driver for dispersal in other species (van Valen, Reference van Valen1971; Hamilton & May, Reference Hamilton and May1977) including the mite Tetranychus urticae (Koch) (Bitume et al., Reference Bitume, Bonte, Ronce, Bach, Flaven, Olivieri and Nieberding2013), a species closely related to O. perseae. While more studies, including more extensive sampling in avocado growing areas, are necessary to confirm our hypothesis, these data will ultimately increase understanding of the factors affecting dispersal and gene flow, and inform the design of better control strategies for these mite species.
Interestingly, the commercial relationship between Michoacan and Mexico states is minimal, as both states have different markets minimizing the opportunity for human-assisted transportation of mites between states. The majority of avocado production in Michoacan is for export and the small-scale production of avocado in Mexico state is for the local market. The fact that O. perseae is still able to disperse between states, while O. punicae from each state remain spatially and genetically isolated highlights the importance of understanding the biological and genetic characteristics not only of each species, but also each population within a species, when developing specific sampling methodologies or control strategies. The speed of development, severity of damage, likelihood of acaricide resistance development and spread could all differ greatly between species but crucially between populations of the same species if they are genetically isolated in different states (Gotoh et al., Reference Gotoh, Bruin, Sabelis and Menken1993; Tsagkarakou et al., Reference Tsagkarakou, Navajas, Rousset and Pasteur1999; Navajas et al., Reference Navajas, Perrot-Minnot, Lagnel, Migeon, Bourse and Cornuet2002; Bailly et al., Reference Bailly, Migeon and Navajas2004).
Although the genetic separation between populations from Michoacan and Mexico states was very clear in O. punicae, it was also evident that there was a lack of genetic variation within each population (figs 2–4A). We believe that this lack of variation may be a result of inbreeding which is common in mites from the Tetranychidae (Helle & Overmeer, Reference Helle and Overmeer1973; Hinomoto & Takafuji, Reference Hinomoto and Takafuji1994; Navajas et al., Reference Navajas, Perrot-Minnot, Lagnel, Migeon, Bourse and Cornuet2002). The closely related mite species, T. urticae, is able to recognize kin from nonkin and, where the mites are more closely related, the sex ratio becomes female biased (Roeder et al., Reference Roeder, Harmsen and Mouldey1996), leading to a greater potential for parthenogenetic reproduction. Lower levels of genetic variation could also be related to the population size and number of individuals analysed (Ruiz et al., Reference Ruiz, Rinehart, Hayes and Zuniga2009). To fully understand what is happening in O. punicae further sampling of more populations and collecting more mites per population is required to determine whether it is possible to detect greater genetic variation or not.
In conclusion, although both species coexist in the same system (avocado), they have evolved differently which indicates the need to design specific monitoring and control strategies for each species, and different populations within a species, in order to achieve more sustainable avocado production in Mexico. O. punicae showed geographically structured populations in Michoacan and Mexico states, while there was no genetic structure found in O. perseae populations. This suggests that there is the potential for greater gene spread in the latter species, and this has implications for the more rapid spread of genes of economic importance such as those for acaricide-resistance, and should be considered in any monitoring and control programme.
Acknowledgements
SGV received a scholarship from CONACYT-Mexico. This research was funded by the Asociación de Productores y Exportadores de Aguacate de Michoacan – APEAM under the project ‘Sistema de alerta fitosanitaria para trips, escamas armadas y ácaros del aguacate Hass en Michoacán’. We are grateful with Dr Antonio Hernandez-Lopez for his valuable help for the genetic analysis of the data. We want to thank two anonymous reviewers for their valuable comments to improve an earlier version of this manuscript.