I. INTRODUCTION
Metal matrix composites (MMCs) have received considerable attention because of the improvement in various mechanical properties over conventional monolithic alloys, particularly in stiffness, strength, and wear resistance. Reference Girot, Majidi and Chou1,Reference Tjong and Ma2 Particle reinforced MMCs have made rapid progress in the past decades as they offer more isotropic properties and are less expensive to process. Reference Tjong and Ma2,Reference Ranganath3 However, during the process of manufacturing and subsequent heat treatments, the tensile stresses form and deteriorate the fatigue properties of materials. Reference Fitzpatrick, Withers, Baczmanski, Hutchings, Levy, Ceretti and Lodini4 To improve their fatigue strength and fatigue life, crack initiation and growth at surface layers must be suppressed using surface treatments. Reference Wagner5 As an effective and important method of surface treatment, shot peening (SP) can introduce high compressive residual stress (CRS) and microstructure variation in near surface layers, which can improve fatigue properties compared to un-peened materials.
Titanium and its alloys have been used in many fields due to their various properties. Reference Haghighi, Lu, Jian, Cao, Habibi and Zhang6,Reference Calin, Zhang and Eckert7 Similarly, as one kind of important MMCs, titanium matrix composites (TMCs) have wide application prospects in the fields of aerospace, automobile, biomedical engineering, and other industries because of their favorable properties such as high specific strength, good ductility, and excellent fatigue properties. Reference Tjong and Ma2,Reference Ranganath3,Reference Zhang and Attar8 The fabrication of TMCs using in situ technology is simple and can keep the interfaces between the matrix and reinforcements free of impurities. Reference Lu, Zhang, Zhang, Sakata and Mori9–Reference Man, Zhang, Cheng and Yue11 The selection of a compatible reinforcement is also a very important factor for developing particle reinforced TMCs. Various reinforcements are used in TMCs including TiB, TiC, TiB2, SiC, and Al2O3. Among these reinforcements, TiB and TiC are potentially very useful reinforcements because of their thermal stability and relative chemical stability in TMCs. Reference Tjong and Ma2,Reference Ranganath3 Moreover, there are only slight differences of the thermal expansion coefficient between the matrix and the reinforcements TiB and TiC. Therefore the studies on TMCs reinforced by TiB and TiC become more and more significant and promising. Reference Lu, Zhang, Zhang, Wu, Sakata and Mori12–Reference Lu, Qin, Chen, Zhang, Lu and Zhang16 In recent years, the TMC of (TiB + TiC)/Ti–6Al–4V has been investigated, but the research has mostly focused on the mechanical properties, Reference Lu, Qin, Lu, Chen, Zhang and Hou14–Reference Lu, Qin, Chen, Zhang, Lu and Zhang16 few investigations have been done on the surface microstructure using Rietveld whole pattern fitting method, especially after SP treatments. Therefore, the surface properties of shot peened (TiB + TiC)/Ti–6Al–4V are studied in this work based on the theory of Rietveld whole pattern fitting method, meanwhile, a useful quantification methodology of investigation on the surface properties of shot peened materials can be provided.
SP is widely utilized to improve the fatigue resistance and damage tolerance of components. Reference Almer, Cohen and Moran17–Reference Xie, Jiang, Lu, Chen and Huang21 During the SP process, a great amount of small shot balls with high kinetic energy impact the surface of materials, which causes the elastic and plastic deformation in the surface layer. Usually, the deformation results in variations of microstructure on the surface layer, which is very crucial to the stability of materials. Rietveld whole pattern fitting method is a very useful method to analyze the information of x-ray diffraction (XRD) patterns. Reference Young22–Reference Ghosh and Pradhan26 It is based on simultaneous structure and microstructure refinement, and can be adopted for routine analysis of microstructural parameters such as domain size, microstrain, etc. Moreover, this method is suitable for materials containing a large number of overlapping reflections. Rietveld method was proposed some years ago, Reference Young22–Reference Ghosh and Pradhan26 but it has seldom been applied to investigate the influences of SP on the surface properties of TMCs. Therefore, according to the theory of Rietveld whole pattern fitting method, the software Materials Analysis Using Diffraction (MAUD) Reference Lutterotti27 is utilized to study the surface microstructure of shot peened (TiB + TiC)/Ti–6Al–4V in this work, and the related results are analyzed and discussed in detail.
II. EXPERIMENTS AND METHODS
A. Materials preparation and experimental procedure
The samples of Ti–6Al–4V and 5% (TiB + TiC)/Ti–6Al–4V [TiB:TiC = 1:1 (vol%)] were fabricated via in situ technology, and the reinforcement particles were obtained using the self-propagation high-temperature reactions. Reference Ranganath, Vijayakumar and Subrahmanyam28,Reference Zhang, Lu, Zhang, Wu, Bian and Fang29 The diameter of the sample was 15 mm and the thickness was 3 mm. An air blast machine (Carthing Machinery Company, Shanghai) was utilized for SP treatments. The first and second SP treatments were performed using cast steel balls (610 HV) and Al2O3 ceramic balls (700 HV), respectively. As shot media, the average diameters of the cast steel balls and the Al2O3 ceramic balls were 0.6 and 0.3 mm, respectively. The diameter of peening nozzle was 15 mm, and the standard distance between the nozzle and the sample was 100 mm. The surface coverage of SP was 100% in each step. The surface coverage was very important in the process of SP, the invariable jet pressure and SP time were set to control the surface coverage. The velocity of the movement of nozzle was slow and equable. Additionally, computer numerical control was introduced in the process of SP, which played a very significant role in controlling the surface coverage. SP intensities were set at 0.15 + 0.15, 0.3 + 0.15, and 0.45 + 0.15 mmA (the first SP + the second SP). The intensity of SP was measured by the arc height of Almen specimen (A type), which was controlled by the jet pressure of nozzle, SP time and the average diameter of shot balls.
XRD patterns of all samples were measured on Rigaku Ultima IV x-ray diffractometer (Rigaku Corporation, Tokyo, Japan) with Cu Kα radiation (λ = 1.54056 Å) under 40 kV/40 mA. The test system was set up with Bragg–Brentano optics. The parameters of Div H. L. Slit, Div Slit, Sct Slit, and Receiving Slit were fixed as 10 mm, 1°, 1° and 0.15 mm, respectively. The velocity of the scan was 3°/min and the step was 0.01°. To obtain the depth distribution of microstructure, the thin surface layers were removed one by one via chemical etching with a solution of distilled water, nitric acid, and hydrofluoric acid in the proportion of 31:12:7. The estimated x-ray penetration depth for each measurement was about 5–10 μm for titanium alloys. The chemical etching rate can be determined from the etching time and the concentration of mixed solution. According to our experiments, the chemical etching rate of Ti–6Al–4V was about 10–13 μm/min. The values of depth were measured by the micrometer, and the minimum interval depth between two layers was 25 μm, which was larger than the x-ray penetration depth. So the thin surface layers removed by chemical etching were thick enough compared with the x-ray penetration depth to prevent any overlapping XRD data. The microstructure of materials were observed using a scanning electron microscope (SEM, Hitachi S-3400N, Japan) with the voltage at 15 kV, and the current at 70 μA. Before SEM observation, the samples were polished first by the abrasive papers, and then by the diamond papers and the aluminum oxide suspensions successively. To acquire clear distributions of reinforcements, the surface of samples were etched using Kroll's solution [HF:HNO3:H2O = 3:5:100 (vol)] for 2–6 s after polishing. The surface roughness of samples before and after SP was tested by MicroXAM surface mapping microscope (ADE Phase Shift, Tucson, Arizona). All experiments were implemented at room temperature.
B. Rietveld whole pattern fitting method
MAUD was adopted to accurately fit the whole XRD pattern for microstructural characterization. All variable parameters were refined by adopting an iterative least squares procedure through minimization of the residual parameter. Reference Young22 Instrumental parameters of a Si standard sample, assumed to have no size and strain broadening, have been used as fitting parameters in the software following the procedure indicated by Lutterotti et al. Reference Lutterotti, Scardi and Maitrelli24 After SP treatments, the texture of material was weak, so it was refined at the end to avoid refining texture instead of other parameters that could impose intensity variations. And the simplified texture model with Gaussian and Lorentzian mixed spherical components was implemented in MAUD. The advantage of this approach was that some texture-like functions could be utilized with only a few parameters. The domain size and microstrain were calculated using the Popa model. Reference Popa25
During the process of refinement, the profiles used to estimate the agreement between the observations and the model are shown as below. Reference Hill and Madsen30,Reference Young and Wiles31
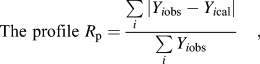 $${\rm{The\ profile\ }}{R_{\rm{p}}} = {{\sum\limits_i {\left| {\left. {{Y_{i{\rm{obs}}}} - {Y_{i{\rm{cal}}}}} \right|} \right.} } \over {\sum\limits_i {{Y_{i{\rm{obs}}}}} }}\quad ,$$
 $${\rm{The\ weighted\ profile\ }}{R_{{\rm{wp}}}} = {\left[ {{{\sum {{W_i}} {{\left( {{Y_{i{\rm{obs}}}} - {Y_{i{\rm{cal}}}}} \right)}^2}} \over {\sum {{W_i}Y_{i{\rm{obs}}}^2} }}} \right]^{{1 \mathord{\left/ {\vphantom {1 2}} \right. \kern-\nulldelimiterspace} 2}}}\quad ,$$
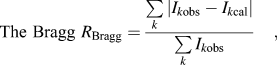 $${\rm{The\ Bragg\ }}{R_{{\rm{Bragg}}}} = {{\sum\limits_k {\left| {{I_{k{\rm{obs}}}} - {I_{k{\rm{cal}}}}} \right|} } \over {\sum\limits_k {{I_{k{\rm{obs}}}}} }}\quad ,$$
 $${\rm{The\ expected\ }}{R_{{\rm{exp}}}} = {\left[ {{{\left( {N - P} \right)} \over {\sum {{W_i}Y_{i{\rm{obs}}}^2} }}} \right]^{{1 \mathord{\left/ {\vphantom {1 2}} \right. \kern-\nulldelimiterspace} 2}}}\quad ,$$
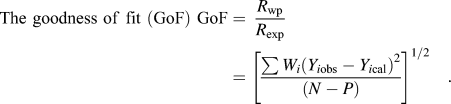 $${\rm{The\ goodness\ of\ fit\ (GoF)\ GoF}} = \;{{{R_{{\rm{wp}}}}} \over {{R_{\exp }}}} = {\left[ {{{\sum {{W_i}} {{\left( {{Y_{i{\rm{obs}}}} - {Y_{i{\rm{cal}}}}} \right)}^2}} \over {\left( {N - P} \right)}}} \right]^{{1 \mathord{\left/ {\vphantom {1 2}} \right. \kern-\nulldelimiterspace} 2}}}\quad .$$
Y ical is the net intensity calculated at point i in the pattern; Y iobs is the step intensity from the observation; W i is the weight assigned to each step intensity; and the values of I kobs are obtained by partitioning the raw data in accordance with the I kcal values of the component peaks. N is the number of steps and P is the number of least-squares parameters estimated. Commonly, the weighted profile index R wp and the goodness-of-fit index (GoF) are the most meaningful in relation to the progress of the refinement since they incorporate in their numerators the quantity being minimized in the least-squares procedure. Nevertheless, R Bragg is of considerable use since it depends more heavily on the fit of the crystal structure parameters. In this study, R wp was chosen as the indication of fitting agreement.
III. RESULTS AND DISCUSSION
A. Microstructure and surface roughness
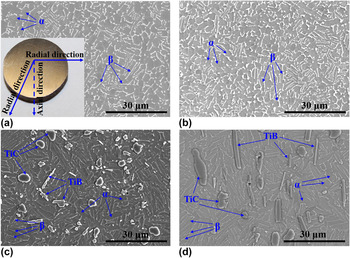
The microstructure of the matrix Ti–6Al–4V and the composite 5% (TiB + TiC)/Ti–Al–4V observed along the axial and radial directions are shown in Fig. 1, and the insert in Fig. 1(a) shows the photo of a specimen and the schematic directions of observation. From these two directions, the observed results reveal that the matrix is homogeneous with α and β phases [Figs. 1(a) and 1(b)], and the reinforcements are distributed uniformly [Figs. 1(c) and 1(d)]. The TiB reinforcements look like needles, whiskers, and short fibers, while the TiC reinforcements are the near equiaxed particles based on the observation from these two perpendicular directions. The differences in shapes are due to their solidification paths and crystal structures. Reference Lu, Zhang, Zhang, Bian, Wu, Sakata and Mori32 In Fig. 1(d), the reinforcements observed along the radial direction reveal TiB whiskers largely aligned along the axial orientation, which is the hot-forging direction. The TiC particles have no apparent orientation preference because their shapes are nearly equiaxed.
SEM images of the etched specimens observed along the radial and axial directions. Along the axial direction: (a) Ti–6Al–4V; (c) 5% (TiB + TiC)/Ti–Al–4V. Along the radial direction: (b) Ti–6Al–4V; (d) 5% (TiB + TiC)/Ti–Al–4V. The insert in (a) shows the photo of a specimen and the schematic directions of observation.

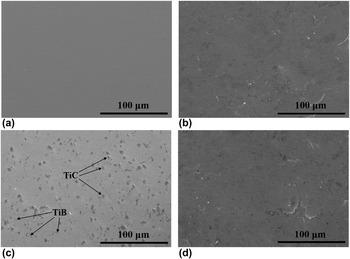
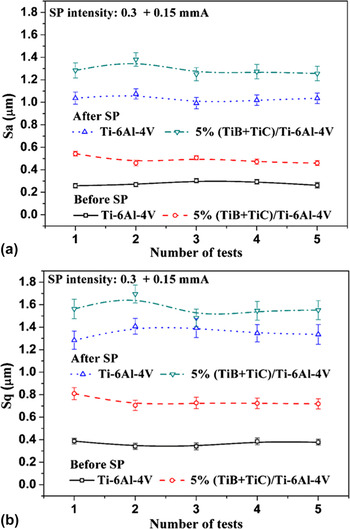
Figure 2 shows the SEM images of the un-etched surfaces before and after SP. The surface of the matrix is very smooth before SP [Fig. 2(a)] and the distribution of reinforcements can be seen in the surface of the composite [Fig. 2(c)]. After SP, the variation of surface is obvious [Figs. 2(b) and 2(d)]. The surface appears pitted and the distribution of reinforcements can't be observed because of the increased surface roughness. To investigate the variation of surface roughness, the accurate parameters of surface roughness S a and S q have been obtained and shown in Fig. 3.
SEM images of the un-etched surfaces before and after SP. Before SP: (a) Ti–6Al–4V; (c) 5% (TiB + TiC)/Ti–6Al–4V. After SP (SP intensity: 0.3 + 0.15 mmA): (b) Ti–6Al–4V; (d) 5% (TiB + TiC)/Ti–6Al–4V. The reinforcements TiB and TiC are labeled in (c).

Variation of surface roughness before and after SP (a) S a; (b) S q.

The parameters of average roughness S a and root mean square roughness S q are defined as Eqs. (6) and (7), 33 which can show the information about the statistical average properties of surface.
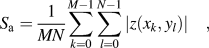 $${S_{\rm{a}}} = {1 \over {MN}}\sum\limits_{k = 0}^{M - 1} {\sum\limits_{l = 0}^{N - 1} {\left| {z({x_k},{y_l})} \right|} } \quad ,$$
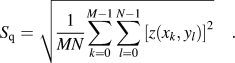 $${S_{\rm{q}}} = \sqrt {{1 \over {MN}}\sum\limits_{k = 0}^{M - 1} {\sum\limits_{l = 0}^{N - 1} {{{\left[ {z\left( {{x_k},{y_l}} \right)} \right]}^2}} } } \quad .$$
M and N represent the number of contour points in x and y directions respectively, z(x k , y l ) is the contour height of each point. Five measurements of each sample are implemented to reduce the error. From Fig. 3, it can be found that the trends of variation of roughness are similar between (a) and (b). The surface roughness increases clearly after SP. The roughness of the composite is more severe than the matrix's both before and after SP, due to the existence of reinforcements. Under the same SP, the existence of reinforcements can relieve the impact of shot balls, so more severe concavities are produced on the locations without reinforcements. Both the reinforcements and SP can increase the surface roughness, but the effects of SP are enormously more.
B. Fitted results of surface XRD patterns
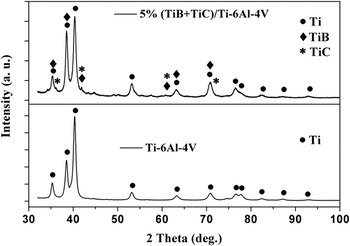
Figure 4 shows XRD patterns of the surface of matrix Ti–6Al–4V and the composite 5% (TiB + TiC)/Ti–6Al–4V after SP, and the SP intensity is 0.3 + 0.15 mmA. It can be observed that the diffraction peaks of Ti, TiB, and TiC are shown clearly. The peaks of materials show that there is no other new phase after SP treatment. In Fig. 4, the phases in Ti–6Al–4V contain both α-Ti and β-Ti, and the microstructure of these two phases have been presented in Fig. 1. After XRD characterization, most peaks are ascribed to α-Ti because of the absolutely higher quantity, moreover, some peaks of α-Ti and β-Ti are overlapped, which is difficult to distinguish using just the normal XRD method. So there is no distinction of phases of Ti in Fig. 4. In addition, about the crystallographic structure, α-Ti is hcp (hexagonal close-packed) with the space group of P63/mmc, but that of β-Ti is bcc (body-centred cubic) with the space group of
 $Im\bar 3m$
. It is indicated that fewer reflections can be found due to the high-symmetry structure of β-Ti compared to that of α-Ti. The XRD patterns in Fig. 4 are the tested patterns, the fitted results are presented and discussed as follow.
Measured XRD patterns of Ti–6Al–4V and 5% (TiB + TiC)/Ti–6Al–4V after SP (SP intensity: 0.3 + 0.15 mmA).

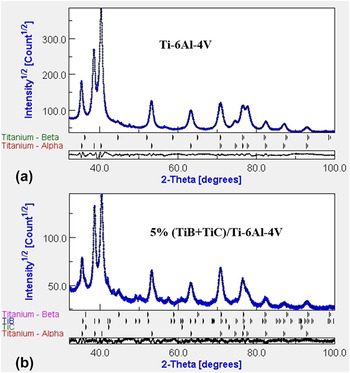
Figure 5(a) shows the Rietveld whole pattern fitted pattern of Ti–6Al–4V on the surface. Because Ti–6Al–4V contains two phases α and β, during the process of fitting, the structures of two phases should be involved. It can be found that the fitted XRD of Ti–6Al–4V is nearly the same as the measured XRD, and the weighted profile R wp = 5.44%. The Rietveld whole pattern fitted pattern of 5% (TiB + TiC)/Ti–6Al–4V is displayed in Fig. 5(b), and the SP intensity is 0.3 + 0.15 mmA. In the composite, not only are the Ti phases α and β present, but there also exist two types of reinforcements TiB and TiC. The crystal structures of TiB and TiC are B27 and fcc (face-centred cubic), respectively. So the crystal structures of these four phases should be involved during fitting. The fitted result of composite is great and the weighted profile R wp = 6.26%. According to above discussion, the fitted results of Ti–6Al–4V and the composite are reasonable.
Fitted XRD patterns on the surface (SP intensity: 0.3 + 0.15 mmA). (a) Ti–6Al–4V; (b) 5% (TiB + TiC)/Ti–Al–4V.

C. Fitted results of domain size and microstrain
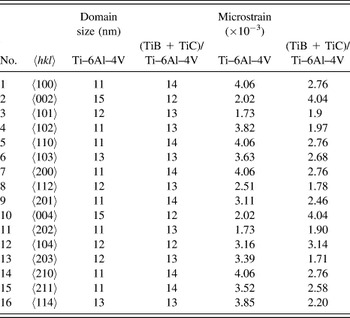
Using Rietveld whole pattern fitting, the domain size and microstrain of α-Ti phase on the surface have been obtained, meanwhile, the PoPa model Reference Popa25 is considered during the above fitting process. Because the α-Ti phase is the main phase in both materials and as such has a large impact on the deformation of the materials, the microstructure of α-Ti phase is discussed in this work. Direction-dependent domain size and microstrain of α-Ti have been obtained from the broadening of the diffracted peaks, Reference Popa25 which are shown in Table I. The models, derived from general crystallographic considerations, are different for different Laue groups. In the normalized peak profile,
 $${V_{\rm{H}}}\left( z \right) = \int \!\!{{\rm{d}}\left( {\Delta z'} \right){G_{\rm{H}}}\left( {\Delta z'} \right){L_{\rm{H}}}\left( {z + \Delta z'} \right)}$$
the Gaussian component G H represents the strain effect, and the Lorentzian component L H represents the size effect. In terms of the integral breadths βGH, βLH, these functions are
 $${G_{\rm{H}}}\left( z \right) = \beta _{{\rm{GH}}}^{ - 1}\exp \left( {{{ - \pi {z^2}} \mathord{\left/ {\vphantom {{ - \pi {z^2}} {\beta _{{\rm{GH}}}^2}}} \right. \kern-\nulldelimiterspace} {\beta _{{\rm{GH}}}^2}}} \right)\quad ,$$
 $${L_{\rm{H}}}\left( z \right) = \beta _{{\rm{LH}}}^{ - 1}{\left( {{{1 + {\pi ^2}{z^2}} \mathord{\left/ {\vphantom {{1 + {\pi ^2}{z^2}} {\beta _{{\rm{LH}}}^2}}} \right. \kern-\nulldelimiterspace} {\beta _{{\rm{LH}}}^2}}} \right)^{ - 1}}\quad .$$
Direction-dependent domain size and microstrain of α-Ti on the surface after SP.

For the constant-wavelength diffraction method, z = 2θ and the quantities βGH, βLH are shown as follows.
 $${\beta _{{\rm{GH}}}} = 2\tan {\theta _{\rm{H}}}{\left( {2\pi \left\langle {\varepsilon _{hkl}^2} \right\rangle } \right)^{{1 \mathord{\left/ {\vphantom {1 2}} \right. \kern-\nulldelimiterspace} 2}}}\quad .$$
 $${\beta _{{\rm{LH}}}} = {{2\lambda } \mathord{\left/ {\vphantom {{2\lambda } {\left( {3\left\langle {{R_h}} \right\rangle \cos \,{\theta _{\rm{H}}}} \right)}}} \right. \kern-\nulldelimiterspace} {\left( {3\left\langle {{R_h}} \right\rangle \cos {\theta _{\rm{H}}}} \right)}}\quad .$$
The quantity 〈R
h
〉 is the radius of the average composite crystallite. The (h, k, l)-dependent strain models and the direction-dependent size models for all Laue groups can be found in Popa's work.
Reference Popa25
The crystallographic structure of α-Ti is hcp with the space group of P63/mmc. Therefore, 〈R
h
〉 and
 $\left\langle {\varepsilon _{hkl}^2} \right\rangle$
can be obtained and shown as below according to the Ref. Reference Popa25.
 $$\left\langle {\varepsilon _{hkl}^2} \right\rangle E_{\rm{H}}^4 = {E_1}{\left( {{h^2} + {k^2} + hk} \right)^2} + 2{E_2}{l^2}\left( {{h^2} + {k^2} + hk} \right) + 2{E_3}{l^4}\quad .$$
 $$\left\langle {{R_h}} \right\rangle = {R_0} + {R_1}P_2^0\left( x \right) + {R_2}P_4^0\left( x \right) + {R_3}P_6^0\left( x \right) + {R_4}P_6^6\left( x \right)\cos 6\varphi + {R_5}P_6^6\left( x \right)\sin 6\varphi + \cdots$$
Based on above principles, the direction-dependent domain size and microstrain of α-Ti on the surface are obtained after Rietveld refinement.
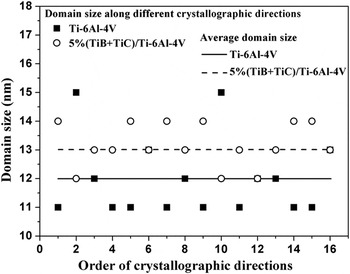
To compare the domain size distribution of these two kinds of materials, Fig. 6 shows all domain sizes along different directions and the average values. It can be found that after SP treatment, the average domain size of Ti–6Al–4V is smaller than that of the composite (TiB + TiC)/Ti–6Al–4V. The size error can be calculated as
 $$R = \pm \sqrt {{{{{\left( {{m_1} - {m_0}} \right)}^2} + {{\left( {{m_2} - {m_0}} \right)}^2} + \cdots + {{\left( {{m_n} - {m_0}} \right)}^2}} \over n}} \quad .$$
Direction-dependent domain size of α-Ti on the surface.

The value m i represents the refined value, and m 0 is the average value. Based on the refinement results in Table I, the error of the matrix Ti–6Al–4V is 1.32 nm, but that of the composite 5% (TiB + TiC)/Ti–6Al–4V is only 0.75 nm. The results indicate that the distribution of domain size of Ti–6Al–4V fluctuates along different directions after SP, which results from the deformation of the surface layer during SP. However, there is a smaller amount of fluctuation in the distribution of domain size in 5% (TiB + TiC)/Ti–6Al–4V, which may be due to the reinforcements' resistance to the deformation of matrix.
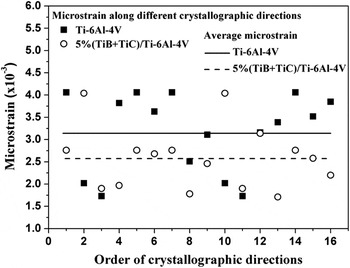
The variation trend of microstrain shown in Fig. 7 is inverse of the trend of domain size in Fig. 6. Analyzing the average values in Fig. 7, the microstrain of Ti–6Al–4V is greater than that of the composite, which results from the reinforcements present in the composite. The reinforcements TiB and TiC particles play important roles in the process of SP treatments. Firstly, the reinforcements' resistance to the deformation of surface layer is obvious. In the matrix, when there are no reinforcements, the deformation is much more severe than that of the composite, and the microstrain of Ti–6Al–4V is greater than that of 5% (TiB + TiC)/Ti–6Al–4V in Fig. 7. Secondly, after SP, the high dislocation density is produced in surface layers and the domain sizes are refined sharply. The reinforcements can prevent the dislocation gliding and the movement of grain and subgrain boundaries during SP, which results in the larger domain sizes of 5% (TiB + TiC)/Ti–6Al–4V in Fig. 6.
Direction-dependent microstrain of α-Ti on the surface.

In our previous work, the influences of reinforcements on the deformation of surface layer have been investigated by experimentation and discussed. Reference Xie, Wang, Jiang and Lu34 Based on previous work, after SP, most reinforcements incline in the surface layer, and the inclination directions are different and random. The different inclination directions of reinforcements are caused by the strain of matrix Ti–6Al–4V. Comparing the samples with different volume fraction of reinforcements, it can be found that the more volume fraction of reinforcements, the less inclination appears. Because the hardness and elastic modulus of the reinforcements are much higher than those of the matrix, in addition to the fact that the sizes of reinforcements are very small, it is difficult to cause deformation in the reinforcements during SP. The reinforcements incline to yield to the strain of matrix, but the reinforcements also resist the deformation of matrix during SP. According to the analysis by Rietveld whole pattern fitting method, the calculated data in this work also agrees with the experimental results in the Ref. Reference Xie, Wang, Jiang and Lu34.
Because the variation trends of the average domain sizes between Ti–6Al–4V and (TiB + TiC)/Ti–6Al–4V are similar, as a representative, the latter is chosen for investigating the distribution of average domain size of α-Ti in depth. The measured XRD patterns of 5% (TiB + TiC)/Ti–6Al–4V at different depths after SP treatments are shown in Fig. 8, and the SP intensity is 0.30 + 0.15 mmA. To indicate the variation in peak breadth at varying depths from the surface, the normalized
 ${k_{{\alpha _1}}}$
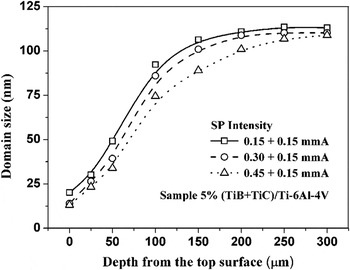
diffraction profiles of the highest peak of Ti (101) are inserted and the results show that with the increase of depth, the peak breadth reduces, which means the domain size is changed with the variation of depth. The accurate values of domain sizes obtained by the Rietveld method are shown in Fig. 9. Three samples are treated under three different SP intensities, and the results show that the smallest domain size appears on the top surface, and the higher SP intensity, the smaller domain size. Moreover, the average domain size clearly increases with an increase of depth, then maintains stability after 200 μm while SP intensities are 0.15 + 0.15 and 0.3 + 0.15 mmA. However, under the SP intensity of 0.45 + 0.15 mmA, the average domain size maintains stability after 300 μm, which is due to more plastic deformation and the deeper deformation layer under higher SP intensity.
XRD patterns of 5% (TiB + TiC)/Ti–6Al–4V at different depths after SP treatments, and the SP intensity is 0.30 + 0.15 mmA. The insert shows the normalized
 ${k_{{\alpha _1}}}$
diffraction profiles of the highest peak of Ti (101).

Distribution of the average domain size of α-Ti of 5% (TiB + TiC)/Ti–6Al–4V with the increase of depth.

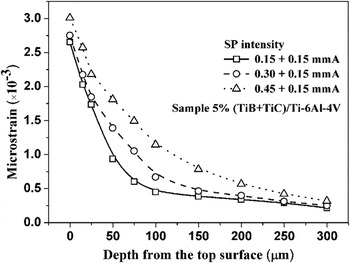
The average microstrain of α-Ti along the variation of depth after SP is also obtained and shown in Fig. 10. The variation trend of microstrain is inverse of that of the domain size. The microstrain reaches the maximum on the surface, and then decreases with the increase of depth, gradually stabilizing. At the same depth, the higher SP intensity, the greater average microstrain. The deformation layers are about 200, 200, and 300 μm corresponding to the SP intensities of 0.15 + 0.15, 0.3 + 0.15, and 0.45 + 0.15 mmA respectively, which agrees with the results in Fig. 9. These variations result from more plastic deformation while increasing the SP intensity because of the higher kinetic energy of shot balls.
Distribution of the average microstrain of α-Ti of 5% (TiB + TiC)/Ti–6Al–4V with the increase of depth.

Based on the fitting and calculation, the domain sizes are smallest at the surface of the sample after SP. Under the same SP intensity, the domain sizes of the matrix are smaller than that of the composite at the same depth, as there are no reinforcements to provide resistance to the deformation of the matrix. As SP intensity increases, more refined domains are produced. Because of the higher SP intensity and the larger impact kinetic energy of shot balls, the strain is more severe. The refined domain sizes are influenced by both the reinforcements and the SP intensities. However, the intensity of SP clearly has a greater effect on the refined domain sizes than that of reinforcements.
D. Probability distribution of domain size
During Rietveld whole pattern fitting, the distribution of domain size can be obtained from the probability distribution function. In the beginning, the grain-size distributions in nanocrystalline materials can aptly be described by a lognormal function, and which has been verified experimentally by Granqvist and Buhrman in 1976, Reference Granqvist and Buhrman35 and Haas and Birringer in 1992. Reference Haas and Birringer36 Afterward, Kril and Birringer utilized the normalized lognormal distribution to estimate the grain-size distributions in metallic nanocrystalline from XRD profile analysis. Reference Kril and Birringer37 The improved lognormal distribution has been introduced in Popa and Balzar's work Reference Popa and Balzar38,Reference Balzar and Popa39 about analyzing microstructure using the Rietveld method.
Based on the Refs. Reference Popa and Balzar38 and Reference Balzar and Popa39, the improved lognormal distribution for spherical crystallites is characterized by two parameters, the average radius
 $\bar R$
of the particles and the dispersion
 $\sigma _R^2$
. It is convenient to define a dimensionless ratio
 $c = {{\sigma _R^2}/ \mathord{\left {\vphantom {{\sigma _R^2} {{{\bar R}^2}}}} \right. \kern-\nulldelimiterspace} {{{\bar R}^2}}}$
to characterize the distribution. And the lognormal distribution function can be shown as follows.
 $$f\left( R \right) = \;{R^{ - 1}}{\left[ {2\pi \ln \left( {1 + c} \right)} \right]^{{{ - 1} \mathord{\left/ {\vphantom {{ - 1} 2}} \right. \kern-\nulldelimiterspace} 2}}} \times \exp \left\{ {{{ - {{\ln }^2}\left[ {R{{\bar R}^{ - 1}}{{\left( {1 + c} \right)}^{{1 \mathord{\left/ {\vphantom {1 2}} \right. \kern-\nulldelimiterspace} 2}}}} \right]} \mathord{\left/ {\vphantom {{ - {{\ln }^2}\left[ {R{{\bar R}^{ - 1}}{{\left( {1 + c} \right)}^{{1 \mathord{\left/ {\vphantom {1 2}} \right. \kern-\nulldelimiterspace} 2}}}} \right]} {\left[ {2\,\ln \left( {1 + c} \right)} \right]}}} \right. \kern-\nulldelimiterspace} {\left[ {2 \ln \left( {1 + c} \right)} \right]}}} \right\}\quad .$$
In addition, the function of the wide diffraction profile influenced by the domain size can be shown as:
 $$\bar P\left( S \right) = \left( {{{3\bar R} \mathord{\left/ {\vphantom {{3\bar R} 2}} \right. \kern-\nulldelimiterspace} 2}} \right){\left( {1 + c} \right)^3}\bar \Phi \left( {2\pi s\bar R} \right)\quad ,$$
where
 $\bar \Phi$
is the function of interference. By adjusting the related parameters in
 $\bar P(S)$
, the fitted profile will be extremely similar to the measured profile.
Commonly, the probability distribution model mentioned above is suitable for spherical crystallites. In this study, because the matrix of Ti–6Al–4V is polycrystalline and isotropic, the shape of crystallites of α-Ti can be regarded as spherical, seen in the SEM images of α phase along two different directions in Fig. 1. The distribution of α-Ti in the composite is similar to that in the matrix, so the probability distribution model is also suitable for this TMC of (TiB + TiC)/Ti–6Al–4V. Moreover, after SP, the nanocrystalline layer is introduced in the surface layer of the matrix and (TiB + TiC)/Ti–6Al–4V, which is very similar to the investigated metallic material in the Ref. Reference Kril and Birringer37. Thus the probability distribution model utilized in this study is appropriate.
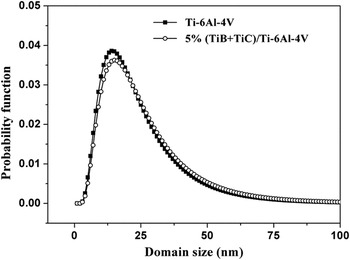
The results obtained via the lognormal distribution model are shown in Fig. 11. After SP, the average domain sizes on surface are distributed in the range of 0–50 nm. For Ti–6Al–4V and (TiB + TiC)/Ti–6Al–4V, the maximum values of probability function appears while the domain size are 13 and 15 nm, respectively. So the average domain size of the composite is a little bigger than that of Ti–6Al–4V. In the same domain size, the probability of plastic deformation in Ti–6Al–4V is greater than that in the composite, which is ascribed to the existence of reinforcements. The reinforcements retard the plastic deformation during the process of SP treatments.
Probability distribution of the domain sizes of Ti–6Al–4V and 5% (TiB + TiC)/Ti–6Al–4V on the surface after SP (SP intensity: 0.3 + 0.15 mmA).

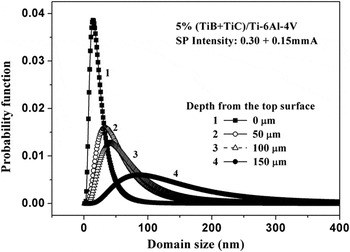
The lognormal distribution of domain sizes of 5% (TiB + TiC)/Ti–6Al–4V along the depth after SP have been shown in Fig. 12. With the increase of the depth, the range of the distribution of domain size expands gradually. At a depth of 150 μm, the maximum probability appears with the domain size of 100 nm, which is shown clearly in Fig. 12. The variation trend is consistent with the results calculated using the Voigt method; the domain size increases and then stabilizes with increasing depth from surface. Reference Xie, Jiang, Lu, Feng and Wu40 The probability distribution of domain size of Ti–6Al–4V along the depth is similar to that of the composite, so only the results of the composite are shown and illustrated. By analyzing, it can be found that Rietveld whole pattern fitting method is a useful and effective method to predict the probability distribution of domain sizes.
Probability distribution of the domain sizes of 5% (TiB + TiC)/Ti–6Al–4V with increasing depth after SP (SP intensity: 0.3 + 0.15 mmA).

Based on above fitting, analysis and discussion, the variation trends of microstructure obtained using the Rietveld method are consistent with those results calculated using the Voigt method in previous work. Reference Xie, Jiang, Lu, Feng and Wu40 Thus the Rietveld method is an appropriate and useful method to investigate the surface microstructure of titanium alloy and TMCs after SP treatments.
IV. CONCLUSION
The surface microstructure of shot peened Ti–6Al–4V and 5% (TiB + TiC)/Ti–6Al–4V were investigated using the Rietveld method. The results revealed that the average domain size of Ti–6Al–4V was smaller than that of (TiB + TiC)/Ti–6Al–4V after both samples underwent SP, due to the reinforcements' resistance to the deformation in the composite. The distribution of microstructure with the increase of depth indicated that the thickness of deformation layers were about 200, 200, and 300 μm corresponding to the SP intensities of 0.15 + 0.15, 0.3 + 0.15 and 0.45 + 0.15 mmA respectively, which was caused by the larger plastic deformation while increasing the SP intensities. The probability distribution of domain size was calculated via the lognormal distribution function. The maximum probability of domain size on the surface appeared while the domain sizes were 13 and 15 nm for Ti–6Al–4V and (TiB + TiC)/Ti–6Al–4V respectively. The probability distribution of domain size at different depth indicated that the range of distribution expanded gradually, and the variation trends agreed with the results calculated using the Voigt method. Based on above results, it can be seen that the Rietveld method is a useful method to investigate the microstructure of TMCs after SP treatments.
ACKNOWLEDGMENTS
This work is supported by the projects of National Natural Science Foundation of China (Grant No. 51302168 and 51502142), the 973 Program under Grant No: 2014CB046701, Research Foundation of Educational Commission of Sichuan Province of China (16ZA0367), Jiangxi Foreign Cooperation Program (Grant No.: 20144BDH80004), and The Hujiang Foundation of China (B14006). The financial support of the General Program of Natural Science Foundation of the Jiangsu Higher Education Institutions of China (Grant No. 15KJB430021) and the Startup Foundation for Introducing Talent of NUIST (No. 2014r036) are gratefully appreciated. The authors also thank to the financial support of the National Natural Science Foundation of China (No. 51405356), and the Research Fund for the Doctoral Program of Higher Education of China (No. 20130143120015). The authors gratefully acknowledge Mr. Timothy Ethington and Mr. Landon Ostler for their assistance on improving the language.