1. Introduction
It has long been believed that almost everywhere in western North America the Permo-Triassic (P-T) boundary is marked by a significant hiatus linked to the Sonoma orogeny (Dott, Reference Dott1961; Silberling & Roberts, Reference Silberling and Roberts1962). This presumed missing stratigraphic record for the P-T transition means that little can be learned about the P-T event in most places and particularly within the passive margin of the western North American craton (Paull & Paull, Reference Paull and Paull1994 a). Sedimentological arguments supporting the completeness of the P-T transition have been presented (Paull, Reference Paull1980; Alvarez & O'Connor, Reference Alvarez, O'Connor, Koeberl and MacLeod2002), but were overwhelmed by the commonly accepted model of a significant and ubiquitous gap between Permian and Triassic (Silberling & Roberts, Reference Silberling and Roberts1962; Tomlinson et al. Reference Tomlinson, Miller, Holdsworth, Whiteford, Snyder and Brueckner1987; Miller, Reference Miller1989; Wardlaw et al. Reference Wardlaw, Snyder, Spinosa, Gallegos, Scholle, Peryt and Ulmer-Scholle1995; Ketner, Reference Ketner2008). This major unconformity correlated with both a global sea-level lowstand and the Sonoma orogeny, with strata of the late Guadalupian, entire Lopingian and the lower part of the Early Triassic missing (Collinson, Kendall & Marcantel, Reference Collinson, Kendall and Marcantel1976; Wardlaw et al. Reference Wardlaw, Snyder, Spinosa, Gallegos, Scholle, Peryt and Ulmer-Scholle1995). Conodonts have been used as a biostratigraphic argument supporting the regional existence of a Guadalupian–Lopingian transition and P-T unconformity (e.g. Wardlaw et al. Reference Wardlaw, Snyder, Spinosa, Gallegos, Scholle, Peryt and Ulmer-Scholle1995). However, researchers differ in their interpretation of the ages for these biostratigraphic data (Kozur, Reference Kozur1975; Kozur et al. Reference Kozur, Brandner, Resch and Mostler1995), and the gap based on conodont interpretations may be more apparent than real.
During the last decade, geochemical and palaeomagnetic data have become available for the assumed P-T transition in Zechstein of Europe and the Arctic (Denison & Peryt, Reference Denison and Peryt2009; Szurlies, Reference Szurlies, Gasiewicz and Slowakiewicz2013) and in Phosphoria and Park City Basins in North America (Saltzman & Sedlacek, Reference Saltzman and Sedlacek2013) and support the existence of a preserved P-T transition in the Phosphoria. Here we report the discovery of the first volcanic ash bed within the upper Phosphoria Formation in SE Idaho. This helps to clarify the problem of biostratigraphic correlation between Europe and North America and allows us to address the issue about the presence of end-Guadalupian and possibly end-Lopingian extinction events in the passive margin of the North American craton. Finally, we provide additional hints on the expression and nature of the Sonoma orogeny.
2. Geological setting
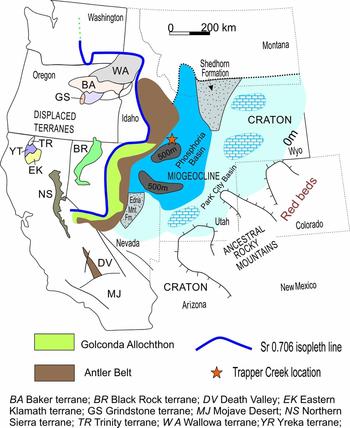
The Phosphoria depositional basin developed in late Leonardian (i.e. Kungurian, late Cisuralian) time as an interior sag basin of the Cordilleran miogeocline along the Pacific continental margin of the North American plate (Wardlaw & Collinson, Reference Wardlaw and Collinson1986). This miogeocline divided into two (or three) zones (Fig. 1), depending on the setting within the ramp: eastern ‘inner shelf’ and western ‘shelf slope and basin’ (Stevens, Reference Stevens, Cooper and Stevens1991; Wardlaw et al. Reference Wardlaw, Snyder, Spinosa, Gallegos, Scholle, Peryt and Ulmer-Scholle1995). A carbonate ramp developed on the eastern and southern margin of this basin. The western part is partly terminated against remnants of the early-middle Paleozoic Antler orogenic belt (Wardlaw, Reference Wardlaw1977). The region lay within the equatorial belt, and carbonate deposition dominated in shallow water areas except in N Wyoming and SW Montana where a siliciclastic source existed (Shedhorn Sandstone). Deeper water areas of the Phosphoria basin were characterized by dark organic-rich shale and siltstone, black chert, and phosphorite. These facies migrated back and forth across the carbonate ramp with relative changes of sea level. Rocks of the Phosphoria depositional basin can be assigned to two tectonic provinces: craton and miogeocline (Figs 1, 2). Relationships between miogeoclinal rocks and those of the orogenic belt to the west are obscure, because outcrops of Permian rocks are rare within a N-trending belt that is 150–200 km wide through central Nevada and Idaho. Older Early Permian and Pennsylvanian conglomeratic and clastic sequences along this belt indicate that highlands, probably islands, occupied part of the denuded and subsided Antler orogenic belt at various times during the late Palaeozoic (Poole & Wardlaw, Reference Poole, Wardlaw, Howell and McDougall1978). East of these highlands, relatively thick sequences of carbonate, chert and siltstone occur in the deeper parts of the Phosphoria Basin. These rocks thin eastward toward the craton, and become very thin and intertongue with red beds (Goose Egg Formation) east of the craton (Fig. 1). The Phosphoria basin developed within the miogeocline in NE Nevada, E Idaho, SW Montana, and N Utah. The Phosphoria Formation and the correlative Park City Group contain several members interpreted as reflecting eustatic transgressions onto and regressions off the Wyoming craton (Whalen, Reference Whalen, Longman and Sonnenfeld1996). The Permian in the Great Basin is overlain by an interbedded complex of calcareous shale, limestone and calcareous siltstone of the lower Triassic Dinwoody Formation (Fig. 2).
Palaeogeography of Phosphoria and Park City basins in the context of western margin North America geology, Guadalupian–Lopingian (after Wardlaw et al. Reference Wardlaw, Snyder, Spinosa, Gallegos, Scholle, Peryt and Ulmer-Scholle1995). The setting and facies within the entire Permian basin are shown with different colours and filling patterns. Solid dark blue – predominantly chert and siliciclastic sedimentation with dark grey for the deepest parts. Note that the found ash is located in the deep part of the basin with the depth below wave base. Solid light blue – shallow water setting with mostly cherty-carbonate sedimentation. Limestone filling in Wyoming shows pure carbonate sedimentation. Light grey colour with dots indicates areas with heavy siliciclastic sedimentation (Shedhorn and Edna Mountains formations). Sr 0.706 isopleth line separates the North American passive margin from the rest of the alien terranes.

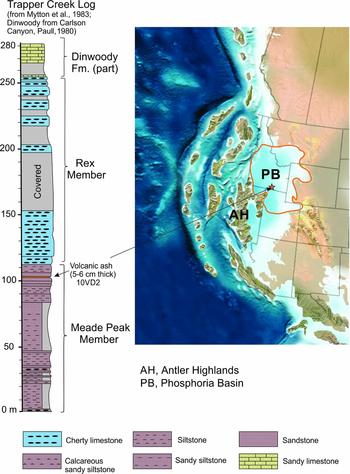
Stratigraphic log of the Phosphoria (from Mytton, Morgan & Wardlaw, Reference Mytton, Morgan, Wardlaw, Miller, Todd and Howard1983) and lower Dinwoody (from Paull, Reference Paull1980) formations in the Trapper Creek area. The ash bed is located 11 m below the top of the Meady Peak Member of Phosphoria Formation. The star indicates the approximate position of the locality in the palaeogeographic map (after Blakey, Reference Blakey2013).

3. Phosphoria and Dinwoody formations stratigraphy
The Phosphoria Formation in the Cassia Mountains represents the southwesternmost exposure of the Phosphoria in SE Idaho and includes both the Meade Peak Phosphatic Shale and overlying Rex Chert members. The Meade Peak is distinguished by dark-brown, thin-bedded siltstone with minute white-weathering phosphatic oolites or pellets. Interbeds of shale, chert, silty limestone and fine-grained sandstone are locally present (Figs 2, 3, 4). The upper part of the Meade Peak is characterized by thin-bedded orthoquartzite, brown chert, and white to variegated platy silicified sandstone and siltstone. The thickness of the Meade Peak varies from 100 to 120 m (Mytton, Morgan & Wardlaw, Reference Mytton, Morgan, Wardlaw, Miller, Todd and Howard1983).
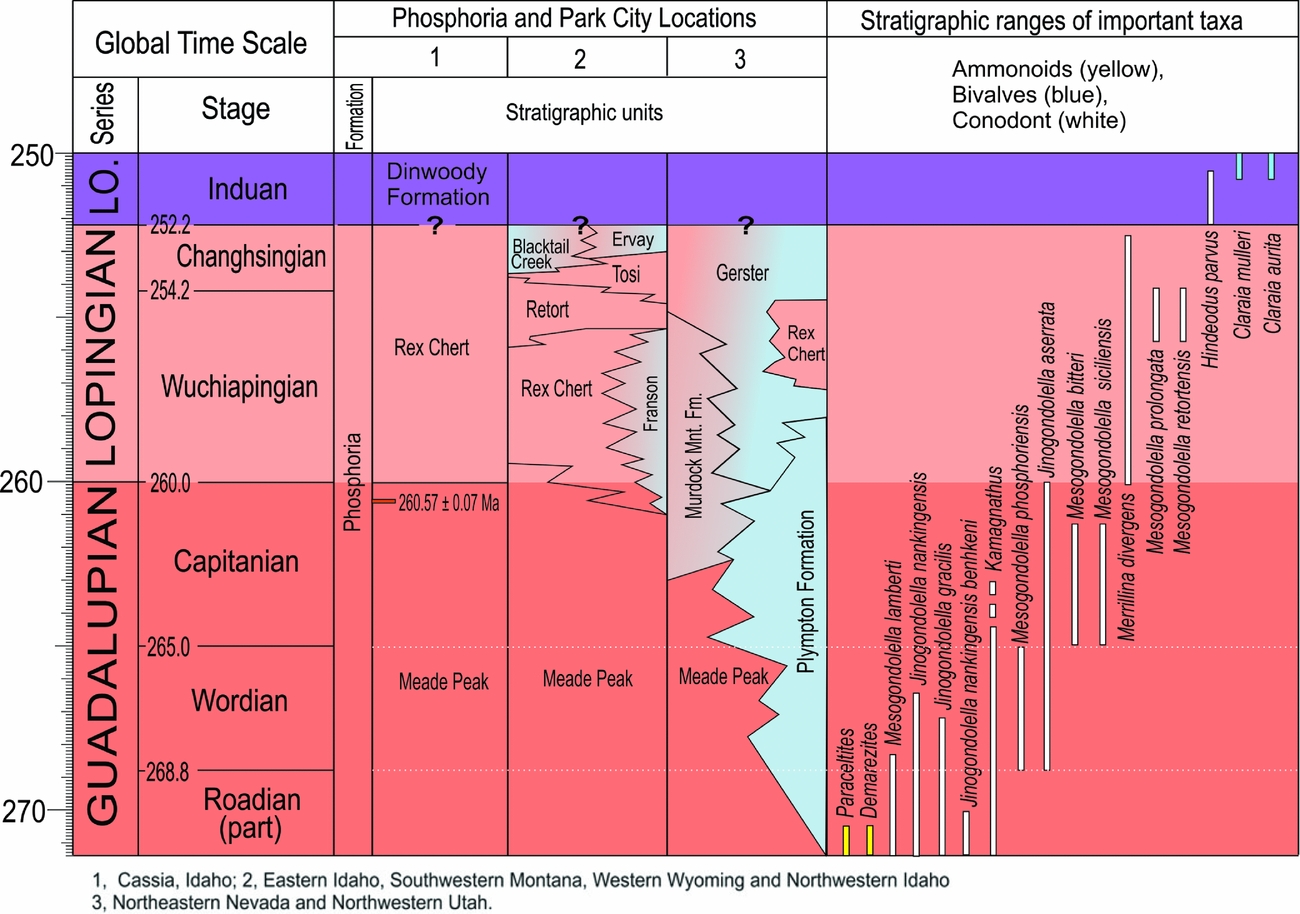
Local lithostratigraphy and stratigraphic ranges of the main fossil indexes of the Phosphoria and Park City formations in Great Basin. The relationship of the lithostratigraphic units according to Wardlaw & Collinson (Reference Wardlaw and Collinson1986) and Wardlaw et al. (Reference Wardlaw, Snyder, Spinosa, Gallegos, Scholle, Peryt and Ulmer-Scholle1995). Park City units are filled with blue or blue/brownish colours. The record of the fossil ranges is compiled from Wardlaw and Collinson (Reference Wardlaw, Collinson, Sandberg and Clark1979, Reference Wardlaw and Collinson1986), Paull (Reference Paull1980), Paull & Paull (Reference Paull and Paull1994 b), Wardlaw et al. (Reference Wardlaw, Snyder, Spinosa, Gallegos, Scholle, Peryt and Ulmer-Scholle1995), Wardlaw (Reference Wardlaw2001, Reference Wardlaw2003), Henderson & Mei (Reference Henderson and Mei2007) and Hofmann, Hautmann & Bucher (Reference Hofmann, Hautmann and Bucher2013).

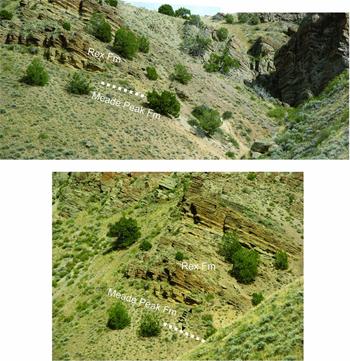
Panoramic view and details of the location of the collected ash bed at the right bank of the Trapper Creek area. The Meade Peak Member is reasonably exposed here due to the deep canyon appearance. Fm = Formation. White line indicates the position of the volcanic ash.

The Rex Chert Member, over 230 m thick, is the uppermost unit of the Permian sequence in the Cassia Mountains and is conformably overlain by the Dinwoody Formation (Paull, Reference Paull1980). According to Wardlaw & Collinson (Reference Wardlaw and Collinson1986), the Rex Member in the Cassia and Leach Mountains correlates with Retort and Tosi Chert members of Phosphoria of the eastern Phosphoria basin. The Rex Member in the Cassia Mountains is composed of medium-dark grey, generally medium- to thick-bedded chert (Fig. 4) with 10–15 m cherty limestone bands. The chert weathers olive drab to brown with rare sparse fossil debris horizons. Some beds show lamination and cross-stratification. The lowermost part of the Rex is generally thin to medium bedded, the middle portion is thick bedded to massive and the upper part is medium to thick bedded. The Rex Chert Member is a prominent cliff-former. A thin-bedded limestone has been observed near the top of the Rex in the southern part of the Cassias and is proposed to be equivalent to the Gerster Formation of the Park City Series in Nevada (Mytton, Morgan & Wardlaw, Reference Mytton, Morgan, Wardlaw, Miller, Todd and Howard1983). The Rex Member in the Cassia Mountains is at least 230 m thick but in the area could be as much as 275 m thick (Mytton, Morgan & Wardlaw, Reference Mytton, Morgan, Wardlaw, Miller, Todd and Howard1983).
The Phosphoria Formation in the Cassia Mountains occupies a stratigraphic position between the underlying Trapper Creek Formation (with Kungurian conodonts Neostreptognathodus pnevi Kozur) and Grandeur Tongue of the Park City Formation (without fossils) and the overlying lower Triassic Dinwoody Formation (Paull, Reference Paull1980; Mytton, Morgan & Wardlaw, Reference Mytton, Morgan, Wardlaw, Miller, Todd and Howard1983). The Permian–Triassic contact at the Trapper Creek locality is not exposed, but, according to Paull (Reference Paull1980), in the nearby Carlson Canyon (8 km south of the studied location) it appears concordant. The basal Dinwoody unit is a 0.12 m thick layer of poorly sorted packstone conglomerate with clasts ranging in size from medium-grained sand to pebbles. The coarser fragments are angular to sub-rounded, spicular chert, and the matrix is a phosphatic carbonate containing silt-size to very fine, sand-size quartz grains. Dark-grey-brown, calcareous shale with several thin, dark limestone beds characterizes the lower 90 m of succession above the conglomerate (Paull, Reference Paull1980). A very wide distribution (270 000 km2) of the oldest Triassic strata was established by Paull & Paull (Reference Paull and Paull1986). They proposed that this reflects an extremely rapid sea-level rise at the very beginning of the Triassic. The base of the Dinwoody Formation in the area undoubtedly correlates with the base of the Triassic in the International Time Scale (Paull & Paull, Reference Paull and Paull1994 a, Reference Paull and Paull b ; Henderson, Davydov & Wardlaw, Reference Henderson, Davydov, Wardlaw, Gradstein, Ogg, Schmitz and Ogg2012; Hofmann, Hautmann & Bucher, Reference Hofmann, Hautmann and Bucher2013).
4. Methods and results
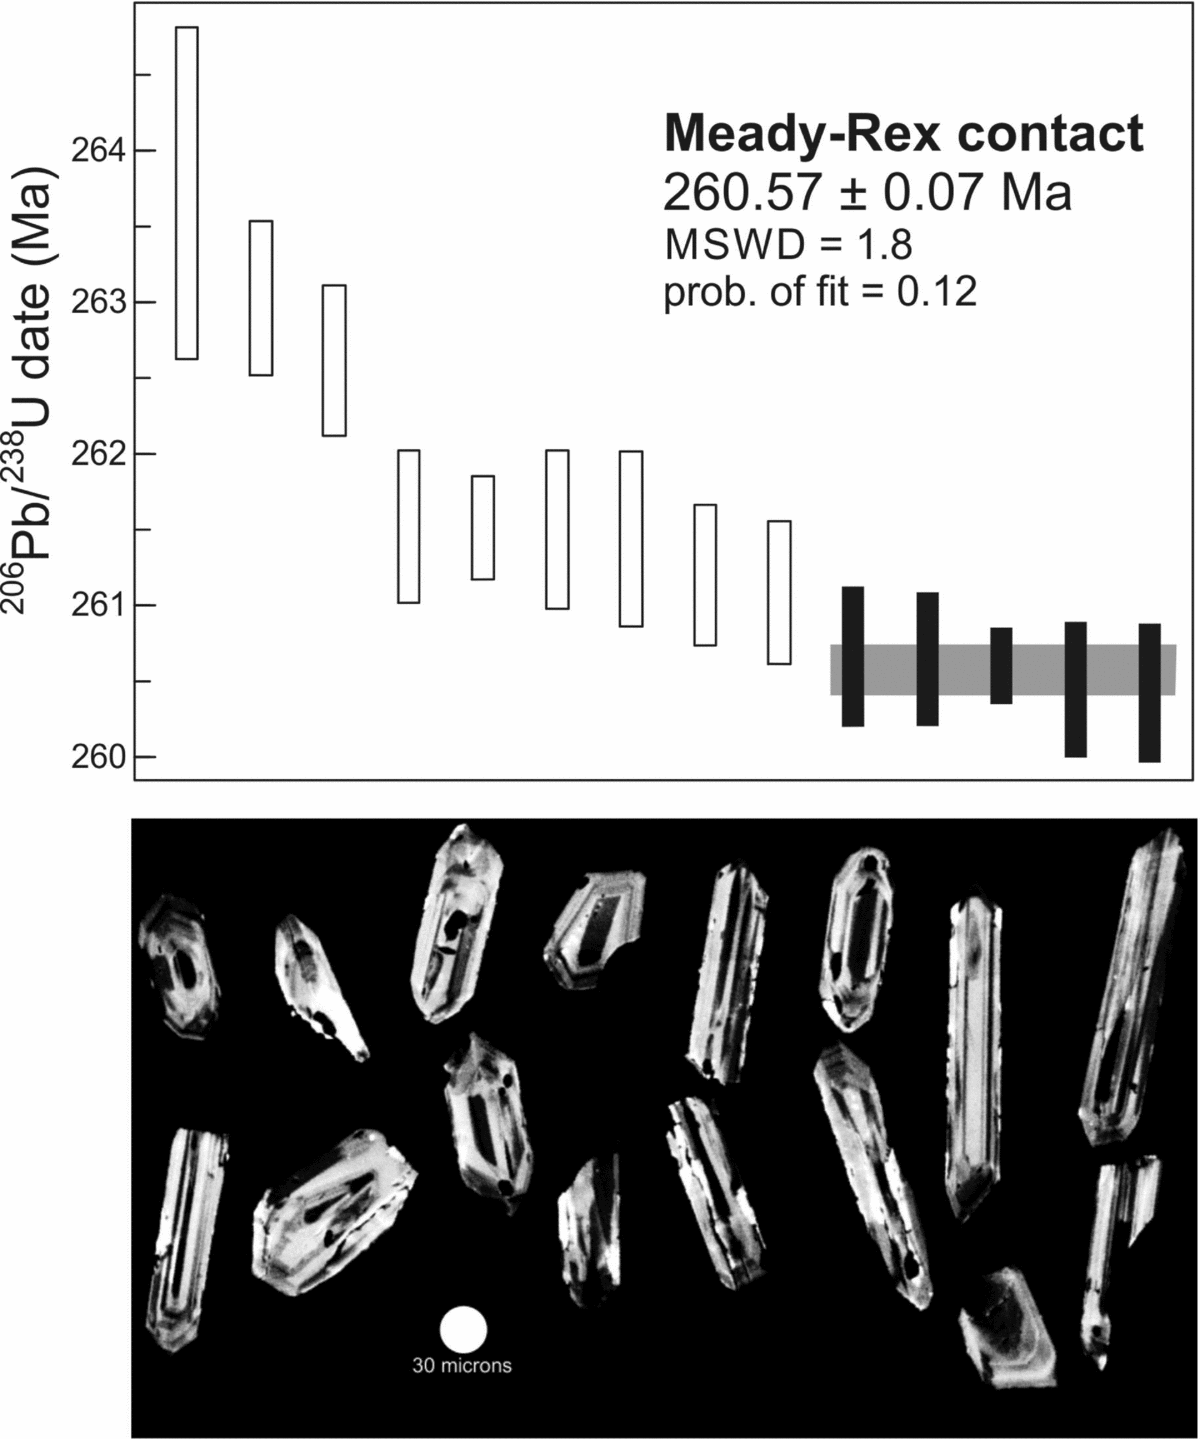
The brown ash is 10–15 cm thick, completely altered to bentonite and occurs 11 m below the top of the phosphatic Meade Peak Member (42° 6.943ʹN, 114° 7.060ʹ W) at Trapper Creek, Cassia County, Idaho (Mytton, Morgan & Wardlaw, Reference Mytton, Morgan, Wardlaw, Miller, Todd and Howard1983). The exposure located about 27 km from Oakley, Idaho, on the right slope of the creek. The upper Meade Peak and Rex units here are relatively well exposed at the cliff (Fig. 4). That is one of the few locations in the area where the contact between Meade Peak and Rex units can be seen and studied. Abundant populations of prismatic zircon crystals were separated from 2 kg hand sample in the volcanic horizon by conventional density and magnetic methods (Fig. 5).
Plot of 206Pb/238U dates from single grains of zircon analysed by CA-TIMS. Plotted with Isoplot 3.0 (Ludwig, Reference Ludwig2003). Error bars are at the 2σ confidence interval. A weighted mean date is shown and represented by grey boxes behind the error bars. One older date from 10VD2 is not shown.

5. CA-TIMS U–Pb geochronology methods
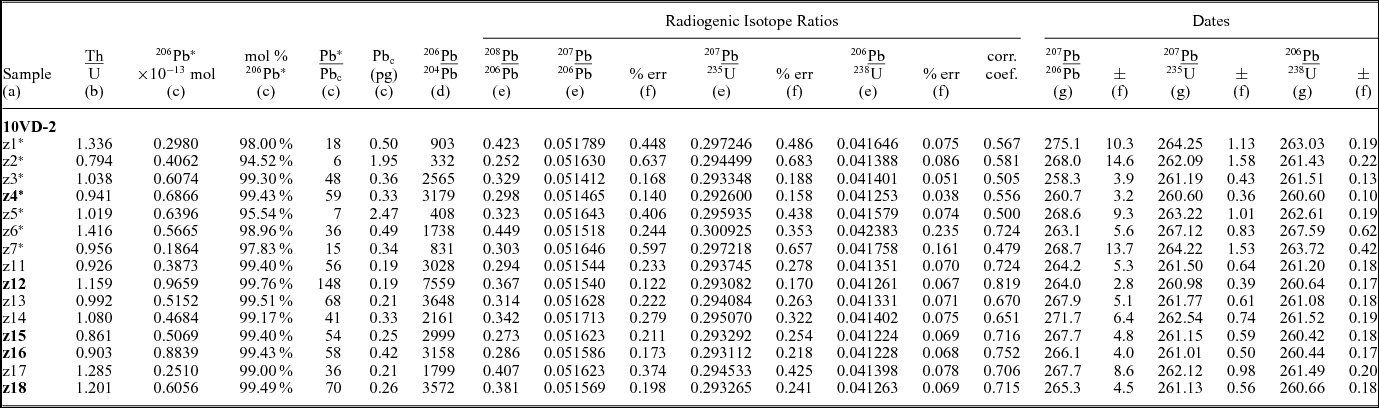
U–Pb dates were obtained by the chemical abrasion isotope dilution thermal ionization mass spectrometry (CA-TIMS) method from analyses composed of single zircon grains (Table 1). Zircon was separated from rocks using standard techniques and mounted in epoxy and polished until the centres of the grains were exposed. Cathodoluminescence (CL) images were obtained with a JEOL JSM-1300 scanning electron microscope and Gatan MiniCL. Zircon was removed from the epoxy mounts and subjected to a modified version of the chemical abrasion method of Mattinson (Reference Mattinson2005) reflecting analysis of single grains or fragments of grains. Zircon grains were selected for analysis based on the apparent lack of inherited cores in the CL images. Zircon was placed in a muffle furnace at 900 °C for 60 hours in quartz beakers. Single grains were then transferred to 3 ml Teflon PFA beakers and loaded into 300 μl Teflon PFA microcapsules. Fifteen microcapsules were placed in a large-capacity Parr vessel and the grains partially dissolved in 120 µl of 29 M HF for 12 hours at 180 °C. The contents of the microcapsules were returned to 3 ml Teflon PFA beakers, HF removed, and the residual grains immersed in 3.5 M HNO3, ultrasonically cleaned for an hour, and fluxed on a hotplate at 80 °C for an hour. The HNO3 was removed and grains were rinsed twice in ultrapure H2O before being reloaded into the 300 µl Teflon PFA microcapsules (rinsed and fluxed in 6 M HCl during sonication and washing of the grains) and spiked with the EARTHTIME mixed 233U–235U–205Pb (eight analyses) or 233U–235U–202Pb–205Pb (seven analyses) tracer solutions. Zircon was dissolved in Parr vessels in 120 μl of 29 M HF with a trace of 3.5 M HNO3 at 220 °C for 48 hours, dried to fluorides, and re-dissolved in 6 M HCl at 180 °C overnight. U and Pb were separated from the zircon matrix using an HCl-based anion-exchange chromatographic procedure (Krogh, Reference Krogh1973), eluted together and dried with 2 µl of 0.05 N H3PO4.
U–Pb isotopic CA-TIMS data from samples 10VD2.

(a) z1, z2, etc. are labels for analyses composed of single zircon grains or fragments of grains that were annealed and chemically abraded (Mattinson, Reference Mattinson2005). Labels in bold denote analyses used in the weighted mean calculations. Labels with * denote analyses that used the EARTHTIME 205Pb tracer solution; all others used the EARTHTIME 202Pb–205Pb tracer solution.
(b) Model Th/U ratio calculated from radiogenic 208Pb/206Pb ratio and 207Pb/235U date.
(c) Pb* and Pbc are radiogenic and common Pb, respectively. mol % 206Pb* is with respect to radiogenic and blank Pb.
(d) Measured ratio corrected for spike and fractionation only. Fractionation correction for analyses with EARTHTIME 202Pb–205Pb tracer solution is determined by measured 202Pb/205Pb. Fractionation correction for analyses with EARTHTIME 205Pb tracer solution is 0.18 ± 0.06 (2σ) %/amu based on analysis of EARTHTIME 202Pb–205Pb tracer solution.
(e) Corrected for fractionation, spike, common Pb, and initial disequilibrium in 230Th/238U. Common Pb is assigned to procedural blank with composition of 206Pb/204Pb = 18.04 ± 1.22 %; 207Pb/204Pb = 15.54 ± 1.04 %; 208Pb/204Pb = 37.69 ± 1.26 % (2σ). 206Pb/238U and 207Pb/206Pb ratios corrected for initial disequilibrium in 230Th/238U using Th/U [magma] = 3.0 ± 0.6 (2σ)
(f) Errors are 2σ, propagated using algorithms of Schmitz & Schoene (Reference Schmitz and Schoene2007) and Crowley, Schoene & Bowring (Reference Crowley, Schoene and Bowring2007).
(g) Calculations based on the decay constants of Jaffey et al. (Reference Jaffey, Flynn, Glendenin, Bentley and Essling1971). 206Pb/238U and 207Pb/206Pb dates corrected for initial disequilibrium in 230Th/238U using Th/U [magma] = 3.0 ± 0.6 (2σ).
Pb and U were loaded on a single outgassed Re filament in 5 µl of a silica-gel – phosphoric acid mixture (Gerstenberger & Haase, Reference Gerstenberger and Haase1997), and U and Pb isotopic measurements made on a GV Isoprobe-T multicollector thermal ionization mass spectrometer equipped with an ion-counting Daly detector. Pb isotopes were measured by peak-jumping all isotopes on the Daly detector for 100–160 cycles, and corrected for mass fractionation of 0.18 ± 0.03 %/amu (atomic mass unit) (1σ error) for analyses that used the 233U–235U–205Pb tracer solution or the value determined from the measured 202Pb/ 205Pb for analyses that used the 233U–235U–202Pb– 205Pb tracer solution. Transitory isobaric interferences due to high-molecular-weight organics, particularly on 204Pb and 207Pb, disappeared within approximately 30 cycles, while ionization efficiency averaged 104 cps/pg of each Pb isotope. Linearity (to ≥1.4 × 10⁶ cps) and the associated deadtime correction of the Daly detector were monitored by repeated analyses of NBS982, and have been constant since installation. Uranium was analysed as UO2 + ions in static Faraday mode on 1011 Ω resistors for 200–300 cycles, and corrected for isobaric interference of 233U18O16O on 235U16O16O with an 18O/16O of 0.00206. Ionization efficiency averaged 20 mV/ng of each U isotope. U mass fractionation was corrected using the known 233U/235U ratio of the EARTHTIME tracer solution.
CA-TIMS U–Pb dates and uncertainties were calculated using the algorithms of Schmitz & Schoene (Reference Schmitz and Schoene2007), EARTHTIME ET535 tracer solution (Condon et al. Reference Condon, Schoene, McLean, Bowring and Parrish2015; McLean et al. Reference McLean, Condon, Schoene and Bowring2015) with calibration of 235U/205Pb = 100.233, 233U/235U = 0.99506, and 205Pb/204Pb = 11 268), EARTHTIME ET2535 tracer solution (Condon et al. Reference Condon, Schoene, McLean, Bowring and Parrish2015; McLean et al. Reference McLean, Condon, Schoene and Bowring2015) with calibration of 235U/205Pb = 100.233, 233U/235U = 0.99506, and 205Pb/204Pb = 10 900, 202Pb/205Pb = 0.9992, and U decay constants recommended by Jaffey et al. (Reference Jaffey, Flynn, Glendenin, Bentley and Essling1971). 206Pb/238U ratios and dates were corrected for initial 230Th disequilibrium using a Th/U[magma] = 3.0 ± 0.3 using the algorithms of Crowley, Schoene & Bowring (Reference Crowley, Schoene and Bowring2007), resulting in an increase in the 206Pb/238U dates of ~0.09 Ma. All common Pb in analyses was attributed to laboratory blank and subtracted based on the measured laboratory Pb isotopic composition and associated uncertainty. U blanks are difficult to measure precisely, but are estimated at 0.075 pg.
A weighted mean 206Pb/238U date was calculated from equivalent dates using Isoplot 3.0 (Ludwig, Reference Ludwig2003). Error on the weighted mean date is given as ± x / y / z, where x is the internal error based on analytical uncertainties only, including counting statistics, subtraction of tracer solution, and blank and initial common Pb subtraction, y includes the tracer calibration uncertainty propagated in quadrature and z includes the 238U decay constant uncertainty propagated in quadrature. The internal error should be considered when comparing our date with 206Pb/238U dates from other laboratories that used the same EARTHTIME tracer solution or a tracer solution that was cross-calibrated using EARTHTIME gravimetric standards. Error including the uncertainty in the tracer calibration should be considered when comparing our date with those derived from other geochronological methods using the U–Pb decay scheme (e.g. laser ablation inductively coupled plasma mass spectrometry (ICP-MS)). Error including uncertainties in the tracer calibration and 238U decay constant (Jaffey et al. Reference Jaffey, Flynn, Glendenin, Bentley and Essling1971) should be considered when comparing our date with those derived from other decay schemes (e.g. 40Ar/39Ar, 187Re–187Os). Errors for weighted mean date and dates from individual grains are given at 2σ error.
6. U–Pb geochronology results
Fifteen zircon grains from 10VD-2 were analysed, the five youngest of which yielded equivalent 206Pb/238U dates with a weighted mean of 260.57 ± 0.07 / 0.14 / 0.31 Ma (MSWD = 1.8, probability of fit = 0.12). This is the interpreted deposition age of the ash based on the assumption that the older dates are from grains that were inherited in the magma chamber that erupted the ash or were incorporated into the ash as detrital zircon. Eleven other grains yielded 206Pb/238U older dates that are as old as 267.59 ± 0.62 Ma (Fig. 5).
7. Discussion
7.a. Conodont biostratigraphy of the Phosphoria Formation
The Phosphoria Formation in the Cassia Mountains occupies a stratigraphic position between Kungurian Trapper Creek Formation with Kungurian conodonts Neostreptognathodus pnevi Kozur and Grandeur Tongue of the Park City Formation (without fossils) and the overlaying lower Triassic Dinwoody Formation (Paull, Reference Paull1980; Mytton, Morgan & Wardlaw, Reference Mytton, Morgan, Wardlaw, Miller, Todd and Howard1983). The conodont assemblage recovered from the Phosphoria Formation is quite poor (Wardlaw & Collinson, Reference Wardlaw and Collinson1986). Mesogondolella asserata, M. phosphoriensis, M. rosenkrantzi, M. bitteri and M. siciliensis are reported from the Meade Peak of the Phosphoria and lower-middle Gerster of the Park City Formation in Idaho, Wyoming, Utah and Nevada (Wardlaw, Reference Wardlaw2003). Mesogondolella asserata is an index of the Wordian Stage and ranges into the Capitanian. M. siciliensis is described from Oman in the beds with ammonoid Timorites and conodont M. bitteri immediately below Wuchiapingian beds (Baud et al. Reference Baud, Richoz, Beauchamp, Cordey, Grasby, Henderson, Krystyn and Nicora2012). In the Delaware Basin, Timorites ranges from the upper Wordian to the top of the Capitanian. M. bitteri appears in the Meade Peak and Gerster Formation as a migrant with no ancestral forms in the region (Wardlaw, Reference Wardlaw2003). The proposed emigrational appearance of the M. bitteri is consistent with the fusulinid data suggesting the climatic optimum and consequent migration of Tethyan warm-water fusulinids in the Delaware Basin during the middle-late Capitanian (Davydov, Reference Davydov2014; Davydov et al. Reference Davydov, Biakov, Isbell, Crowley, Schmitz and Vedernikov2015).
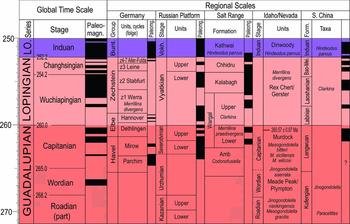
The youngest fauna in the Park City and Phosphoria formations are typified by abundant Merrillina divergens conodonts and occur in the Retort Phosphatic Shale and Tosi Chert members of the Phosphoria Formation in Wyoming (equivalent to the Meade Peak and Rex members in the Cassia Mountains, Idaho). This fauna also occurs in the uppermost part of the Gerster, where it is preserved beneath the pre-Triassic unconformity (Wardlaw & Collinson, Reference Wardlaw and Collinson1986). This species is a common temperate water form, occurring in the Salt Range, Oman, the Volga region, the Arctic, and in the basal unit of the Zechstein in Germany and the UK. According to Wardlaw (Reference Wardlaw2003), the lower range of the species is a good marker for the upper Wordian and the entire range of Merrillina divergens is restricted to the Guadalupian (upper Wordian and Capitanian). However, in Europe this species has been considered as early Wuchiapingian and the entire Zechstein correlates with the Wuchiapingian and Changsingian (Kozur et al. Reference Kozur, Brandner, Resch and Mostler1995). Conodont Hindeodus ‘typicalis’, which later was reinterpreted as H. parvus (Paull & Paull, Reference Paull and Paull1994 a, b), and bivalves Claraia were found in the lower Dinwoody Formation in the Carlson Canyon section (Paull, Reference Paull1980). The cosmopolitian bivalve species Claraia aurita has recently been found in the middle-upper Dinwoody, suggesting late Griesbachian to early Dienerian age (Hofmann, Hautmann & Bucher, Reference Hofmann, Hautmann and Bucher2013). In any case the base of the Dinwoody Formation in the region undoubtedly correlates with the base of the Triassic in the International Time Scale (Fig. 6) (Paull & Paull, Reference Paull and Paull1994 b).
The correlation of P-T transition of Nevada and Idaho with other important sections world-wide.

7.b. Geochemical and palaeomagnetic constraints
Geochemical and palaeomagnetic data from Polish and German Zechstein confirm the Lopingian (Late Permian) age of Zechstein (Denison & Peryt, Reference Denison and Peryt2009; Szurlies, Reference Szurlies, Gasiewicz and Slowakiewicz2013) (Fig. 6). Thus, this is indirect evidence that the upper part of Phosphoria and Park City could extend into the Lopingian. Saltzman & Sedlacek (Reference Saltzman and Sedlacek2013) presented geochemical and environmental biotic data and argued for the completeness of the P-T transition from the Park City Formation in Nevada and Utah. The study of the δ13C carbon from the upper Permian and lower Triassic Gerster and Thaynes formations in the western United States reveals a negative excursion with no evidence for major breaks within the Gerster–Thaynes transition. The 87Sr/86Sr analyses from the same samples in the Gerster suggest significant alteration and the Triassic trend in 87Sr/86S, but preserve the rising seawater 87Sr/86Sr trend of the Late Permian through Early Triassic, which allows Saltzman & Sedlacek (Reference Saltzman and Sedlacek2013) to conclude that, at least locally in the western United States, the latest Permian extinction event may be preserved in continuous stratigraphic successions. Our results support this conclusion, although the exact presence and completeness of the Permian–Triassic transition requires additional sedimentological, geochemical and ecological studies. The new radiometric age from the top of the Meade Peak Formation and the nature of the facies (deep water) within the Meade Peak – Rex and Rex–Dinwoody contacts suggest that the time intervals for the end-Guadalupian – Lopingian and most probably the end-Lopingian extinctions are preserved within the Guadalupian–Triassic succession in the Great Basin and surrounding regions (Figs 3, 6).
7.c. Sedimentation within the P-T transition, end-Guadalupian and end-Lopingian extinctions
The Trapper Creek locality occurs near the deepest part of the Phosphoria Basin, where the sedimentation is most complete (Fig. 1). Both, Meade Peak and Rex units, although of different lithology, sedimentologically are very monotonous throughout, and their facies (phosphatic shales and cherts) suggest rather uninterrupted sedimentation throughout. The volcanic ash discovered at the Trapper Creek locality occurs 11 m below the top of the Meade Peak Member. Taking into account that the sedimentation rate in Phosphoria was unchanged throughout the history of deposition in this basin (Hein et al. Reference Hein, Perkins, McIntyre and Hein2004), the approximate sedimentation rate was 1 m/400–480 ka. If this is correct, the Meade Peak – Rex contact corresponds to the Guadalupian–Lopingian boundary (GLB) as defined in the global scale. In the region, there is a prominent shift in sedimentation from the highly starved siliciclastic-dominant environments of Meade Peak into more chert-carbonate-dominated Rex environments. Perkins, Piper & Hein (Reference Perkins, Piper, Hein and Hein2004) suggest that this shift in sedimentation was eustatically driven, reflecting a change from transgressive to regressive conditions. This interpretation make sense as it is a well-known global phenomenon of the regression and significant sedimentation shift at the Guadalupian–Lopingian transition (Wignall et al. Reference Wignall, Sun, Bond, Izon, Newton, Vedrine, Widdowson, Ali, Lai, Jiang, Cope and Bottrell2009). Thus, the upper regressive unit of the Meade Peak Member (Perkins, Piper & Hein Reference Perkins, Piper, Hein and Hein2004) represents the latest Capitanian regression (known in Japan as the ‘barren interval’; Ota et al. Reference Ota, Isozaki, Shi, Campi and Shen2006).
It is presently unclear where the GLB occurs in the shallow water Park City Formation. The latest studies suggest the correlation of the Gerster and Murdock (Plympton) Formation of Park City with the Rex Formation in the Cassia Mountains (Wardlaw et al. Reference Wardlaw, Snyder, Spinosa, Gallegos, Scholle, Peryt and Ulmer-Scholle1995; Gilmor, 2014), i.e. GLB could be placed at the base of the Murdock Formation (Wardlaw et al. Reference Wardlaw, Collinson and Maughan1979). If so, the Lopingian in some sections in Nevada would be quite thick (around 800 m), which is highly unrealistic. Because the significant sedimentology shift in the middle-upper Park City Group occurs between the Murdock and Gerster formations, we might speculate that the GLB in Nevada probably occurs at the base of the Gerster Formation (Fig. 3). Taking into account the diachronous character of the formational boundaries in the region, the GLB boundary might occur laterally within the other formations (Fig. 3).
End-Guadalupian and end-Lopingian events are the greatest extinctions in Earth's history (Sepkoski, Reference Sepkoski2002). Both crises coincided with major changes in marine and continental ecosystems and severe climate changes. The events are well studied in many sections globally, but interpretations of the variation of climate and ecosystems obtained from the geochemical proxies vary from region to region (Wignall et al. Reference Wignall, Sun, Bond, Izon, Newton, Vedrine, Widdowson, Ali, Lai, Jiang, Cope and Bottrell2009) and even demonstrate diachronism (Algeo et al. Reference Algeo, Henderson, Ellwood, Rowe, Elswick, Bates, Lyons, Hower, Smith, Maynard, Hays, Summons, Fulton and Freeman2012). The re-sults presented here provide an opportunity for these proxies (organic and carbonate carbon, sulphur, nitrogen isotopes, trace elements, etc.) to be tested in the deep-water siliciclastic-dominated, and shallow-water carbonate, systems in many sections in the passive margin on the western North American craton, where the sedimentary record is reasonably preserved. In addition, fluxes of material between terrestrial and marine systems have played a prominent role in marine environmental changes during the crises and revealed a nearly global increase in sediment accumulation rates during the earliest Triassic (Algeo & Twitchett, Reference Algeo and Twitchett2010). It would be of great importance to evaluate this phenomenon in the easily accessible area in North America as well.
An additional implication of the present study concerns the Sonoma orogeny. We have previously argued (e.g. Northrup & Snyder, Reference Northrup and Snyder2000) that the effects of the Sonoma orogeny may be isolated to the outermost continental margin and associated offshore terranes, and that the final emplacement of the Golconda allochthon may have been a post-Early Triassic, or more likely a Middle Jurassic event. Although this paper is clearly not the venue for a thorough discussion of Permo-Triassic tectonics, the work presented here suggests that as a Late Permian to earliest Triassic event, the Sonoma orogeny was not of sufficient magnitude to disrupt the inboard miogeocline. Also, the presence of volcanic ash at the top of the Meade Peak and within the Rex Chert Member, as well as reported ash in the upper Wordian beds of the Delaware Basin, indicates the proximity of the volcanic activity during the Permian–Triassic transition. Thus, the Sonoma orogeny may have been a relatively minor event restricted to the outer continental margin and offshore arc terranes. The sudden but still rare occurrence of volcanic ash in the passive margin of North America since the middle-late Guadalupian time (upper Wordian ash beds) in the Delaware Basin and volcanic ash near the top of the Meade Peak Member in Cassia, Idaho, indicate the proximity, between 3000 and 1500 km in distance (Lee et al. Reference Lee, Chen, Wei, Iizuka and Carey2004), of the volcanic activity in the nearby regions during P-T transition. Volcanic ash beds have become frequent since the middle-late Triassic even in the continental setting (Stewart, Poole & Wilson, Reference Stewart, Poole and Wilson1972). At the same time the lack of any volcanic ash beds in the older sediments suggests that the volcanic source at that time occurs at a far distance that advises further re-evaluation of the palaeo-position volcanic source with regard to the North American craton in pre-Wordian/Capitanian time.
8. Conclusions
-
1. A latest Capitanian volcanic ash with high-precision CA-TIMS age of 260.57 ± 0.065 Ma has been documented in the upper Palaeozoic passive margin of North America for the first time.
-
2. The stratigraphic position of this ash near the top of the Meade Peak Phosphatic Member of Phosphoria Formation indicates the completeness of the sedimentation within the P-T transitions and opens the opportunity to study the end-Guadalupian and end-Lopingian biotic and climatic crises in the accessible area.
-
3. The biostratigraphy and palaeontology of conodonts, brachiopods and bryozoans in the Phosphoria and Park City formations requires serious reconsideration.
-
4. The potential lack of the unconformity at the P-T transition might suggest that Sonoma orogeny at the passive margin of the North American craton was not as extensive as was thought.
-
5. The sudden occurrence of volcanic ash in the passive margin of North America by the late Guadalupian suggests the need for further re-evaluation of the palaeo-position volcanic source with regard to the North American craton.
Acknowledgements
This paper was completed with support from NSF grants EAR-1124488 and partial support by the subsidy of the Russian Government to support the Program of Competitive Growth of Kazan Federal University among the World Leading Academic. Access to the library and some equipment from the Department of Earth & Environment of Florida International University, Miami, FL, USA, is highly appreciated.