Introduction
The Batagay megaslump is the highest outcrop of very icy permafrost on Earth, 55 m of sediments with large ice wedges and composite (sand-ice) wedges (Figures 1 and 2). Radiocarbon ages can help here to disentangle stratigraphic relations and the controlling factors, such as past climate or topography of the megaslump. Rapid accumulation of sediment and varying amounts of snow cover and snowmelt are other factors. In the southern part of the slump, the Upper Sand is covered by a Holocene cover only, and at the northeast part there is a site “sandwiched” between the Upper Ice Complex layers and a site covered by Holocene deposits. It is a manifestation of varied functions of factors affecting ice wedge development and sedimentation in areas under the Upper Ice Complex and without the Upper Ice Complex covering.
Thin composite (sand-ice) wedges (CW) locations in the Batagay Upper Sand unit: CW-10 (67.583444°N, 134.764556°E), CW-11 (67.58346°N, 134.76424°E), CW-12 (67.58347°N, 134.76402° E), CW-13 (67.58347°N, 134.76456°E), CW-14 (67.58150°N, 134.76227°E) and CW-15 (67.58150°N, 134.76227°E) and ice wedge in the Upper Ice Complex (IW-6 – 67.576972°N, 134.762°E). Photo for the background by Katie Orlinsky. The numbers on the map indicate position of study site and other locations of composite wedges mentioned in the text: 1—Batagay, 2—Ulakhan Sular, 3—Mamontov Klyk Cape, 4—Stolbovoy Island, 5—Bolshoy Lyakhovskiy Island, 6—Kotelny Island, 7—Bunge Earth Island.

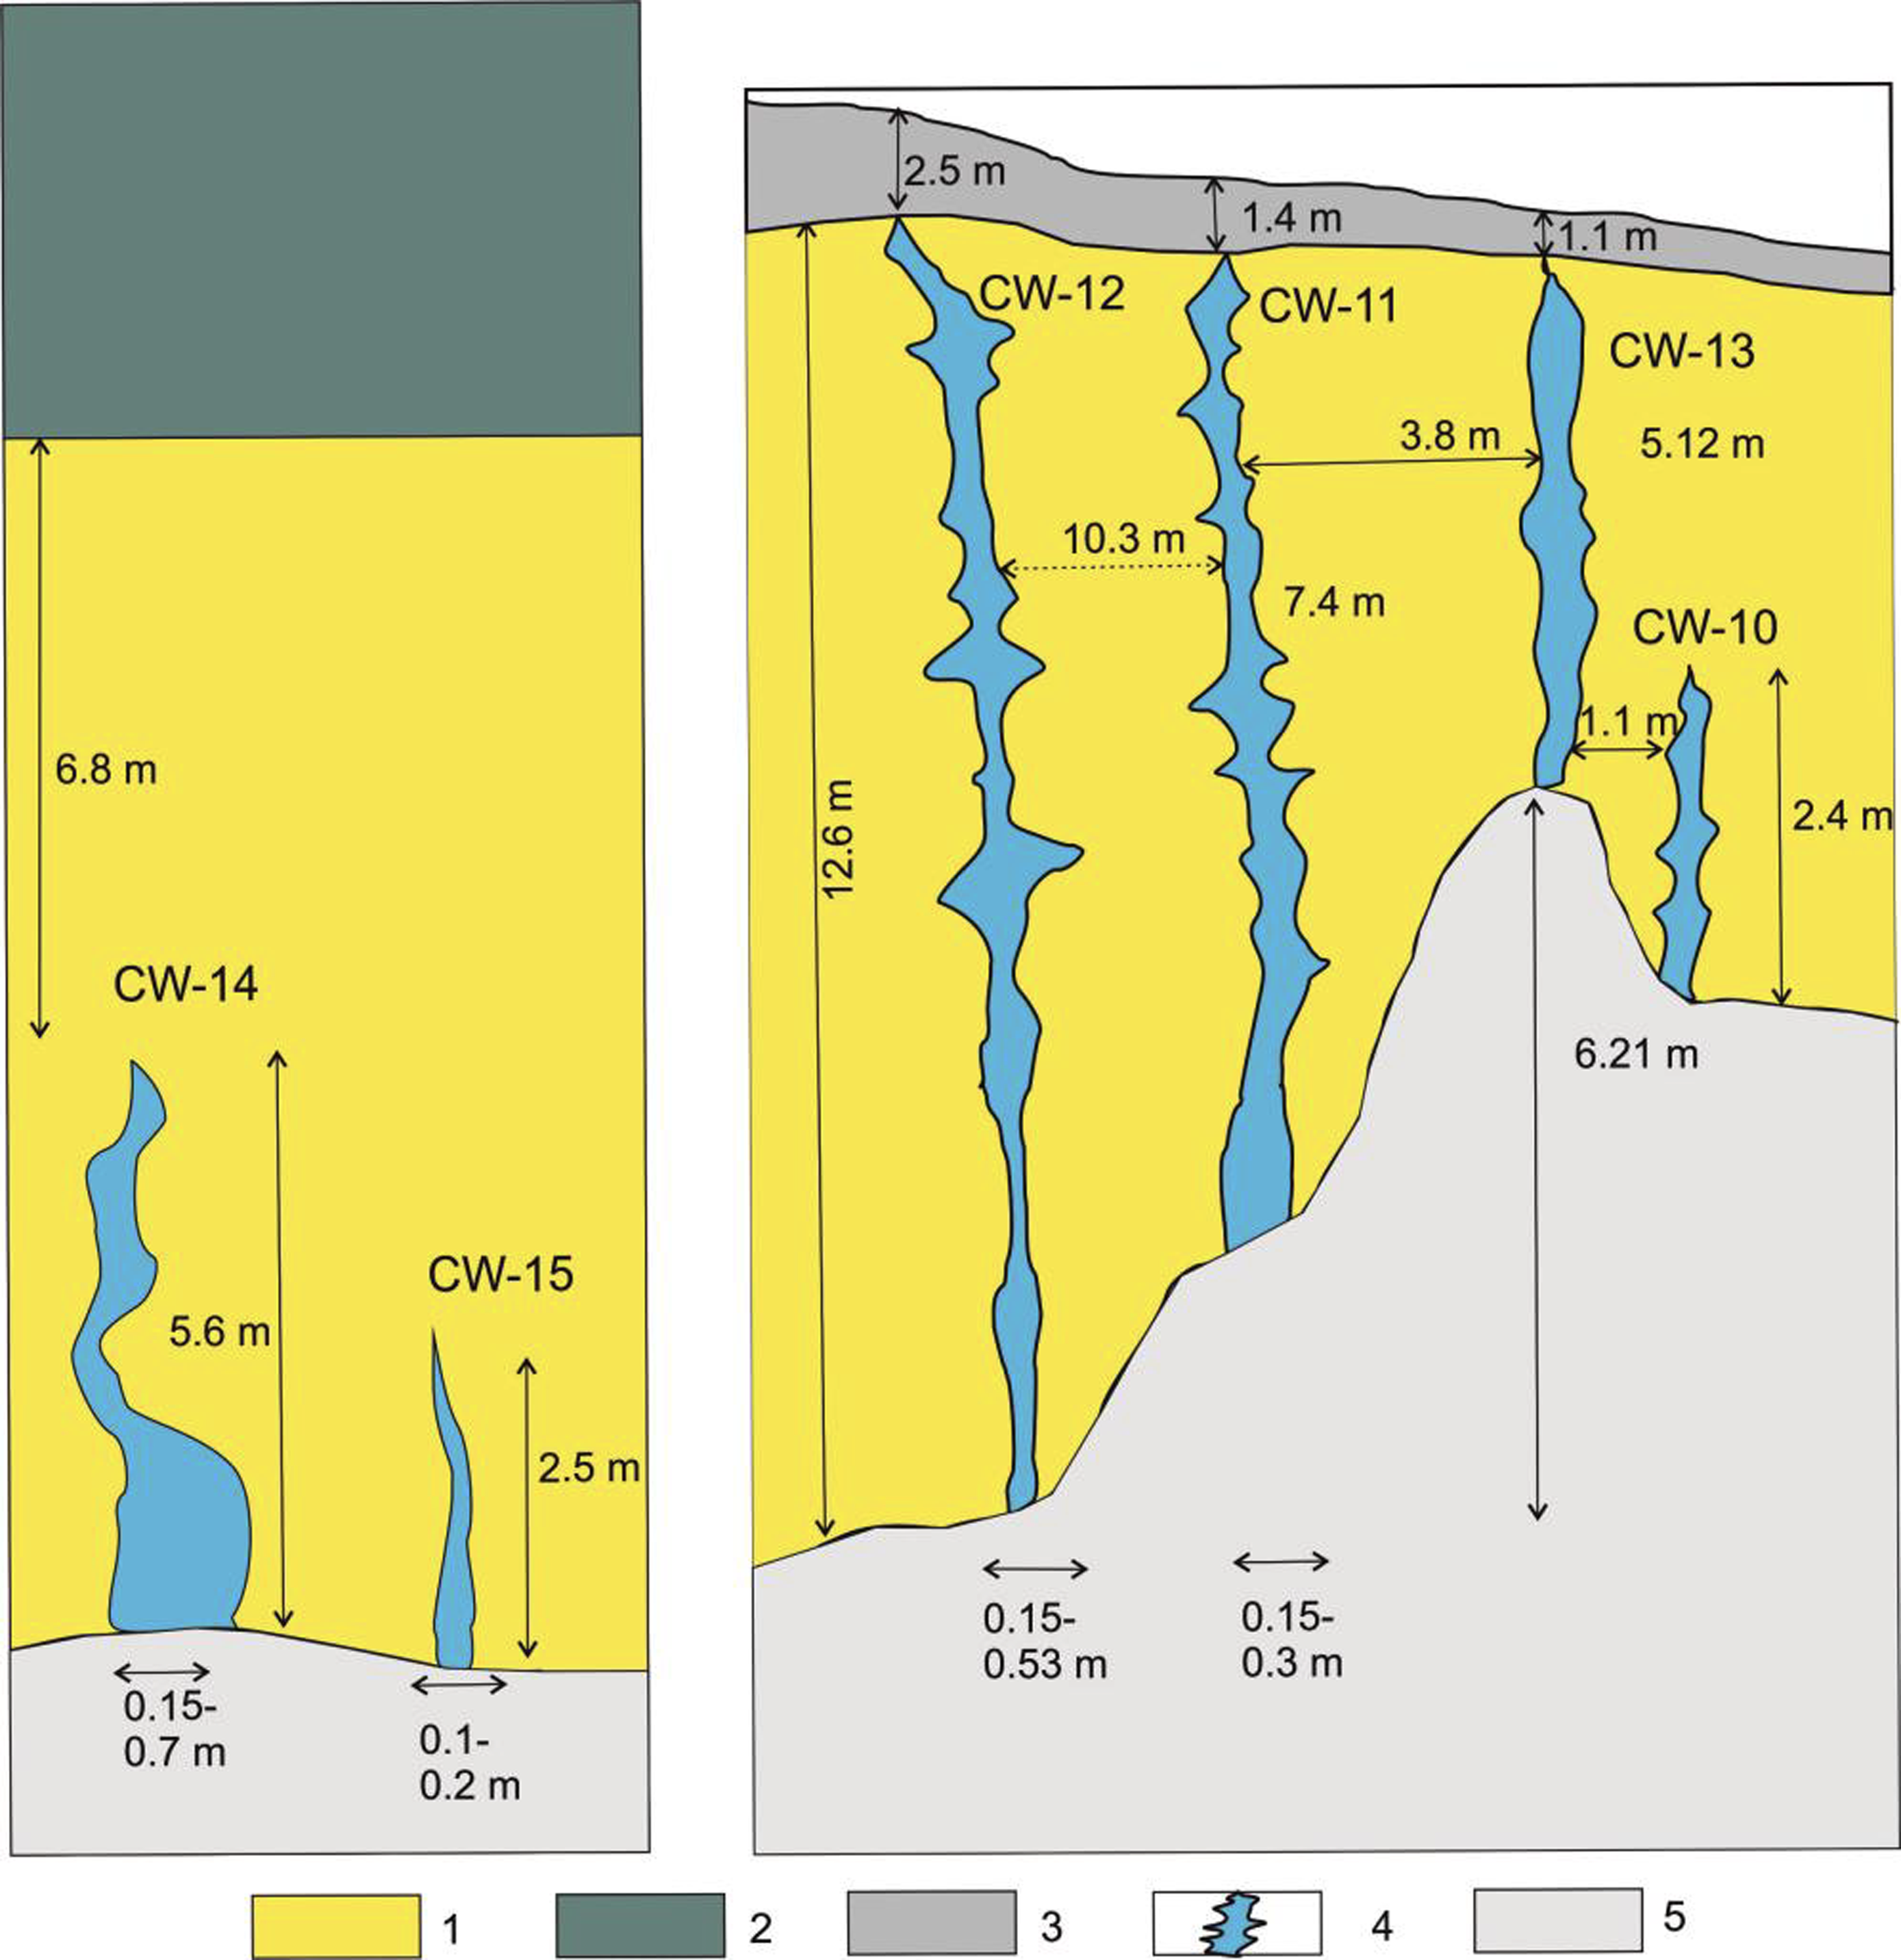
Schematic field cryostratigraphic sketch of the Upper Sand unit of the Batagay sedimentary sequence northwestern downslope: A—composite wedges in the inset of Upper Sand into Upper Ice Complex, B—composite wedges in the Upper Sand under Cover Layer: 1—Upper Sand unit, 2—Upper Ice Complex unit, 3—Cover Layer unit, 4—composite wedges (CW), 5—talus.

Considering the variability in parameters on the slopes, this study focuses on composite wedges and host sediment with a specific stratigraphy in the northwestern part of the Batagay megaslump.
Composite wedges (CW) are formed when, in some years, frost cracks are filled with water, which freezes and forms veins of ice, and in other years—with sand. The material of vertically oriented sand veins in the composite wedges corresponds to the composition of the host sediments (Dereviagin et al. Reference Dereviagin, Kunitsky and Meyer2007). Such sand veins have a narrow, chimney-like shape (Murton and Bateman Reference Murton and Bateman2007). The filling of cracks on the slopes may vary, as in this case it is possible to fill the cracks with a mixture of sand and meltwater flowing down the slope. The literature mostly focuses on ice-wedge cracking in polygonal peatlands. However, due to changes in strength characteristics and thermal contraction coefficients, cracking thresholds for sandy deposits may differ (Murton Reference Murton and Elias2013). As a result, composite wedges and ice wedges may not grow simultaneously in the same sequence.
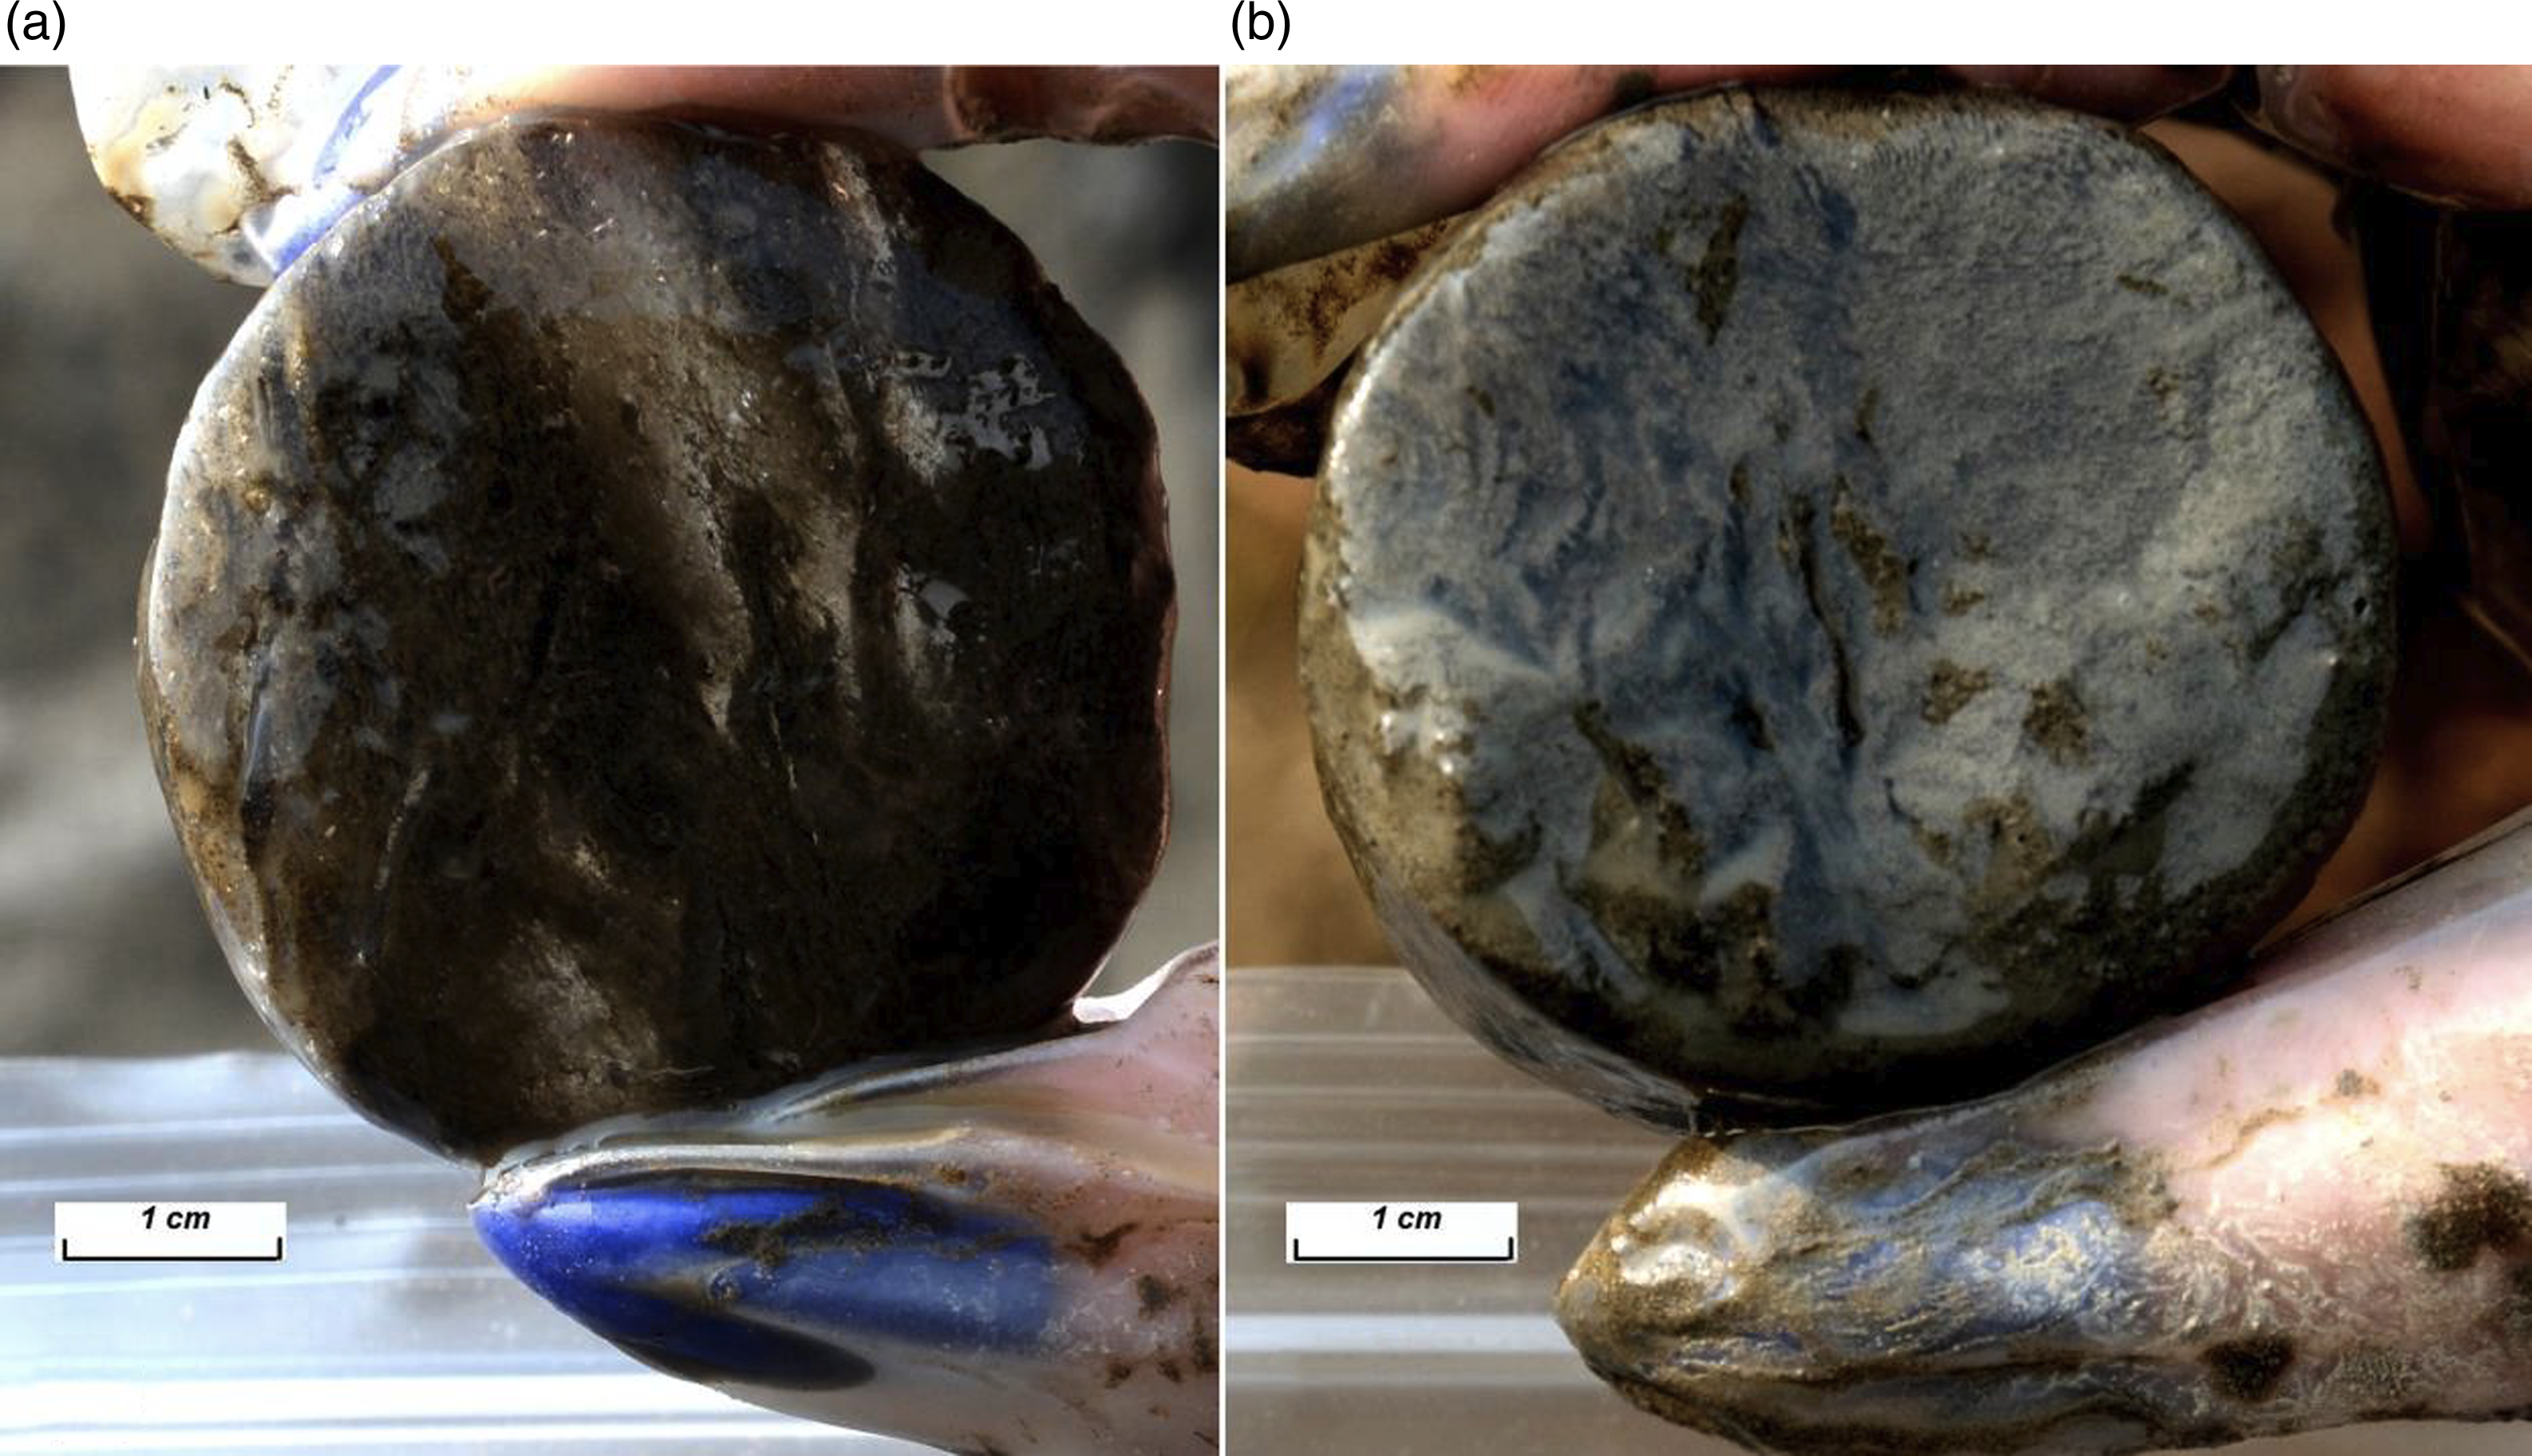
Murton et al. (Reference Murton, Opel, Wetterich, Ashastina, Savvinov, Danilov and Boeskorov2023) divided the Batagay sedimentary sequence into seven cryostratigraphic units: 1—Diamicton, 2—Lower Ice Complex, 3—Lower Sand, 4—Woody debris, 5—Upper Ice Complex, 6—Upper Sand, and 7—Near surface sand (Cover Layer). The authors studied the Upper Sand unit in the northwestern slope of the Batagay sequence for three years (2017–2019), and in 2019, they thoroughly tested and sampled the narrow composite wedges (Figures 2 and 3) for stable isotope analysis of oxygen and deuterium, as well as for AMS radiocarbon dating.
AMS 14C dated samples of the composite wedge in the Upper Sand unit of the Batagay sedimentary sequence: (a) IW-11, sample B-VV/2019-55 (36,710 ± 210 cal BP); (b) IW-13, sample B-VV/2019-65 (25,500 ± 120 cal BP).

There are many challenges in determining the age of the narrow composite wedges and the dating of the Upper Sand unit. Previously published ages of Upper Sand range from 42,390 to 15,090 cal BP (Murton et al. Reference Murton, Opel, Toms, Blinov and Fuchs2022, 4). The origin is thought to be an aeolian sand sheet that has been reworked by slope wash. More accurate determination of the age of the composite wedges in the Upper Sand will provide the key to understanding the age of the upper part of the Batagay sequence.
The purpose of this paper is to accurately date the composite wedges in Upper Sand unit and to perform approximate paleotemperature reconstructions of the accumulation conditions of the Upper Sand unit.
Site description
Batagay section or Batagaika (67°34'49.8''N, 134°46'19.3''E) is located 10 km southeast of the town of Batagay, in the Verkhoyansk region of northern Yakutia. The site lies on a northeast-facing hillslope ∼1.5 km downslope of a col between Mount Kirgilyakh and Mount Khatyngnakh. The maximum elevation of the megaslump’s edge is 325 m above sea level (Vasil’chuk et al. 2019). The hillslope leads down into the floodplain of the Batagay River, a right-bank tributary of the Yana River. One of gullies dissect the hillslope has developed into the Batagaika megaslump. The megaslump covers an area of 87.6 ha (Kizyakov et al. Reference Kizyakov, Korotaev, Wetterich, Opel, Pravikova, Fritz, Lupachev, Günther, Shepelev, Syromyatnikov, Fedorov, Zimin and Grosse2024). The permafrost is continuous with mean annual ground temperatures of –8.0°C to –5.5°C and active-layer thicknesses ranging from 0.2 to 1.2 m, depending on soil and vegetation types (Ivanova Reference Ivanova, Phillips, Springman and Arenson2003). The regional climate is strongly continental. The mean annual air temperature varies from –11.4 to –16.4°C. From 1949 to 2025, the mean January temperature is –43.3°C, from 1949 to 2024 annual air temperature is –16.4 to –11.4°C with minimums in January (down to –50.9 °C) and maximums in July (up to +21.9 °C) (www.pogodaclimat.ru).
Stratigraphic position of Upper Sand unit. The unit called Upper Sand is an apron of sand about 10–20 m thick that thickens downslope. The sand ranges from brown to light gray and contains blackish color bands due to the increased content of organic material and rootlets in situ. We observed alternating wedges of ice, sand, or sandy ice. Ice wedges of the Upper Ice Complex extend down a few meters into the upper part of the Upper Sand unit in the northwest downslope of the slump. In some parts of the slump the Upper Sand stratigraphically clearly overlies the Upper Ice Complex (Kizyakov et al. Reference Kizyakov, Korotaev, Wetterich, Opel, Pravikova, Fritz, Lupachev, Günther, Shepelev, Syromyatnikov, Fedorov, Zimin and Grosse2024). Syngenetic thin composite wedges have maximum heights of at least 18 m and maximum true widths (orthogonal to axial planes) of 0.3–1 m. In comparison, the Upper Ice Complex unit (Yedoma) has a maximum thickness of at least 20–25 m, the maximum height of a syngenetic ice wedges is at least 20 m, and their maximum real width (from orthogonal to axial planes) is between 1.5 and 2 m.
In the studied fragment of the Upper Sand unit CW-14 and CW-15 occur in the inset of the Upper Sand into the Upper Ice complex like “sandwich”. They are composed of brownish ice with thin lenticular veins of soil. They have not horizontal “shoulders.” Their width varies from 0.10 to 0.7 m and the height from 2.5 to 5.6 m (Figure 2a). Units CW-10, CW-11, CW-12, and CW-13 are located where the Upper Sand is directly covered by the Cover Layer (Figure 2b). All of them have a chimneylike shape. They are composed of grayish-brown ice with thin veins of soil and air bubbles. Their sides contained between three and five horizontal shoulders, above which the wedge narrowed abruptly, usually by a few centimeters (Figure 2b). Each shoulder probably marks the former ground surface when the sand sheet experienced a short pause (Murton and Bateman Reference Murton and Bateman2007). Their width varies from 0.10 m to 0.53 m and the height from 2.4 to 12.6 m.
Methods
Radiocarbon dating
Radiocarbon dating of microinclusions of organic material (particular organic carbon) extracted directly from ice wedges carried out at the Laboratory of Radiocarbon Dating and Electron Microscopy of the Geography Institute of the Russian Academy of Sciences (sample synthesis) and the Center for Applied Isotope Studies, University of Georgia (USA), were carried out on the 500 kV NEC 1.5SDH-1 pelletron (CAMS) (AMS 14C dating). According to the international agreement, the obtained dates are marked as IGANAMS. Organic microinclusions for 14C AMS analysis were extracted from 8 CW samples from the Upper Sand unit and 3 IW samples from the Upper Ice Complex unit. For the sample treatment the Carbon Samples Graphitization System AGE 3 (manufactured by Ion Plus, Switzerland) coupled with an element analyzer Vario Isotope for preparation of samples for radiocarbon analysis using accelerator mass spectrometry (AMS) and determination of carbon, hydrogen, sulfur and nitrogen in samples was used in the IG RAS radiocarbon laboratory. Radiocarbon dates were calibrated using OxСal 4.4 based on the IntCal20 data set and given as yrs cal BP (Ramsey Reference Ramsey Bronk2021; Reimer et al. Reference Reimer, Austin, Bard, Bayliss, Blackwell, Bronk Ramsey and Butzin2020).
Stable water isotope analyses
Measurements of the stable oxygen and hydrogen isotope composition in ice were carried out in two laboratories, for comparison: 1—in the stable isotope laboratory of the Geography Faculty at Lomonosov Moscow State University (Prof. Yu. Vasil’chuk and Dr. N. Budantseva) using a Finnigan Delta-V Plus mass spectrometer (in use since 2008); analytical precision was ±0.4‰ for δ18O and 1.5‰ for δ2H; and 2—using a Picarro L 2130-i laser isotope analyzer spectrometer (in use since 2021) at the Research Park, Saint Petersburg State University (Dr. I. Tokarev); analytical precision was ±0.02‰, for δ18O and 0.8‰ for δ2H. International reference materials V-SMOW-2, GISP, GRESP, SLAP, USGS-45, and USGS-46 were used for the calibration. Deuterium excess (dexc) is calculated as dexc = δ2H – 8δ18O (Dansgaard Reference Dansgaard1964). In total, 51 ice samples from composite wedges were analyzed for their stable isotope composition.
January paleotemperature reconstructions
Stable isotope ratios (δ18O and δ2H) in precipitation serve as reliable indications of winter air temperature, especially in high-latitude regions. Since ice wedges are primarily composed of snow meltwater, they may provide a winter paleoclimate record since they retain the stable isotope signature of winter precipitation for millennia. Since Prof. Vasil’chuk first proposed a regression equation (Vasil’chuk Reference Vasil’chuk1991) to calibrate the stable isotope composition of ice wedges to mean January air temperatures (TmJ) in most regions of the Russian permafrost zone, including the continental areas of Central Yakutia, stable oxygen isotope values of ice wedges have been used as a basis for mean January paleotemperature reconstructions:
 $${{\rm{T}}_{{\rm{mJ}}}} = 1.5{\delta ^{18}}{{\rm{O}}_{{\rm{iw}}}}\left( { \pm {\rm{ }}3^\circ {\rm{C}}} \right)$$
where TmJ and δ18Oiw are mean January air temperature and δ18O values in modern ice veinlets, respectively. This equation (with an acceptable error of ±3°C but no intercept) was obtained after analyzing mean January air temperatures for over 250 weather stations in Russian permafrost regions and stable oxygen isotope values for modern ice veinlets (not older than 60–100 years). It took into account the variations in January’s temperature values (Vasil’chuk and Surkova Reference Vasil’chuk and Surkova2020).
The slope of the Local meteoric water lines (LMWL) for the precipitation of the cold season in the Central Yakutia is close to 8 (Kurita et al. Reference Kurita, Sugimoto, Fujii, Fukazawa, Makarov, Watanabe, Ichiyanagi, Numaguti and Yoshida2005; Papina et al. Reference Papina, Malygina, Eirikh, Galanin and Zheleznyak2017), i.e., close to that of the global meteoric water line—GMWL (Craig Reference Craig1961).
Results
Direct AMS 14C dating of thin sand-ice wedges in the Upper Sand unit
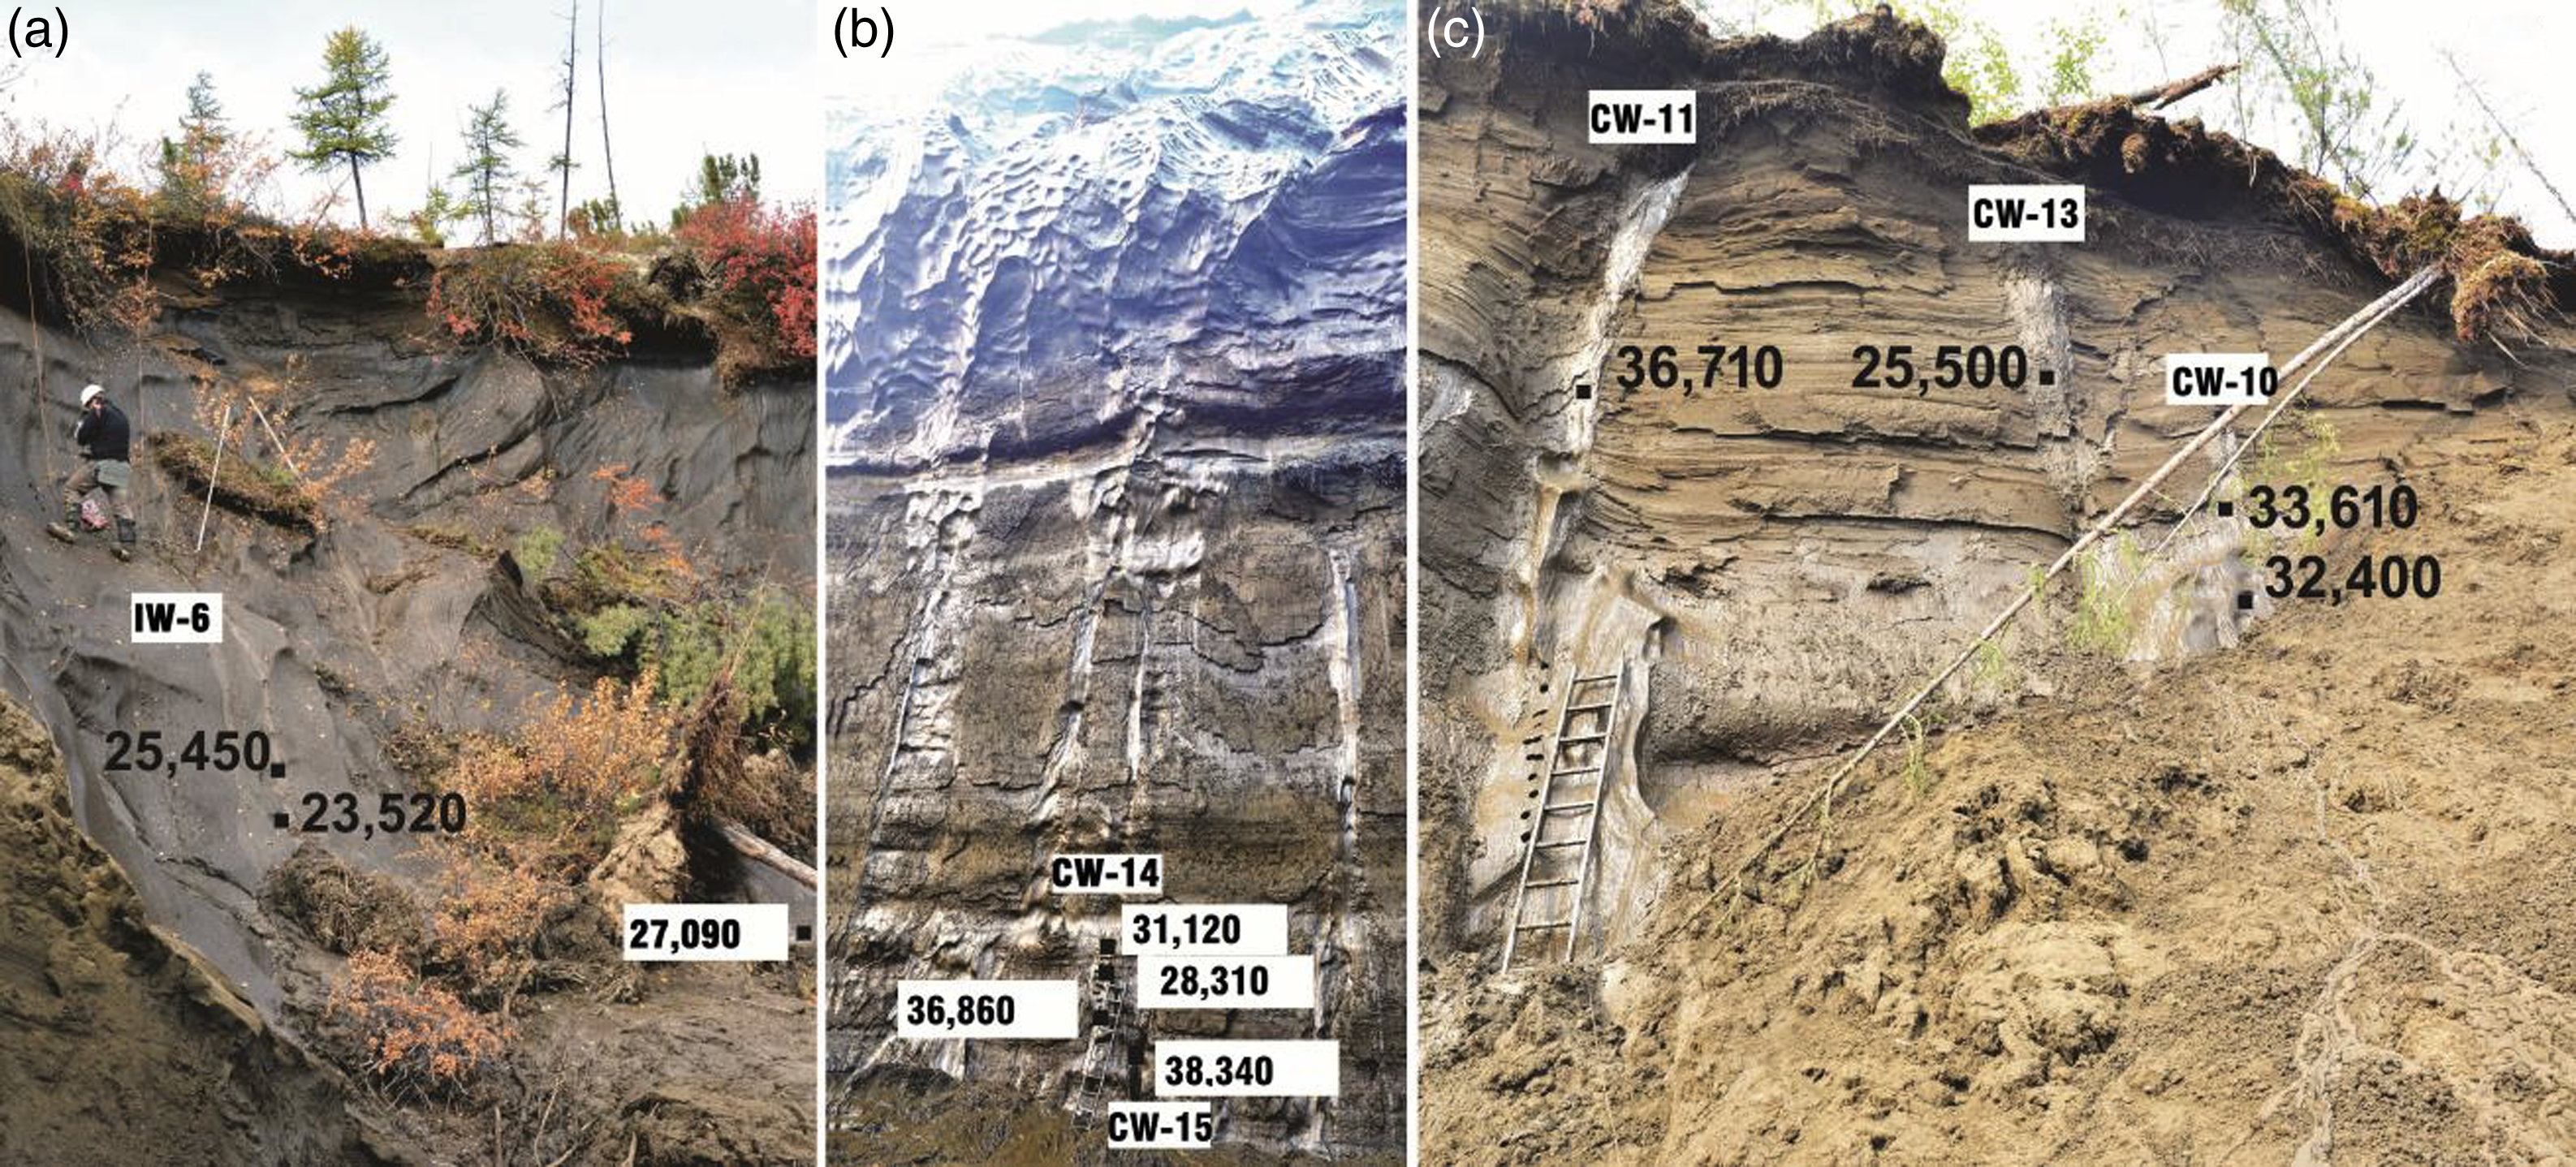
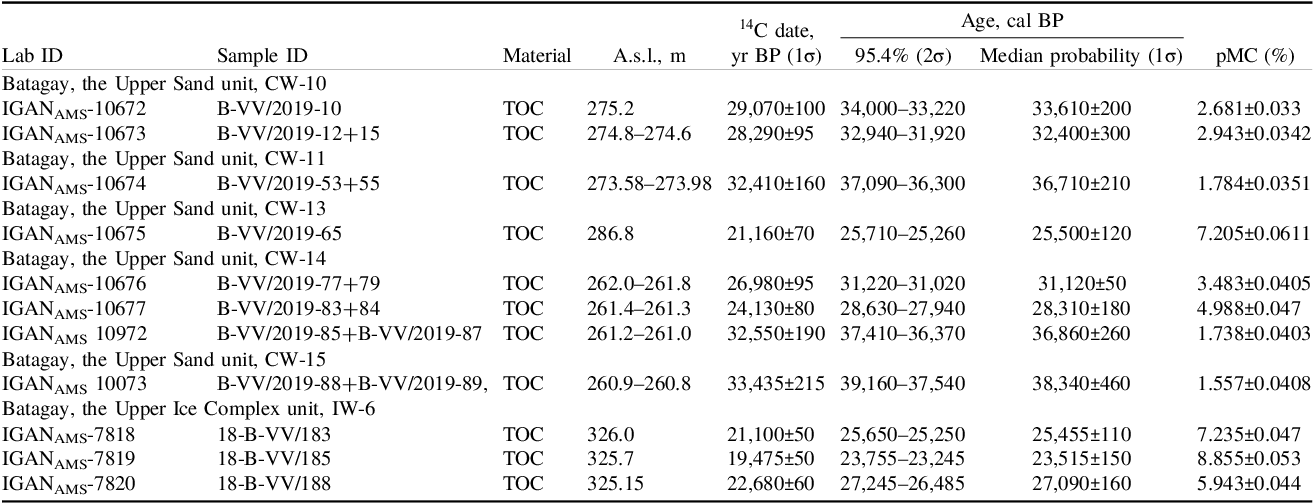
Eight samples from four sand-ice wedges (Figure 4) were dated to establish an age of composite wedges for a section of the Upper Sand unit. Finite radiocarbon dates have been obtained for all samples submitted for AMS dating. Based on CW-14, located at the lowest point—about 261 m above sea level (a.s.l.), two 14C data with inversion were obtained: 28,310 cal BP below and 31,120 cal BP in an ice sample located 0.5–1 m higher in the same sand-ice wedges (Figure 4b). The inversion of 14C ages between samples from 31,12 and 28,31 m a.s.l. (Figure 4b) might relate to reworking material of the upper sample (which dated to a more ancient age) and also with variations of frost cracking depth. The formation conditions of ice wedges and composite wedges are not constant, and the participation of reworked material is largely varied. The oldest 14C date 38,340 cal BP is obtained for lower part of CW-15 (Table 1).
Radiocarbon dating of microinclusions of organic material extracted directly from composite wedges (CW) and ice wedges in the Upper Sand unit and the Upper Ice complex unit of the Batagay section: (a) upper part of the Upper Ice complex, ice wedge (IW) sampling from IW-6; (b) southern part of the Upper Sand outcrop, sampling from CW-14; (c) northern part of the Upper Sand outcrop, sampling from CW-11 (left sand-ice wedge), CW-13 (central sand-ice wedge), and CW-10 (right sand-ice wedge).

Radiocarbon dating of organic material extracted directly from ice wedges in the Upper Sand and the Upper Ice Complex units

Composite sand-ice wedges CW-11, CW-12, CW-13, and CW-10 were sampled 100–150 m north of CW-14 and CW-15. In CW-11, 14C data 36.7 cal ka BP obtained at 273.6 m a.s.l. In CW-13, 14C data 25.5 cal ka BP obtained at 286.8 m a.s.l. (Figure 4c)
Direct AMS 14C dating of ice wedges in upper part of the Upper Ice complex unit
Three ice samples from the IW-6 (Figure 4a) were dated to establish the age of the finishing formation upper part of the Upper Ice complex and for comparison with the 14C dates of composite wedges of the Upper Sand. The lower part of the IW-6 is dated from 27,090 to 23,520 cal BP about 325.15-325 m a.s.l. This ice wedge is the youngest and the 14C dates may indicate completion of ice wedge formation. Composite wedges accumulated in parallel with ice wedges of the Upper Ice Complex.
Oxygen and deuterium composition of thin sand-ice wedges in the Upper Sand unit
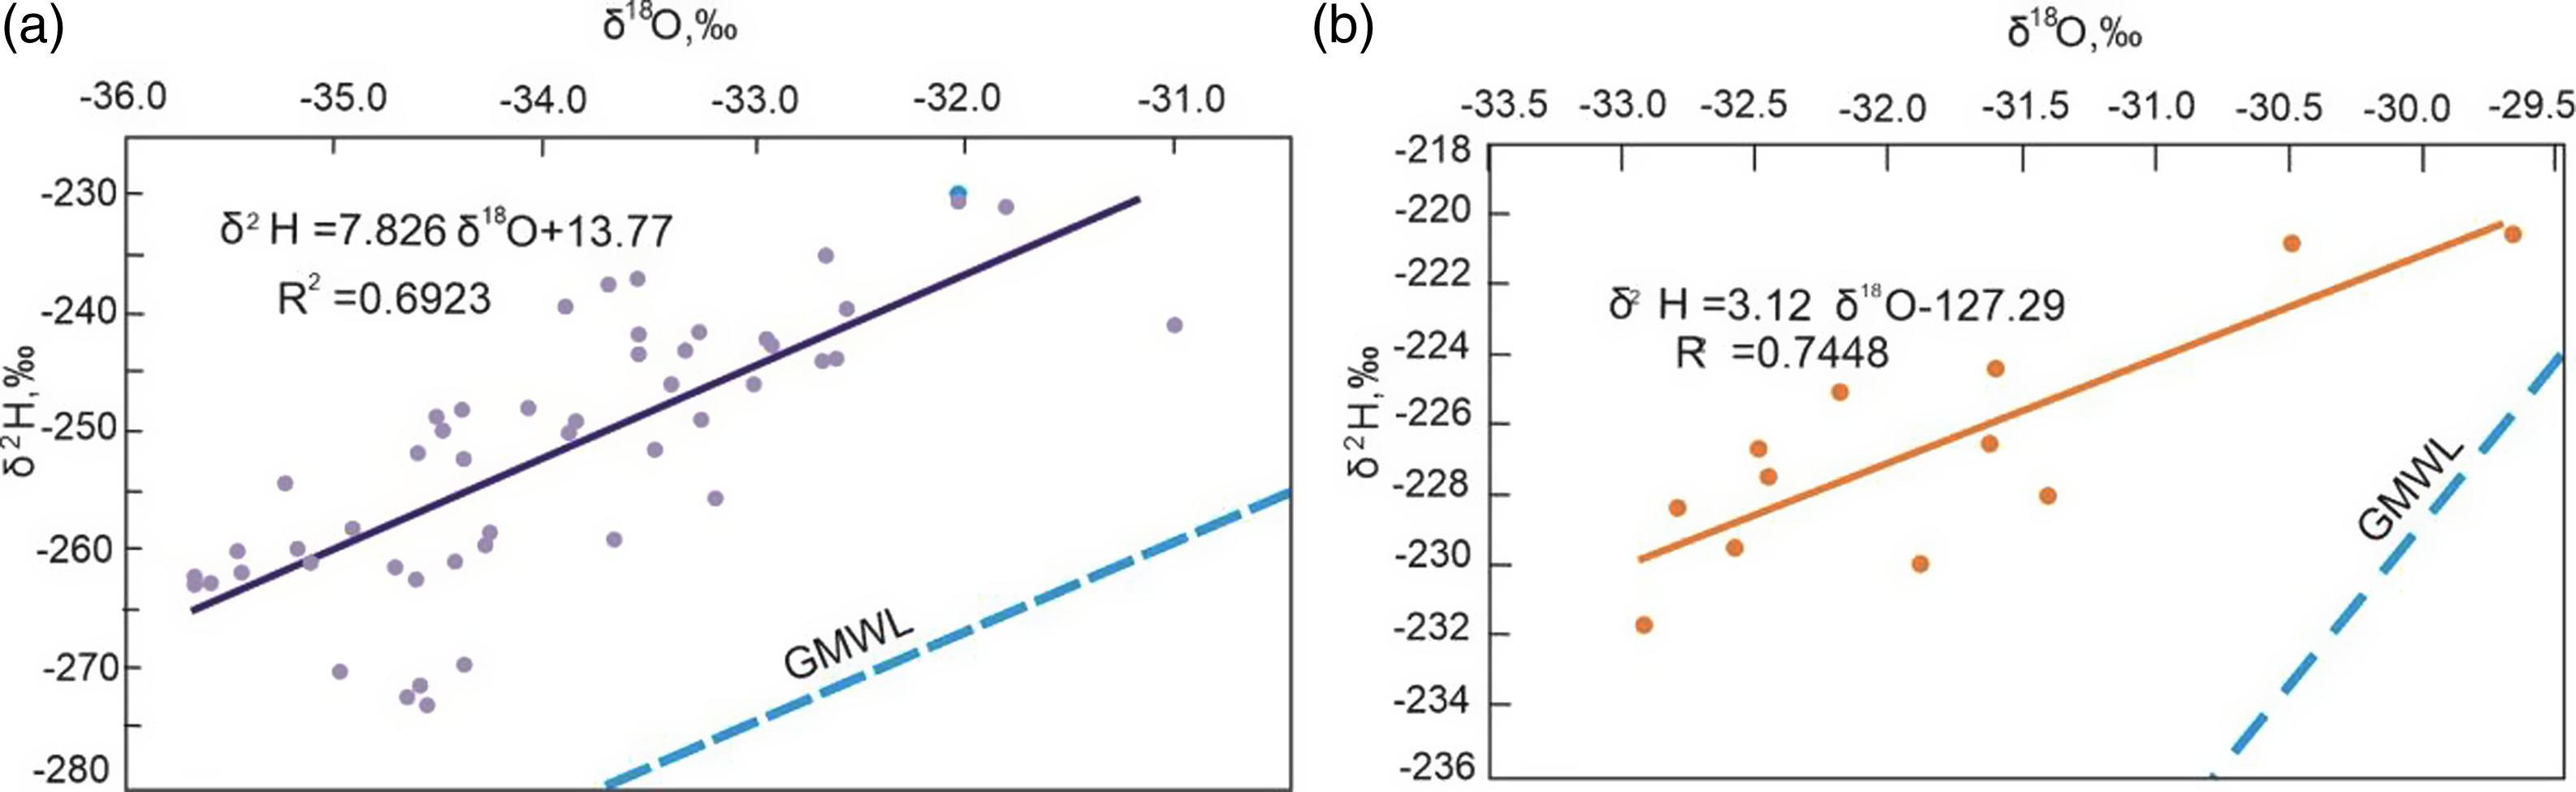
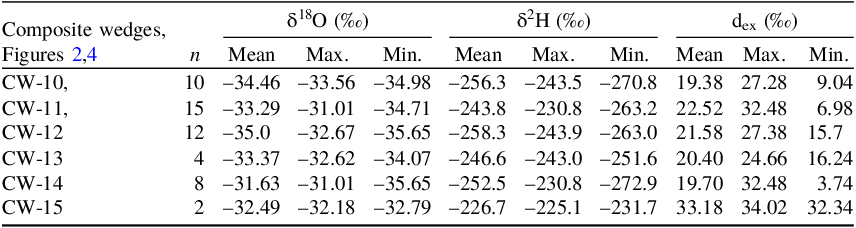
We obtained the δ18O and δ2H values of 51 samples from six composite wedges using two different instruments, the Delta V (some part of sample set, the samples with high content of sand only) and the Picarro (the entire sample set), to make sure we could trust the results. This was done because the isotopic results from the composite wedges are very different from the isotopic composition of the ice wedges in the Batagay. Here we presented results of a Picarro L 2130-i measurements (Figure 5, Table 2). The difference between the measurements on these devices was not more than 1 ‰ for the δ18O and not more than 10‰ for δ2H values, the values change consistently.
Co-isotope δ2H-δ18O plot of the Batagay composite wedges: (a) CW-10, CW-11, CW-12, CW-13; (b) CW-14, CW-15.

Descriptive statistic of isotope composition of composite wedges

The CW-14 and CW-15 occurred in the inset of the Upper Sand into the Upper Ice Complex and are characterized by enriched isotopic composition (Table 2, Figure 5 B) in comparison with those in the ice wedges of the Upper Ice Complex (Opel et al. Reference Opel, Murton, Wetterich, Meyer, Ashastina and Günther2019; Vasil’chuk et al. Reference Vasil’chuk, Vasil’chuk, Budantseva and Vasil’chuk2023). The mean values are –31.6 to –32.5‰ for δ18O and –225.1 to –226.7‰ for δ2H and 28.68‰ for dex. The secondary fractionation processes appeared to be very significant here. The corresponding regression equation is δ2H =3.12 δ18O= –127.29, R2=0.745. The wedges CW-10, CW-11, CW-12, and CW-13 have more depleted isotopic composition (Table 2, Figure 5A). The mean values are –34.0‰ for δ18O and –252.5‰ for δ2H and 19.7‰ for dexc. The corresponding regression equation is δ2H =7.83 δ18O+13.77, R2=0.692. The contrasting δ2H and dexc values indicate substantial secondary fractionation processes during composite wedges formation. Secondary isotopic fractionation refers to a change in the isotopic composition of water that occurs after its initial formation. This can happen through processes such as meteoric precipitation or melting of surface snow. Additionally, factors such as sublimation, intra-snow filtration, and water vapor diffusion can contribute to alterations in isotopic composition, leading to differences from the original snow precipitation. This process can occur in the active layer of a polygonal massif and is influenced by various factors, such as evaporation, condensation, and the partial filtration of meltwater from the seasonal melt layer.
The mean δ18O values of entire set (–34.02‰, Table 2) of these composite wedges are similar to those obtained for ice wedges of Upper Ice Complex (–34.4‰, Vasil’chuk et al. Reference Vasil’chuk, Vasil’chuk, Budantseva and Vasil’chuk2023), but δ2H and dexc values are differ in IW (–266 ‰, 8.6‰, respectively).
The stable-isotope composition of the composite wedges differs between individual sections of the Upper Sand unit such as in the inset and where the Upper Sand lie directly under the Cover Layer (Table 2, Figure 5). Ice wedge B17-IW4 on the south downslope (Opel et al. Reference Opel, Murton, Wetterich, Meyer, Ashastina and Günther2019) exhibits a more enriched stable isotope composition (mean values –29.9‰ for δ18O, –227.8‰ for δ2H, and 11.6 ‰ for dexc (n = 6). The co-isotopic regression equation is δ2H = 15.03δ18O + 222.01 (R2 = 0.91).
Discussion
In the Upper Ice Complex (yedoma) and the Upper Sand, the ice wedges have a distinct and uncommon morphology. They appear as long, band-like structures with narrow widths. An essential concern is to ascertain the extent to which this water-sand mixture infiltrates the frost-cracks in the Upper Sand. The works of Shumsky (Reference Shumsky1952, Reference Shumsky1960), Katasonov (Reference Katasonov1954), Vtyurin (Reference Vtyurin1955), and demonstrated that frost cracks can extend deep in the northern parts of Central Yakutia. Continuous elementary veins in the ice wedges with a length of 5–7 m were traced by Shumsky (Reference Shumsky1952, Reference Shumsky1960). Frost-cracking commonly occurs at a depth of 5–7 m and seldom surpasses this level. Water filling primarily occurs in the upper third of the cracks, while contractional cracks in the lower part of the frozen thickness disappear swiftly. Cracks that are open on the surface and have a width of up to 5–10 cm (according to our field observations) endure compression down to 0.5 cm when they are at a depth greater than 3 m. Meltwater that gets into cracks at a shallow level forms a plug that keeps water from getting into frozen soil or an ice wedge that has already formed. The depth of cracking at 5–7 m contributed to the formation of long and narrow wedges. Here we are discussing the possibility of deep penetration of both ancient and contemporaneous organic matter to different depths. Of course, periods of dry winters with negligible snow cover played an essential role in the formation of composite wedges. It is likely that the depth of frost-cracking during extra-cold winters in the Batagay region in the Late Pleistocene was much higher than was assumed for most of the yedoma sequences. This observation suggests a rapid accumulation of ice wedges and likely indicates the presence of unusually deep frost cracks, allowing for the penetration of ice and sand to depths potentially exceeding 5–7 m (whereas usually this depth rarely exceeds 2–3 m).
The Upper Sands’ composite wedges’ key stratigraphic and geochronological issues in the northwestern downslope are (1) the period of their formation compared to the Upper Ice Complex and (2) the time of the beginning and completion of their accumulation. Both questions can be answered hypothetically for now, but these answers may help us reach clearer conclusions. When considering the stratigraphic position of the Upper Ice Complex and the Upper Sand units in the studied site, it is important to consider certain stratigraphic indicators: (1) At the contact between the Upper Ice Complex and the Upper Sand (Figure 4b), the yedoma layer overlaps the Upper Sand unit with a thickness of 4–5 m and underlies Upper Sand inset. This suggests that the Upper Sand was deposited during the formation of the Upper Ice Complex in the northwestern part of the megaslump. (2) The Upper Sand unit exhibits horizontal sand layering with no signs of disruption in the inset. This suggests that the Upper Sand unit accumulated sequentially. (3) The Upper Sand unit contains thin, elongated composite wedges. This suggests that the sand accumulated at an extremely high rate, and any slowdown periods are fixed as shoulders of composite wedges. The section of the Upper Sand of northwest Batagay differs even from these slightly sandy the Upper Ice Complex strata, first of all, in that the ice wedges here, although very narrow, are continuous in height and cut through almost the entire 20-m thickness of the Upper Sand, which undoubtedly indicates the very rapid accumulation of ice wedges and, most likely, unusually deep frost cracks, the penetration of ice and sand through them to a depth that may have noticeably exceeded 5–7 m. The presence of shoulders for CW-10, CW-11, CW-12 and CW-13 in the Upper Sand indicates short periods of surface stabilization during accumulation of sand sheet. (4) In some cases, ice wedges in the Upper Ice Complex directly overlying the Upper Sand penetrate into narrow composite wedges syngenetic to the Upper Sand. However, there are also ice wedges in the Upper Ice Complex that form their own network, unrelated to the Upper Sand itself. These structural features indicate a likely synchronous formation of the Upper Sand and the upper part of the Upper Ice Complex, with the Upper Ice Complex continuing to accumulate for some time after the Upper Sand’s accumulation was complete. It may be supposed that intensive slope wash processes and the formation of ephemeral ponds led to composite wedge growth at the damp locations in northwestern Batagay.
Composite sand-ice wedges in Siberian outcrops
The occurrence and formation of composite wedges
Composite wedges are not a unique permafrost phenomenon, but they are fairly rare. The formation of syngenetic ice wedges and composite wedges in sandy deposits differs significantly from the formation of wedges in sandy-loam deposits. Ice wedges in sandy yedoma are found 10–15 times less frequently than in typical sandy-loam or loam deposits. Sandy yedoma often contains multitiered ice wedges and composite wedges. Among the sandy yedoma in Siberia, the Sasyr outcrop has a height of over 30 m, featuring three vertical tiers of ice wedges on Dzhangylyakh Island. Similarly, Mys Khaya, located north of the Chekanovsky Ridge (Lena Delta), has a height of over 25 m, featuring two vertical tiers (cycles) of ice wedges on Hardang Island, Aryn channel (Schirrmeister et al. Reference Schirrmeister, Grosse, Schwamborn, Andreev and Meyer2003). The southern coastline of Bolshoy Lyakhovsky Island revealed several tiers of composite and ice wedges (Schirrmeister et al. Reference Schirrmeister, Fuchs, Opel, Andreev, Kienast, Schneider, Nazarova and Frolova2025). This sequence is unique because ice wedges and composite wedges created a single polygonal structure with horizontal and vertical transitions from ice wedges to composite wedges (Dereviagin et al. Reference Dereviagin, Kunitsky and Meyer2007). Because sand typically accumulates more rapidly, the ice and composite wedges grow vertically at a faster rate. It was shown by monitoring the sand wedge sites that bare to poorly vegetated areas with sandy soils promote favourable conditions to cracking (Wolfe et al. Reference Wolfe, Morse, Neudorf, Kokelj, Lian and O‘Neill2018). This often leads to the formation of well-defined tiering in sandy soils (Vasil’chuk et al. Reference Vasil’chuk, Vasil’chuk, Budantseva, Vasil’chuk and Trishin2017). Sandy sheets with ice or composite wedges facially substituting into the yedoma are sometimes found. We describe the cyclic occurrence of ice wedges in the sandy sheet, a facies that has replaced the yedoma deposits of the Ledovy Obryv, situated on the left bank of the Main River in Chukotka. Three tiers of ice wedges, each 3–4 m high, occurred in the sandy bed (Vasil’chuk and Vasil’chuk 2019). Among the sandy yedoma with composite ice wedges, the following are also known in Siberia: Mamontov Klyk Cape, Kotelny Island, Bunge Earth Island, Stolbovoy Island, and Bolshoy Lyakhovskiy Island (Dereviagin et al. Reference Dereviagin, Kunitsky and Meyer2007). In the Mamontov Klyk sequence, Dereviagin et al. (Reference Dereviagin, Kunitsky and Meyer2007) traced the peculiar flow patterns, which were well observed in the horizontal and vertical sections of the composite wedges, indicated not only the aeolian, but also the water filling of frost cracks. It is important for understanding composite and ice wedges growth in the Upper Sand under influence of slope processes. Meadow–steppe vegetation with exposed ground and scattered larch stands with ephemeral ponds was typical for this unit with narrow composite wedges (Murton et al. Reference Murton, Opel, Wetterich, Ashastina, Savvinov, Danilov and Boeskorov2023). So, the pond water might have penetrated into frost cracks located downslope in early spring and interfered with the isotopic composition of wedge ice. We also do not exclude the possible effect of ablation of the initial snow on the isotopic composition of composite wedges, but in this case this effect extends to the ice wedges too. An essential concern is to ascertain the extent to which this water-sand mixture infiltrates the frost-cracks in the Upper Sand. Frost-cracking commonly occurs at a depth of 5–7 m and seldom surpasses this level. Water filling primarily occurs in the upper third of the cracks, while contractional cracks in the lower part of the frozen thickness disappear swiftly. Cracks that are open on the surface and have a width of up to 5–10 cm endure compression down to 0.5 cm when they are at a depth greater than 3 m.
The age of the composite wedges
Composite wedges have been described in the fluvial sand sheet at Mamontov Klyk Cape (Dereviagin et al. Reference Dereviagin, Kunitsky and Meyer2007). The age of the upper half of the sand deposits, according to two IRSL (infrared stimulated luminescence) dates, is 35.1 and 56.2 ka BP (Magens et al. Reference Magens, Meyer, Schirrmeister, Derevyagin and Hubberten2005). The 14C ages of plant remains and moss in the sediments of the ice complex overlying the sands with composite wedges in the Kotelny island are 45,960 + 2460/–1880 BP (KIA-25,741) and 52,790 + 4110/–2710 BP (KIA-25743). Composite wedges studied in Ulakhan Sular Formation belong to MIS 6 (Murton et al. Reference Murton, Opel, Toms, Wood, Boxleitner, Savvinov, Danilov, Boeskorov, Goslar, Rogersh, Lupachev and Tikhonravova2025). Most of studied composite wedges are dated by 45–52 ka BP or older and their locations near the sea, and rivers, or on the islands. Batagay composite wedges in the Upper Sand unite is unusual because their slope location.
Isotope data of the composite wedges
The two composite wedges studied in Ulakhan Sular Formation show very similar δ18O values of around –32‰, but their δ2H values differ essentially (around –235 and –258‰), resulting to contrasting dexc values (around –2 and 18‰). The researchers correlated these sand-sheet deposits with the Lower Sand unit of the Batagay megaslump, which contains narrow, chimney-like sand and composite wedges and provides luminescence ages that overlap in MIS 6 (Murton et al. 2025). A transition from ice wedge to composite wedge in a single wedge has been discovered at Mamontov Klyk Cape. The δ18O values in the composite wedges range from –27.2‰ to –32.0‰, and δ2H values from –250.8‰ to –213.7‰ (Dereviagin et al. Reference Dereviagin, Kunitsky and Meyer2007). The isotopic composition of ice-wedge ice in this outcrop is significantly more contrasted, ranging from –34.9‰ to –28.4‰ for δ18O values and –272.2‰ to –222.6‰ values for δ2H values, dexc values vary from 7.1‰ to 10.2‰. The transition from sandy ice to wedge ice produced negligible increasing of δ18O values by an average of 0.7–0.8‰. The mean δ18O values change from –30.9‰ for composite wedges to –28.5‰ for overlapping ice wedges. The researchers have reached an important conclusion that the example above shows that the temperature fluctuations recorded in the isotopic composition of ice wedges and composite wedges are not a determining factor for the formation of a particular type of wedge, that changes in the facial environment do not affect the isotopic compositions of composite wedges and ice wedges (Dereviagin et al. Reference Dereviagin, Kunitsky and Meyer2007). This is consistent with the previously obtained conclusion that the formation of various types of wedges is determined mainly by the composition of soils and their moisture content in the active layer (Black and Berg Reference Black and Berg1964). Very important for understanding of composite wedges phenomenon are the recent composite wedges described on Bunge Land Island (Dereviagin et al. Reference Dereviagin, Kunitsky and Meyer2007). The composite wedges formed during dry winter conditions with only a small meltwater supply. The isotopic characteristic of the composite wedges is slightly different, with the highest values from –16.1‰ to –20.2‰ for δ18O values, from –158.3‰ to –208.4‰ for δ2H values.
The dexc value varies widely in composite wedges. The dexc values in Cape Mamontov Klyk range from 1.6 to 9.0, on Kotelny Island from 1.5 to 8.0‰, on Bunge Land from –1.1 to 3.5‰, on Stolbovoy Island from 2.9 to 3.5‰, and on Bolshoy Lyakhovsky Island from –1.0 to 24.6‰ (Dereviagin et al. Reference Dereviagin, Kunitsky and Meyer2007), in Ulahan Sular from –2 to 18‰ (Murton et al. 2025). Only the dexc values of composite wedges on Bolshoy Lyakhovsky Island and Ulahan Sular are closed to those of the Upper Sand, in both locations there were extremal formation conditions. For individual composite wedges on Bolshoy Lyakhovsky Island, the maximum dexc values were 19–24‰, and the average values were 16–18‰. For the Upper Sand the values of dexc are even higher (average 18–29‰), and, consequently, the fractionation processes were even more intense.
Radiocarbon age of thin composite wedges in the Upper Sand unit
Important issues in the history of the formation of the Upper Sand are the time of the beginning and completion of accumulation, as well as the chronology of accumulation.
The beginning of the Upper Sand accumulation and composite wedges formation
A dated foal corpse found hanging in the zone of lower contact of the Upper Sand and the enclosing yedoma (Upper Ice Complex) is the most important reference point for the Upper Sand accumulation. Cheprasov and colleagues (2021) explained this find’s taphonomic properties. Murton and co-authors (2023) provide a snapshot of the foal’s discovery. The preserved blood, bay foal, and black mane demonstrate the exquisite maintenance of the male foal’s carcass. This implies that fluvial or gravitational processes did not move the foal, as it froze immediately after entering a surface crack. But at the same time, the nature of the burial, as well as the well-preserved tissues and blood, indicate that the foal’s death is associated with quick possibly catastrophic slope processes, which possibly in turn triggered the formation of Upper Sand. The 14C age determined in the Radiocarbon Analysis Laboratory (Carbon Analysis Lab) in South Korea for foal muscle tissue is 39,850 ± 280 BP or 43,037 ± 284 cal BP (Cheprasov et al. Reference Cheprasov, Grigoriev, Novgorodov, Grigorieva, Savvinov, Tikhonov, Cheprasov, Fedorov and Novgorodov2021).
Previously, ten 14C dates were obtained from exposure of the Upper Sand in the southern slope of the slump. The lower part of the unit yielded nonfinite radiocarbon ages here. The oldest 14C date, 42,390 cal BP (AWI-1689.2.1), was obtained from Empetrum nigrum leaves, twigs, and Cyperaceae remains at the depth of 11 m, and the 14C date 41,250 cal BP (Poz-75782) was obtained from in situ fossil rootlets at the depth of 18.5 m (Murton et al. Reference Murton, Opel, Toms, Blinov and Fuchs2022). The youngest 14C date, 15,090 cal BP (Poz-79756) (Ahsastina et al. 2017), was obtained at the depth of 8.5 m, but at the depth of 2.15 m, rootlets in situ yielded 27,330 cal BP (AWI-3024.1.1), and at the depth of 2.30 m, the rootlets in situ yielded 22,470 cal BP (AWI-3025.1.1) (Murton et al. Reference Murton, Opel, Toms, Blinov and Fuchs2022). Quartz OSL ages of 40.0 ± 3.9 ka, 41.0 ± 3.9 ka, and 27.1 ± 2.1 ka, and K-feldspar pIRIR ages of 61.0 ± 3.7 ka, 50.9 ± 3.5 ka, and 45.5 ± 2.9 ka (GL17120, GL17119, and GL17118 corresponding to B17-S2-OSL5, B17-S2-OSL4, and B17-S2-OSL3, respectively) were obtained at depths of 11, 2.3, and 2.1 m below the ground surface in the Upper Sand exposed in the southern part of the slump. In our opinion, the slope character of the sediments and the different histories of individual dated fractions are reflected in this. Calábková and Chlachula (Calábková et al. Reference Calábková, Chlachula, Ivanov, Hloźková and Czerniawska2023) studied the different levels of microbial activity affecting the preservation of fossil material, the weathered metacarpus of Equus sp. found at the bottom of the crater, approximately 30 m from the modern vertical wall of the Upper Sand in the southeastern slope. The bone’s radiocarbon age is 37,800 ± 1700 BP (Poz-97053) (42,310 ± 1570 cal BP). The view of the scientists who analyzed the bone is that it originated from the Upper Sand unit (Calábková et al. Reference Calábková, Chlachula, Ivanov, Hloźková and Czerniawska2023). The 14C date does not contradict other data obtained and corresponds to the beginning of the accumulation of Upper Sand.
As to the beginning of composite wedge formation in the northwestern slope, the oldest 14C date is 38,340±460, obtained at 261 a.s.l. from the CW-15 in the “sandwich” part (Table 1). As mentioned earlier, the presence of shoulders in composite wedges 10, 11, 12, and 13 corresponds to a period of stabilization of the sedimentation surface. The oldest 14C date, 36,860 cal BP, was obtained at 273 a.s.l. from the bottom of CW-11. Under the Upper Ice Complex sediments, the composite wedges accumulated without any surface stabilization. It is evidenced by composite wedge morphology, such as the absence of shoulders. The similar morphology of composite wedges observed in the southeastern part of the slump (Opel et al. Reference Opel, Murton, Wetterich, Meyer, Ashastina and Günther2019).
It can be assumed that during this period, the formation of composite wedges began in the already accumulated Upper Sand. By assessing the complete agreement between the dates obtained from composite wedges in the Upper Sand unit (Figure 4 b and c) and from ice wedges in the upper part of the Upper Ice Complex fragment located 480 m south of the same vertical wall (Figures 1 and 4a), an estimated chronology of the Upper Sand unit cluster can be constructed. The initiation of the Upper Sand unit deposition most probably occurred over the time period of 43.0–28.3 cal ka BP without noticeable interruptions in the northwestern part. Composite wedges in the Upper Sand in the northwest part began to grow about 38.3–36.9 cal ka BP, according to 14C AMS ages.
Completion of the Upper Sand accumulation. There are currently no solid benchmarks available to accurately estimate the time it takes for the Upper Sand layer to accumulate. Nevertheless, the most recent date acquired from TOC (total organic carbon), specifically plants and soil material, found in IW-13 in the Upper Sand, can be used as a precise reference point for dating: 21,160 ± 70 BP (IGAN AMS-10675) or 25.5 cal ka BP. Also, an approximate criterion for the completion time of the formation of the Upper Sand is the 14C date 21,100±50 BP (IGAN AMS-7818) or 25.5 cal ka BP of the IW-6 ice wedge in the Upper Ice Complex, which partially overlaps the Upper Sand.
The authors believe that the radiocarbon age on the CW-13 is the most reliable; the composite wedge is located highest, and it is younger than other ice wedges; it is most likely close to the time of Upper Sand unit accumulation and the formation of narrow composite wedges. So, the formation interval of composite wedges in the Upper Sand unit is 38,340–25,500 cal BP.
Stable isotope ratio of the composite wedges from the Upper Sand unit
Opel et al. (Reference Opel, Murton, Wetterich, Meyer, Ashastina and Günther2019) have studied 2 composite wedges (B17-IW2 and IW3) and one ice wedge (B17-IW4), also within Upper Sand in the south of the slump. The stable-isotope composition of the composite wedges from the Upper Sand unit is close to the isotope composition of CW-14 and CW-15 (Table 2). The mean values are –32.8‰ and –31.9‰ for δ18O, –247.5‰ and –240.5‰ for δ2H, and 15.1‰ and 14.7‰ for dexc, respectively, and plot well above the global meteoric water line (GMWL, δ2H = 8δ18O + 10) (Craig Reference Craig1961). The corresponding regression equations are δ2H = 12.51 δ18O + 163.29 and δ2H = 14.47 δ18O + 220.91, respectively. The regression equation for the ice wedge in the Upper Sand is δ2H = 15.03 δ18O + 222.01 (Opel et al. Reference Opel, Murton, Wetterich, Meyer, Ashastina and Günther2019). The δ18O values of intrasedimental ice of the Upper Sand are similar to those of composite wedges (–30.6 for δ18O, –220.0 for δ2H); however, dexc values are much greater (mean value of 24.4‰, ranging from 18.7 to 28.2‰) (Opel et al. Reference Opel, Murton, Wetterich, Meyer, Ashastina and Günther2019, 1451).
The divergence from the Global Meteoric Water Line (GMWL) and the significant variability in dexc (mean value 19.1‰) are attributed to kinetic fractionation mechanisms during spring evaporation of meltwater on the slopes. We suppose that the larger the amount of sand in a composite wedge, the higher the value of the deuterium excess, due to the greater content of ice similar to the intrasedimental. Our assumption is that sand of aeolian origin enters the cracks along with meltwater, which forms as a result of snow melting in the upper part of the slope. Solifluction flows flew from the top to the bottom to fill the cracks downslope.
It is likely that this water derives from evaporated little ponds and the active layer. Kurita et al. (Reference Kurita, Sugimoto, Fujii, Fukazawa, Makarov, Watanabe, Ichiyanagi, Numaguti and Yoshida2005) demonstrate that the isotopic composition of precipitation in Siberia is significantly affected by the recycling of continental water. Low R2 values and a significant deviation from GWML obtained from our data are associated with the formation of sand and ice on the slope. Each composite wedge had its own unique isotopic composition due to the uneven evaporation of meltwater, the uneven movement of solifluction flows, and the uneven filling of frost cracks with sand and meltwater. On the steeper slopes, landslides and solifluction processes escalate in the early spring when cracks fill with thawed snow water. This process caused sand and snow water to seep into the cracks. Such crack filling—with sand as well as water—did not happen annually but rather quite frequently.
Both a cold, excessively dry winter climate, in which primarily ground veins are forming, and the saturation of spring meltwater with soil can contribute to the formation of these wedges. In our scenario, the second aspect largely drives the growth of composite wedges in the Upper Sand.
However, the section of the Upper Sand of Batagay differs even from these sandy Upper Ice Complex strata, first of all, in that the ice wedges here, although very narrow, are continuous in height and cut through almost the entire 20-m thickness of the Upper Sand, which undoubtedly indicates the very rapid accumulation of ice wedges and, most likely, unusually deep frost cracks, the penetration of ice and sand through them to a depth that may have noticeably exceeded 5–7 m (whereas usually this depth rarely exceeds 2–3 m). Opel and his coauthors (2019) came to the same conclusions by studying the Upper Sand at the southeastern slope.
Average January (tmj) paleotemperature of sand-wedge formation
As it was shown by Dereviagin et al. (Reference Dereviagin, Kunitsky and Meyer2007), the isotopic composition of the composite wedges is very close to ice wedges, which indicates the genetic similarity of their water supply source. Characteristics of isotopic composition in the composite wedges confirm the existing ideas about the dry and cold climatic conditions of the period of their formation. In our CW dataset, only the δ18O values are similar to those of IW, while δ2H and dexc are substantially lower and higher, respectively. Therefore, the isotopic composition is not really similar due to differences in facial conditions.
When reconstructing paleotemperature, keep in mind that the coefficient for the values δ18Oiw during the reconstruction of TmJ corresponds to the coefficient 1.5 in the equation if snowmelt water comes into cracks only (1). This is because water of other origin, for example, temporary streams and/or solifluction flows, may penetrate the cracks along with melted snow water as it was shown by Dereviagin et al. (Reference Dereviagin, Kunitsky and Meyer2007). Therefore, paleotemperature reconstructions based on the isotopic composition of composite wedges are much less reliable, and there should be a higher error for the reconstructed values (Vasil’chuk et al. Reference Vasil’chuk, Budantseva, Surkova and Chizhova2021). However, because the composite wedges originated at the same time as the Upper Ice Complex’s ice wedges, paleotemperature reconstructions of yedoma ice wedges are appropriate. Thus, the January temperature remained constant; only the facies conditions and water sources in the frost cracks altered. According to paleotemperature reconstruction (Vasil’chuk et al. Reference Vasil’chuk, Vasil’chuk, Budantseva and Vasil’chuk2023, Reference Vasil’chuk, Vasil’chuk, Budantseva, Vasil’chuk and Ginzburg2024), during accumulation of the composite wedges in the Upper Sand mean January air temperature varied from –47 to –54°C.
Conclusions
1. The Upper Sand unit most likely formed synchronously with the upper part of the Upper Ice Complex during MIS-3-2 in the northwestern slope of the Batagay megaslump.
2. The accumulation of composite wedges began no later than 38.3 cal ka BP and ended no earlier than 25.5 cal ka BP.
3. During the formation of composite wedges in the Upper Sand of the northwestern part, frost cracks penetrated to a depth of 5–7 m, exceeding the average value for the yedoma of 3–4 m.
4. Two groups of composite wedges of different isotopic composition are marked in the Upper Sand unit at the northwestern slope of the megaslump. Composite wedges in “sandwich” inset are characterized by an enriched isotopic composition compared to the ice wedges of the Upper Ice Complex; composite wedges with depleted isotopic composition close to that in the ice wedges of the Upper Ice Complex occurred under the Cover Layer.
5. The composite wedges in the Upper Sand accumulated at January temperatures from –47 to –54°C, as indicated by the paleotemperature reconstruction of the isotope composition of the ice wedges of the Upper Ice Complex.
Conflict of interest statement
The authors state that they have no conflicts of interest.
Acknowledgments
The research was financially supported by the Russian Science Foundation (grant No. 23-17-00082, field study, radiocarbon dating). The study of the water isotope composition was carried out at the Center for X-Ray Diffraction Research of the Science Park of St. Petersburg State University within project 125021702335-5. We would like to express our gratitude to Andrey Trishin, Alexander Ginzburg and Helen Slyshkina, our field assistant, and also to Dr. Elya Zazovskaya for her help with radiocarbon analyses. We thank the reviewer Dr. T. Opel for their careful reading of the manuscript and heir constructive remarks. The manuscript benefited from feedback that provided specific, clear, and actionable recommendations by Associate Editor Dr. Yaroslav Kuzmin, and Managing Editor Kimberley Elliott.