1. Introduction
The phenomenon of bubble dynamics is prevalent in many fields of hydrodynamics, such as the metre-scale gas bubbles induced by underwater explosions (Cole Reference Cole1948; Menon & Lal Reference Menon and Lal1998; Zhang, Yao & Feng Reference Zhang, Yao and Feng2009), the millimetre-scale cavitation bubbles that cause cavitation erosion to vessels, hydraulic machinery (Obreschkow et al. Reference Obreschkow, Tinguely, Dorsaz, Kobel, De Bosset and Farhat2011) and high-speed flood discharge structures (Peterka Reference Peterka1953) and the submillimetre-scale cavitation bubbles induced by ultrasonic waves in medicine (Chen et al. Reference Chen, Kreider, Brayman, Bailey and Matula2011), the chemical industry production that accelerates chemical reaction (Suslick, Mdleleni & Ries Reference Suslick, Mdleleni and Ries1997).
Many scholars have carried out in-depth studies on the collapse of cavitation bubbles and the interaction between a cavitation bubble and a wall surface since the cavitation phenomenon was found. Rayleigh (Reference Rayleigh1917) analysed an isolated spherical cavitation bubble in an incompressible liquid and established a corresponding mathematical equation of cavitation bubble dynamics. Benjamin & Ellis (Reference Benjamin and Ellis1966), who were the first to conduct experimental studies on the interaction between a cavitation bubble and a wall surface, found that the collapse of the cavitation bubble near the wall surface showed an extremely complex phenomenon of asymmetric collapse. Plesset & Chapman (Reference Plesset and Chapman1971) are pioneers who conducted theoretical studies on the interaction between a cavitation bubble and a wall surface. Tomita & Shima (Reference Tomita and Shima1986) clarified the impact pressure generated by the collapse of a single cavitation bubble in still water by means of experiment, which laid a foundation for the interpretation of the mechanism of cavitation erosion. Blake & Gibson (Reference Blake and Gibson1987) studied the jet from the collapse of a cavitation bubble by means of experimental numerical simulation, and pointed out the importance of the Kelvin impulse in the study of the jet. As for the impact of the jet on the wall surface, according to current studies, it is found that, when the distance between the cavitation bubble and the wall surface is twice the radius of the bubble, the jet can impact on the wall surface and that, when the distance between the cavitation bubble and the wall surface is bigger than five times the radius of the bubble, the collapse of the cavitation bubble can generate a jet that is able to penetrate the cavitation bubble (Ohl, Lindau & Lauterborn Reference Ohl, Lindau and Lauterborn1998; Blake et al. Reference Blake, Keen, Tong and Wilson1999). Tong et al. (Reference Tong, Schiffers, Shaw, Blake and Emmony1999), with the laser-induced cavitation bubble method, studied the impact of the collapse of a cavitation bubble on a wall surface when the distance between the cavitation bubble and the wall surface is in the range 0.8–1.2. Lindau & Lauterborn (Reference Lindau and Lauterborn2003) adopted a high-speed photographic system whose frame rate reaches 100 000 000 frame per second (f.p.s.) when studying the collapse of the cavitation bubble near the wall surface and found that the annular shape of the cavitation bubble, the formation of the reflected flow and the evolution of the shock wave during the collapse of the cavitation bubble are all directly related to the jet. Gong et al. (Reference Gong, Ohl, Klaseboer and Khoo2010) researched into the scale effect of the cavitation bubble and established the characteristic length scale and time scale of cavitation bubbles induced in different ways. Cavitation bubbles were observed in microgravity, normal gravity and hyper-gravity, where a gravity-driven jet appears (Obreschkow et al. Reference Obreschkow, Tinguely, Dorsaz, Kobel, De Bosset and Farhat2013). Supponen et al. (Reference Supponen, Kobel, Obreschkow and Farhat2015) induced a cavitation bubble by use of a laser and observed, with a high-speed camera, the detailed structure and evolution of a jet in the cavitation bubble during the collapse of the cavitation bubble. Supponen et al. (Reference Supponen, Obreschkow, Tinguely, Kobel, Dorsaz and Farhat2016) carried out a unified study on the jet of a cavitation bubble near various boundaries and established an anisotropy parameter to divide the jets into weak jets, intermediate jets and strong jets; the scaling law of such jets is conducive to unifying the research on the mechanism of cavitation in different scenarios of application. Reuter et al. (Reference Reuter, Gonzalez-Avila, Mettin and Ohl2017) measured the unsteady flow field induced by a laser cavitation bubble, and found that the bubble standoff distance determines the sense of direction of the circulation associated with the vortex ring. This experiment illustrated the evolution of the peripheral flow field during bubble collapse in situations when the vortex is ejected from the substrate and when the vortex radially stretches over it. Cui et al. (Reference Cui, Zhang, Wang and Khoo2018) studied the feasibility of a single cavitation bubble to break ice, observed the splintering of ice, the jet of the cavitation bubble and the evolution of the shock wave and found that the splintering characteristic of ice is connected with the thickness of the ice and the distance between the ice and the bubble. Beig, Aboulhasanzadeh & Johnsen (Reference Beig, Aboulhasanzadeh and Johnsen2018) used highly resolved numerical simulations of a single bubble inertially collapsing near a rigid surface to measure the temperatures produced in the fluid, and found that the shock generated by the bubble collapse was the source of the high temperature while bubbles starting initially closer migrate towards the wall and eventually come into contact with it. Luo et al. (Reference Luo, Xu, Zhai and Zhang2019b) interpreted the influence of liquid viscosity on material erosion by conducting research on the jet of a cavitation bubble near the wall surface in solutions that were different in viscosity.
As the research on cavitation bubble dynamics went deeper, scholars gradually found that the direction of the re-entrant jet generated when the cavitation bubble near a free liquid surface collapses is completely different from that of the re-entrant jet generated when the cavitation bubble near the wall surface collapses. Chahine (Reference Chahine1977) acquired the critical condition for a free surface to make a cavitation bubble deviate from it, and found that buoyancy has no time to take effect when the bubble is repelled from the free surface during collapse. Blake & Gibson (Reference Blake and Gibson1981) simulated the expansion and collapse of a cavitation bubble near a free surface with an approximate integral-equation approach and found the effect of an accelerating liquid jet that the free liquid surface forms during the collapse of the cavitation bubble on the deformation of free liquid surface. Wang et al. (Reference Wang, Yeo, Khoo and Lam1996a) adopted the boundary-integral method to simulate the expansion and collapse of a cavitation bubble near a free surface with the effect of the buoyancy of a liquid that is not viscous or compressible, and found that the free-surface-induced Bjerknes effect decays rapidly with the inception distance between the free surface and the bubble. Moreover, Wang et al. (Reference Wang, Yeo, Khoo and Lam1996b) found three patterns of collapse of the cavitation bubble near a free surface: a downward directed Bjerknes jet for the case of a weak buoyancy force, an upward directed buoyancy jet for the case of a strong buoyancy force and, for the intermediate case with a near-null Kelvin impulse state, the bubble assumes an oblate form during collapse with no jetting. These results provided a new idea for the study of the collapse direction of a cavitation bubble under affecting air bubbles. Robinson et al. (Reference Robinson, Blake, Kodama, Shima and Tomita2001) studied the motion of single bubble and two cavitation bubbles generated by laser beams under a free surface, and found that the liquid jet directed away from the free surface, and that, when free surface–bubble interaction is strong, a fast free-surface spike is formed for both the single bubble and two bubble cases. Klaseboer, Khoo & Hung (Reference Klaseboer, Khoo and Hung2005) studied the influence of a free surface and floating structure on cavitation bubble dynamics with the boundary-integral method and found that the cavitation bubble moves towards the structure when collapsing under the effect of the free liquid surface and gravity. The above research results explain the influence of an infinite air bubble (free surface) on the direction of the re-entrant jet, which lays a foundation for the generation mechanism of a shock wave under the influence of an air bubble.
The studies above are all connected with the jet of the cavitation bubble in a free field and the cavitation bubble near a wall surface. However, during the collapse of a cavitation bubble, there is another major physical phenomenon, i.e. the shock wave. Vogel, Busch & Parlitz (Reference Vogel, Busch and Parlitz1996) induced a cavitation bubble with the laser focusing technique and found that a large percentage of the laser pulse energy (up to 72 %) is transformed into the mechanical energy, Es, and the energy of the shock wave from the cavitation bubble, Eb, of the shock wave, whereby the partitioning between Es and the Eb is approximately equal; 65%–85% of Es is dissipated during the first 10 mm of shock wave propagation. Vogel et al. (Reference Vogel1999) revealed that the ratio of the shock wave energy and the cavitation bubble energy was approximately constant (between 1.5 : 1 and 2 : 1). Sankin et al. (Reference Sankin, Simmons, Zhu and Zhong2005) researched the shock wave generated by the collapse of a laser-induced cavitation bubble and found non-spherical collapse of the bubble with secondary shock wave emission. Supponen et al. (Reference Supponen, Obreschkow, Kobel, Tinguely, Dorsaz and Farhat2017, Reference Supponen, Obreschkow, Kobel, Dorsaz and Farhat2019) observed the shock wave generated by the collapse of a single cavitation bubble and found that the non-spherical collapse of the cavitation bubble generated multiple shocks that were clearly associated with different processes. Supponen et al. (Reference Supponen, Akimura, Minami, Nakajima, Uehara, Ohtani, Kaneko, Farhat and Sato2018) showed that the jet direction is determined mainly by the secondary compression wave, which is the first and thus most energetic compression wave acting on a sufficiently grown cavitation bubble.
Moreover, it is hard to avoid a strong interaction between a cavitation bubble and its surrounding air bubble within its life cycle. Smith & Mesler (Reference Smith and Mesler1972) studied the interaction between a cavitation bubble and an air bubble through experiment and found two ways that the air bubble affects the cavitation bubble, i.e. the transmission of energy from the cavitation bubble to the air bubble and the repulsion effect of the air bubble on the cavitation bubble. Xu, Bai & Zhang (Reference Xu, Bai and Zhang2010) researched the interaction between a cavitation bubble and an air bubble near a wall surface with the underwater high-voltage discharge method and found that the collapse direction of the cavitation bubble can be affected by the air bubble or the wall surface. Pain et al. (Reference Pain, Goh, Klaseboer, Ohl, W and Cheong Khoo2012) carried out research on the interaction between a cavitation bubble and an air bubble, and found that, with the effect of the cavitation bubble, the velocity of the jet generated by the air bubble reached 250 m s−1. Luo et al. (Reference Luo, Xu, Niu, Luo and Zheng2013) observed the deformation of an air bubble with the effect of the cavitation bubble. In addition, Goh et al. (Reference Goh, Ohl, Klaseboer and Khoo2014) also found that the ratio of the oscillation time of the cavitation bubble to that of the air bubble is an important parameter in determining the direction of the jet of the cavitation bubble. Luo, Xu & Li (Reference Luo, Xu and Li2019a) measured the sound pressure difference of cavitation bubble collapse based on the air bubble nearby with high-speed photography and a high-precision underwater sonar detection system and found that the existence of the air bubble can reduce the sound pressure during the collapse of the cavitation bubble.
To analyse the influence that the air bubble has on the shock wave from the collapse of the cavitation bubble, the study in this paper adopted high-speed photographic technology to observe and analyse the characteristics of the evolution of the shock wave from the collapse of the cavitation bubble under the effect of the air bubble, and studied the change in the impact strength of the shock wave. The aim of this paper is to explore the influence mode of air bubbles on the shock wave from the collapse of the cavitation bubble and the change of the shock wave intensity of the cavitation bubble collapse under the influence of air bubbles.
2. Experimental set-up
In this study, a set of underwater low-voltage discharge equipment was designed to induce a cavitation bubble and, at the same time, high-speed photography and transient pressure testing were combined to simultaneously observe and measure the shock wave. As for the experiment on the interaction between the cavitation bubble and the air bubble, within the evolution cycle of a cavitation bubble, the size and position of the air bubbles appearing nearby must be controlled. Thus, a synchronous control unit for the cavitation bubble and air bubble was adopted to coordinate the observation system and the measurement system above.
The size and position of the cavitation bubble can be well controlled by the method of underwater low-voltage discharge (Turangan et al. Reference Turangan, Ong, Klaseboer and Khoo2006; Goh et al. Reference Goh, Oh, Klaseboer, Ohl and Khoo2013). The radius of the cavitation bubble generated with the above-mentioned method ranges from 5 to 12 mm. In order to minimize the interference of the electrode with the cavitation bubble dynamics, a copper wire with a diameter of 0.1 mm was selected as the discharge electrode (with a length of 50 mm) in the study. Compared with the size of the cavitation bubble, the diameter of the electrode is less than 1 % of the characteristic parameter of the cavitation bubble, the aforesaid wire is much smaller. The electrodes were fixed to a holder in advance and the holder to which the wire and the electrodes were fixed was placed in a water tank. In consideration of the reflex of the wall of the water tank on the shock wave and the influence of the free surface of the water body in the water tank on the shock wave, a water tank with a size of 40 cm × 30 cm × 50 cm was chosen for the experiment, in which the depth of deionized water was 45 cm. The contact point of the electrodes was located in the middle of the water tank and the experimental ambient temperature was maintained at about 22 °C.
The high-speed camera used for the study was a Fastcam SA-Z (Photron Inc, Japan, maximum acquisition rate: 1 000 000 f.p.s.). To guarantee the image resolution, micro lenses (Nikon, Micro 105/2.8G) were used with the high-speed camera. In addition, another issue arose from the high frame rate and the time of exposure that is extremely short, i.e. lack of exposure. Thus, a light source was taken as supplementary lighting in the experiment. As for the evolution of the shock wave during the collapse of the cavitation bubble, a parallel light system was adopted to transform the beam of a white LED (Power: 3W) into a beam of parallel light with a section that is a square with a side of 50 mm. During the experiment, such a beam of parallel light and the high-speed camera were set on two opposite sides of the water tank so that the beam was taken as the supplementary light source for the high-speed camera, as shown in figure 1(a). When determining whether the shock wave is stratified, the shock wave was classified according to the difference between the grey value of the front wave and the grey value behind the wave. If a shock wave is stratified by an air bubble, then the grey value of the area where the shock wave is will be significantly greater than the grey value of other areas. Due to the fast evolution of the shock wave, the requirement for the frame rate and time of exposure is extremely high. In the experiment of this study, the frame rate is 180 000 f.p.s., the resolution is 256 pixel × 256 pixel, the pixel size is approximately 0.165 mm pixel−1 and the time of exposure is 0.25 μs.
Experimental set-up and parameter definition of the system: (a) experimental set-up; (b) image of the cavitation bubble when it expanded to its maximum volume (top) and the shock wave from the collapse of cavitation bubble (bottom); (c) definition of the spatial position parameter of the cavitation bubble and the air bubble.

When choosing the way to measure the impact of the shock wave on the wall surface in this study, we must take into account characteristics such as the sensitivity of the measurement equipment and the size, response frequency and rise time of the pressure sensor. Finally, a piezoresistive pressure sensor with high sensitivity (Test Electronics Information Co. Ltd, CY400) was chosen as the pressure sensor for this study. Such a pressure sensor has a frequency bandwidth of 200 kHz and the corresponding rise time is 1.0 μs; the induction surface of such a pressure sensor is a circle whose radius is 1.50 mm. Through repeated testing, we found the maximum range, i.e. 15 MPa, that is suitable for the cavitation bubble scale studied in this paper, and the measurement accuracy is 0.5 % of the maximum range and the sampling frequency is 2 MHz. Before the experiment, the pressure sensor was installed on the interior wall surface and the induction surface of the sensor was kept flush with the wall surface. During the experiment, the contact point of the wire and the induction surface centre of the sensor were kept at the same level (as shown in figure 1c).
A synchronous experimental system that can control the horizontal position of an air bubble is necessary. The air bubble was generated by injecting a fixed amount of air with an air injection pump into the water body. The equipment is connected to a flexible PVC pipe whose diameter is 6.0 mm, and the other side of the flexible PVC pipe is connected to a needle whose diameter can be changed. The diameter of the needle adopted in the experiment ranges from 0.11 to 0.60 mm. The needle was fixed to the bottom of the water tank. When air was forced to flow by the injection pump at 0.25 ml min−1, the air, after passing through the flexible PVC pipe, came out of the needle and floated up freely from the bottom of the water tank. The radius of the air bubble can be controlled within the range of 0.70–4.00 mm. The equivalent radius of the air bubble released by the needle whose diameter is 0.60 mm varies by 20 % at most. The error will gradually decrease as the size of the needle decreases. The error of the air bubble released by the needle whose diameter is 0.11 mm can reach 2 %. The corresponding air bubble morphology was in the asymmetric regime (Tripathi, Sahu & Govindarajan Reference Tripathi, Sahu and Govindarajan2015). During the experiment, a synchronous device was adopted to control the triggering of the high-speed camera, the pressure acquisition system and the underwater low-voltage discharge system. The synchronous device consists of a pair of laser modules (a punctiform infrared laser whose wavelength is 650 nm where the diameter of the laser ray is 1–2 mm) and a light dependent resistor. The laser modules constantly emitted laser beams from the side of the high-speed camera and the laser beams penetrated the glass water tank and illuminated the light dependent resistor on the other side of the water tank. When an air bubble floated up to where the laser beams were located, the light dependent resistor could sense the change in light intensity and transmitted the trigger signal to the synchronous device to trigger the high-speed camera, the pressure testing system and the underwater discharge system in turn.
Because of the complex change in the shape of the air bubble when the air bubble floated up in water, the image grey scale technology was adopted to calculate the pixel number that the air bubble took in the image when the cavitation bubble was generated, and then to calculate the radius of the circle whose area is the same as that of the pixel number. Such a radius would be taken as the parameter to measure the size of the air bubble, i.e. the equivalent radius of air bubble r (as shown in figure 1c). In addition, during grey scale processing, the mass centre of the air bubble was taken as the centre of the air bubble. With the same method, we acquired the equivalent radius of the cavitation bubble R (as shown in figure 1c) and the maximum radius of the cavitation bubble Rmax. The contact point of electrodes at the initial moment of the cavitation bubble was taken as the centre of the cavitation bubble. The parameter t denotes the time taken for the evolution of the cavitation bubble. In this paper, we adopted L 1, L 2, L 3, D to denote the distance between the centre of the air bubble and the centre of the cavitation bubble, the minimum distance between the centre of the air bubble to the wall surface, the distance between cavitation bubble and free surface and the minimum distance between the centre of the cavitation bubble to the wall surface, respectively (as shown in figure 1c). The parameter θ was used to denote the angle between L 1 and D (as shown in figure 1c, α = θ/2 ${\rm \pi}$). During dimensionless processing, we adopted γ, ε, φ, φs to denote the bubble–wall relative distance (D/Rmax), the bubble–bubble relative size (r/Rmax), the bubble–bubble relative distance (L 1/Rmax) and the relative distance between the cavitation bubble and the free surface (L 3/Rmax), respectively. Moreover, we adopted P 1, P 2, E 1, E 2 to denote the impact pressure and the energy of the shock wave from the first and second collapses of the cavitation bubble on the wall surface with the effect of the air bubble, respectively, Pmax ,1, Pmax ,2 to denote the corresponding pressure peaks, respectively, and
 ${P^{\prime}_{max,1}}$,
 ${P^{\prime}_{max,2}}$,
 ${E^{\prime}_1}$,
 ${E^{\prime}_2}$ to denote the impact pressure peak and the energy of the shock wave from the first and second collapses of the cavitation bubble on the wall surface when there is no air bubble, respectively.
3. The influence of the air bubble on the shape of the shock wave
In this part, the influence of the air bubble and the free surface (infinitely large air bubble) on the shock wave from the first collapse of the cavitation bubble is discussed.
3.1. The influence of bubble–bubble relative distance on the shape of the shock wave
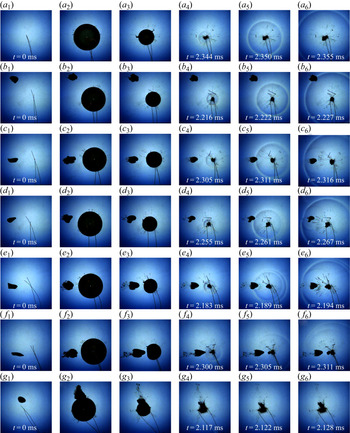
Figure 2 shows the high-speed photographic images on the influence of the air bubble on the shock wave from the first collapse of the cavitation bubble when the bubble–bubble relative distance φ changes.
Influence of bubble–bubble relative distance on the shape of the shock wave (frame rate: 180 000 f.p.s., exposure time: 0.25 μs, frame width: 39.94 mm): (a) Rmax = 9.83 mm; (b) Rmax = 9.49 mm, ε = 0.28, φ = 2.23; (c) Rmax = 9.86 mm, ε = 0.25, φ = 1.59; (d) Rmax = 9.80 mm, ε = 0.23, φ = 1.43; (e) Rmax = 9.74 mm, ε = 0.26, φ = 1.33; (f) Rmax = 10.42 mm, ε = 0.22, φ = 1.06; (g) Rmax = 10.03 mm, ε = 0.24, φ = 0.54.

In figure 2(a), Rmax is 9.83 mm. When t = 2.344 ms, the cavitation bubble contracted to its minimum volume. Because the cavitation bubble was located in a free field, the direction of collapse was not obvious, as shown in figure 2(a 4). The cavitation bubble emitted a strong shock wave. When there was no external interference, the shock wave in a free field would have a regular spherical shape. This regular spherically symmetric shock wave phenomenon also appeared in the case of laser-induced cavitation collapse (Ohl et al. Reference Ohl, Kurz, Geisler, Lindau and Lauterborn1999). The shock wave shape in figure 2(a 4) is consistent with the shape of the shock wave reported in Philipp & Lauterborn (Reference Philipp and Lauterborn1998), which is less affected by the wall (γ = 1.9). As for the cavitation bubble in a free field, because the radial velocity of the cavitation surface in all directions was consistent, when the cavitation bubble contracted to its minimum volume, the shock wave induced under the implosion effect would have a regular spherical shape (Beig Reference Beig2018).
In figures 2(b) and 2(c), the air bubble was quite far from the cavitation bubble and the values of φ in two experiments were 2.23 and 1.59, respectively. The cavitation bubbles in two experiments completed their respective first collapses at around 2.216 and 2.305 ms, and during the collapse, such cavitation bubbles emitted a shock wave. From the high-speed photographic image, the shape of the shock wave was quite regular, similar to the shape of the shock wave in figure 2(a). In figure 2(c), when the shock wave reached the air bubble, a darker wave moving in the opposite direction was emitted from the surface of the air bubble, as shown in figure 2(c 6). When the shock wave passed the air bubble, the colour of the shock wave in the area on the left side of the air bubble was lighter than that of the shock wave in other areas.
In figures 2(d)–2(f), the values of φ were 1.43, 1.33 and 1.06, respectively, and gradually reduced. In the three experiments, all the cavitation bubbles emitted a shock wave. Because the distance between the cavitation bubble and the air bubble was relatively short, in those experiments, the shapes of the shock wave were completely different from that of the shock wave in figure 2(a). Firstly, these shock waves had an obviously stratified structure; and when those stratified waves propagated outwards, the distance between waves within a stratification structure increased as φ was reduced, as shown in figures 2(d), 2(e) and 2(f). Secondly, when the shock wave reached the surface of the air bubble, an obvious wave moving in the opposite direction appeared at the surface of the air bubble, as shown in figures 2(d 6) and 2(e 6). Thirdly, when the shock wave passed the air bubble and continued to propagate outwards, in the area behind the air bubble, the shock wave was obviously deformed (as shown in figure 2d 6), and the degree of deformation decreased as φ was reduced (as shown in figure 2e) and finally became non-obvious (as shown in figure 2f).
As φ was further reduced, during the evolution of the cavitation bubble, the cavitation bubble absorbed the air bubble and a gas-bearing cavitation bubble was formed, as shown in figure 2(g 2). When the cavitation bubble contracted to its minimum volume, the cavitation bubble and the air bubble completely merged, as shown in figure 2(g 4). Moreover, compared with other experiments in figure 2, when the cavitation bubble contracted to its minimum volume, the volume of the cavitation bubble was obviously bigger than that in other experiments. Another important phenomenon is that, in this experiment, during the collapse of the cavitation bubble, the shock wave was not visible on the high-speed photographic image.
3.2. The influence of bubble–bubble relative size on the shape of the shock wave
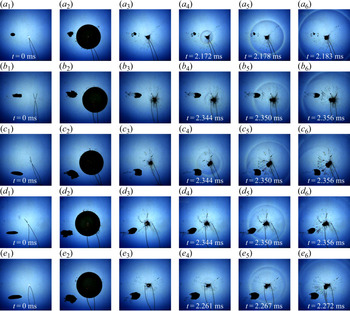
Figure 3 shows high-speed photographic images of the influence of the air bubble on the shock wave from the collapse of the cavitation bubble when ε changes. The radius of the air bubble r changes within the scope of 1.30–2.71 mm.
Influence of bubble–bubble relative size on the shape of the shock wave (frame rate: 180 000 f.p.s., exposure time: 0.25 μs, frame width: 39.94 mm): (a) Rmax = 9.32 mm, ε = 0.14, φ = 1.27; (b) Rmax = 9.52 mm, ε = 0.19, φ = 1.28; (c) Rmax = 9.49 mm, ε = 0.21, φ = 1.28; (d) Rmax = 9.59 mm, ε = 0.25, φ = 1.28; (e) Rmax = 9.69 mm, ε = 0.28, φ = 1.32.

In figure 3(a), ε was 0.14. During the evolution of the cavitation bubble, the air bubble cracked from being squashed and stretched. In the process of collapse, the cavitation bubble emitted a shock wave whose shape is similar to that of the cavitation bubble in figure 2(a). However, compared with figure 3(a), there is an apparent difference in figure 3(b), i.e. when the shock wave reached the area behind the air bubble, the shock wave was apparently deformed, as shown in figure 3(b 6). Nonetheless, in figures 3(a) or 3(b), with the effect of the air bubble, the shock wave did not have an obviously stratified structure. When ε was further increased to 0.21, as shown in figure 3(c), the shock wave was stratified to some extent, as shown in figure 3(c 4), and in the area behind the air bubble, the shock wave was deformed to some degree, as shown in figure 3(c 5). Similar to the phenomenon in figure 3(c), in figure 3(d), the shock wave was stratified to a greater degree, as shown in figure 3(d 5). Finally, ε was increased to 0.28 in figure 3(e). In the experiment, the shock wave was apparently stratified, and when the shock wave reached the surface of the air bubble, a wave moving towards the centre of the cavitation bubble appeared.
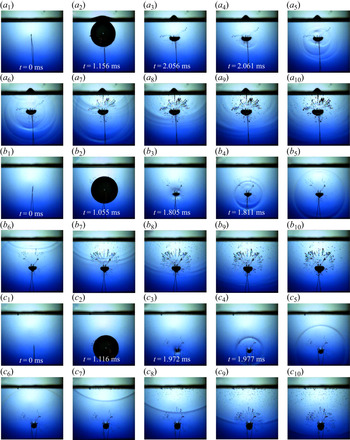
In the experiment on the interaction between the cavitation bubble and the air bubble, an air bubble with a relatively large volume that can float up freely cannot be generated in the water. Thus, when we want to learn about whether an air bubble with a larger volume also has a stratification effect on the shock wave, we generated a cavitation bubble below the free surface so as to observe the effect that an infinitely large air bubble has on the shock wave, as shown in figure 4.
Influence of free surface on the shape of the shock wave (frame rate: 180 000 f.p.s., exposure time: 0.25 μs, frame width: 44.03 mm): (a) Rmax = 8.99 mm, ε = ∞, φs = 0.95; (b) Rmax = 8.96 mm, ε = ∞, φs = 1.70; (c) Rmax = 8.99 mm, ε = ∞, φs = 2.78.

In figure 4(a), φs was 0.95. Under the condition that the free surface was quite close to the cavitation bubble, the shock wave had an obviously stratified structure, as shown in figure 4(a 5). The stratified shock wave was reflected by the free surface, thereby forming a reflected wave. The reflected wave spread inwards in the water, as shown in figure 4(a 7). Based on the shape difference between the shock wave induced by the secondary cavitation bubble in Supponen et al. (Reference Supponen, Akimura, Minami, Nakajima, Uehara, Ohtani, Kaneko, Farhat and Sato2018) and the shock wave in this paper, we can infer that the stratification of the shock wave in figure 4(a) was caused by the influence of the free surface rather than the expansion wave generated during secondary cavitation.
When φs was increased to 1.70, the evolution process of the shock wave was as shown in figure 4(b). Compared with figure 4(a), in this experiment, the shock wave still has an obviously stratified structure, as shown in figure 4(b 4). However, the degree of stratification of the shock wave is lower than that in figure 4(a). The stratification phenomenon of the shock wave from the collapse of the laser-induced cavitation bubble near the free surface also exists in Supponen et al. (Reference Supponen, Obreschkow, Kobel, Tinguely, Dorsaz and Farhat2017). Reflected wave was still formed after the stratified shock wave reached the free surface and such a reflected wave also has a stratified structure. When φs was further increased to 2.78, the evolution process of the shock wave was as shown in figure 4(c). In this experiment, the shock wave does not have a stratified structure anymore, and the stratified structure also did not appear after the shock wave was reflected by the free surface. This further indicates that the layered shock wave in figure 4(a) was not caused by secondary cavitation.
From the evolution of the shock wave with the effect of air bubbles of different sizes and the infinitely large air bubble, we can see that the size of the air bubble has a certain influence on the stratification of the shock wave. Under the condition that the distance between the cavitation bubble and the air bubble remained the same, when the air bubble was small, the shock wave was not stratified, but when the air bubble was big, stratification occurred.
4. The influence of the air bubble near the wall surface on the shock wave
By analysis of the main factors affecting the stratification phenomenon, we found the two key parameters that affect the shock wave, i.e. the relative distance φ and the relative size ε. We have known that the air bubble has a stratification effect on the shock wave, but we still have to find out whether such a stratification effect still exists near the wall surface. If it exists, what is the difference between the critical condition for the stratification effect under such circumstances and that for the stratification effect in a free field, and is there any change in the impact strength of the stratified shock wave on the wall surface? Aimed at these questions, we introduced the influencing factor of the wall surface and conducted an experimental measurement on the shock wave.
4.1. The influence of bubble–bubble relative distance on the strength of the shock wave
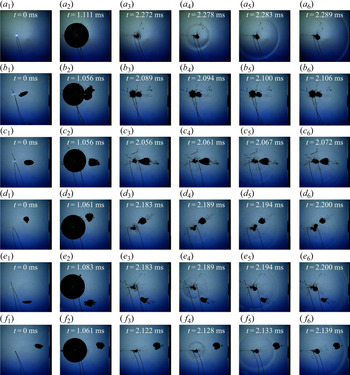
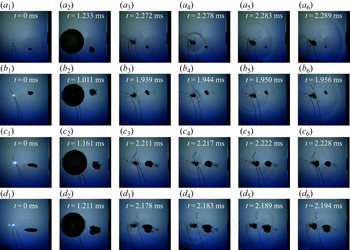
Figure 5 shows a high-speed photographic image of the influence of the air bubble on the shock wave under the condition that φ near the wall surface changes. Figure 5(a) is about the shock wave from the collapse of a single cavitation bubble near a wall. In figure 5(b–f), the black area in the middle of each image is air bubbles (and after the cavitation bubble was generated, the black area on the left side of the image is cavitation bubbles) and the boundary area on the right side of the image is the rigid wall surface.
Influence of bubble–bubble relative distance near the wall on the shape of the shock wave (frame rate: 180 000 f.p.s., exposure time: 0.25 μs, frame width: 42.68 mm; the black area on the right of each image is rigid wall surface): (a) Rmax = 10.23 mm, γ = 2.850; (b) Rmax = 10.19 mm, φ = 0.546, γ = 2.767, ε = 0.234, θ = 8.956 °; (c) Rmax = 9.73 mm, φ = 1.056, γ = 2.867, ε = 0.298, θ = 1.991 °; (d) Rmax = 10.49 mm, φ = 1.305, γ = 2.800, ε = 0.215, θ = 29.934 °; (e) Rmax = 10.27 mm, φ = 1.502, γ = 2.873, ε = 0.183, θ = 46.087 °; (f) Rmax = 10.08 mm, φ = 1.934, γ = 2.836, ε = 0.238, θ = 12.314 °.

In figure 5(a), γ is 2.850. When collapsing, the shock wave is a regular spherical shape. When the shock wave reached the wall surface, it impacted on the wall surface. Because γ > 1 in figure 5(a), during the first collapse of the cavitation bubble, the re-entrant jet would not impact on the wall surface (Philipp & Lauterborn Reference Philipp and Lauterborn1998).
In figure 5(b), φ is 0.546. The cavitation bubble merged with the air bubble and formed a gas-bearing cavitation bubble. After the gas-bearing cavitation bubble contracted to its minimum volume, its volume was apparently bigger than the minimum volume of the cavitation bubble in the experiment of figure 5(a), and there were no signs of the shock wave from the images, as shown in figures 5(b 4)–5(b 6).
In figure 5(c), φ is 1.056. The air bubble was apparently deformed, the air bubble had a cone-shaped surface (as shown in figure 5c 3). At that moment, the air bubble and the cavitation bubble were not merged. Shock waves had an obviously stratified structure, as shown in figure 5(c 5). The shock waves from secondary cavitation appear at multiple points at the same time (Supponen et al. Reference Supponen, Akimura, Minami, Nakajima, Uehara, Ohtani, Kaneko, Farhat and Sato2018), while in figure 5(c 5), the third layer shock wave only has one layer and such a shock wave has a relatively regular shape. Thus, we can infer that the third layer of the shock wave came from the point where the cavitation bubble collapsed. The evolution of the cavitation bubbles in figure 5(d,e) is similar to that in figure 5(c), these shock waves had a stratification structure. The difference among the three experiments above is that, as φ increased, the degree of shock wave stratification weakened. In figure 5(f), the value of φ was 1.934. In the area between the air bubble and the wall surface, the shock wave did not have any apparent deformation. Instead, it kept a completely spherical shape, similar to the situation in figure 5(a).
From the above-mentioned influence of the air bubble on the shock wave under the condition that φ changes, the air bubble has a certain stratification effect on the shock wave. As for the strength of the stratified shock wave, we need to carry out an analysis based on the impact pressure. The process of a shock wave impacting on the wall surface in figure 5 is shown in figure 6.
Process of the shock wave impacting on the wall surface under different bubble–bubble distance conditions. The images above concern the process of the shock wave impacting on the wall surface in the experiments of figure 5. The red dotted line on the right of the images represents the location of the sensor, the shock waves in all the impact processes have been marked with a white arrow.

In figure 6(a), it was obvious that the impact of the spherical shock wave on the wall surface had one peak value that reached 2.390 MPa. Vogel et al. (Reference Vogel, Busch and Parlitz1996) studied the relationship between the velocity of the shock wave from the laser-induced cavitation bubble  ${u_s}$ and its pressure
 ${p_s}$, and found they satisfy the following equation:
 \begin{equation}{p_s} = {c_1}{\rho _0}{u_s}({10^{({u_s} - {c_0})/{c_2}}} - 1) + {p_\infty },\end{equation}
where  ${\rho _0}$ denotes the density of the water that has not been compressed by the shock wave,
 ${c_0}$ denotes the acoustic speed in water (22 °C,
 ${c_0} \approx 1482.9\;\textrm{m}\;{\textrm{s}^{ - 1}}$),
 ${c_1}$ and
 ${c_2}$ are 5190 m s−1 and 25 306 m s−1, respectively, and
 ${p_\infty }$ denotes the hydrostatic pressure. From figure 5(a 5,a 6), we can get that the velocity of the shock wave is approximately 1486.726 m s−1. Thus, we estimated that the impact pressure of the shock wave is approximately 2.808 MPa, which is close to the data given in this paper by means of measurement. Beig et al. (Reference Beig, Aboulhasanzadeh and Johnsen2018) conducted precise numerical simulations on micrometre-scale cavitation bubbles when the conditions of γ are different and analysed the pressure profile. The pressure profile is similar to that measured in the study of this paper. The value of γ in this paper is much larger than that in Beig et al. (Reference Beig, Aboulhasanzadeh and Johnsen2018). Therefore, it is unfortunate that a precise comparison of peak pressure cannot be made.
In figure 5(b), the cavitation bubble became a gas-bearing cavitation bubble, the minimum volume to which such a cavitation bubble contracted was relatively large and, during the collapse, the shock wave was not visible on the image. However, from the measurement data, we can see two peak values, and these two peak values are similar, i.e. 0.366 and 0.372 MPa.
In figure 6(c), there are three peak values, i.e. 0.309, 0.390 and 0.119 MPa. The three peak values can be located on the experimental images. In the pressure profile, because the peak value is tiny, the shock wave was stratified, and the stratified shock wave was further shielded by the air bubble. Thus, the maximum pressure peak value in figure 6(c) was close to the pressure peak value under the condition of merger in figure 5(b). As for figure 6(d), we can see two layers of shock waves, their impact pressures were 0.589 and 0.548 MPa respectively. As for figure 6(e), there was only one obvious main peak value that is 1.541 MPa. Due to the tiny interval between the two peaks on the image, we can infer that the second shock wave is approximately 0.257 MPa. As for figure 6(f), the shape of the shock wave has no obvious stratification, and the peak value of the shock wave is approximately 1.581 MPa. Compared with figure 5(a), there was no obvious stratification in figure 5(f), but the peak value of the shock wave is apparently lower than 2.390 MPa. By analysing figure 5(f 6), we found that, in the area between air bubble and wall surface, the colour of the shock wave became lighter in the foregoing area after the shock wave was hindered by the air bubble. It can be seen from the above data that when φ is larger, the air bubble can effectively attenuate the intensity of the shock wave.
4.2. The influence of bubble–bubble relative size on the strength of the shock wave
In this part, we will further analyse the shock wave under the condition that ε changes. Figure 7 is about the evolution process of the shock wave when ε gradually increases.
Influence of bubble–bubble relative size near the wall on the shape of the shock wave (frame rate: 180 000 f.p.s., exposure time: 0.25 μs, frame width: 42.68 mm): (a) Rmax = 10.02 mm, φ = 1.305, γ = 2.715, ε = 0.102, θ = 30.920 °; (b) Rmax = 9.90 mm, φ = 1.357, γ = 2.906, ε = 0.158, θ = 13.804 °; (c) Rmax = 10.03 mm, φ = 1.264, γ = 2.657, ε = 0.233, θ = 7.771 °; (d) Rmax = 10.06 mm, φ = 1.305, γ = 2.715, ε = 0.269, θ = 17.102 °.

In figure 7(a), the radius of the air bubble is approximately 0.1 times the maximum radius of the cavitation bubble. From figure 7(a 4), we can see that the shock wave had two layers, but the distance between the two layers was tiny. In figure 7(b 5), the shock wave had a stratified structure. Moreover, when the shock wave impacted on the surface of the air bubble, a reflected wave appeared, as shown in figure 7(b 6); and, in the area behind the air bubble, the shock wave had a shape that is slightly oblate. The value of ε was gradually increased to 0.233, as shown in figure 7(c), and the shock wave still had a stratified structure. However, from the high-speed photographic image, the trace of the shock wave is not as obvious compared with figures 7(a) and 7(b). In figure 7(d), ε was increased to 0.269. When the cavitation bubble collapsed, the shock wave was still stratified, but the brightness of the shock wave was further reduced. Similarly, in the area between the air bubble and the wall surface, it is hard to observe the shock wave, as shown in figure 7(d 6).
Figure 8 is about the process of the shock wave impacting on the wall corresponding to figure 7. In figure 7(a 4), we can see two layers of shock wave, but it is difficult to identify the shock wave when it impacted on the wall. From the evolution of the shock wave in figure 8(a), we can see that the shock wave had one peak value that is 2.480 MPa. In figure 7(b 5), we can identify that the shock wave was comprised of two layers, and their peak values of the impact pressures were 1.420 and 0.308 MPa, respectively. In figure 8(c), the impact had two obvious peak values, which were 0.737 and 0.656 MPa. In figure 8(d), the peak value of the impact pressure was 0.702 MPa. It is worth noting that the pressure peak value in figure 7(b) is approximately twice the pressure peak value in figure 8(c), while the γ value in figure 7(b) is slightly bigger than that in figure 8(c). From this, we can see that the air bubble has an obvious attenuation effect on the pressure peak value of the shock wave.
Process of the shock wave impacting on the wall surface under different conditions of air bubble size. The images above concern the process of the shock wave impacting on the wall surface in the experiments of figure 7. The red dotted line on the right of the images represents the location of the sensor. In the images, the shock waves in all the impact processes have been marked with a white arrow.

4.3. The critical condition of the stratification effect
From § 3 and the §§ 4.1–4.2, we can see that when the relative distance φ and the relative size ε meet certain conditions, the air bubble will have a certain stratification effect on the shock wave. We analysed the relationship between φ and ε under the two circumstances, i.e. in a free field and near a wall surface, as shown in figure 9. The value of ε is varied in the range 0.09–0.56, and φ is varied in the range 0.42–5.14.
Critical conditions for stratification of shock waves by air bubbles in a free field and near the wall.

From figure 9, we can see that the stratification effect of the air bubble on the shock wave is consistent under the two conditions. When ε remained the same and φ gradually increased, the following phenomena appeared in turn, i.e. the shock wave was stratified under the condition that the air bubble and the cavitation bubble were merged. The shock wave was stratified under the condition that the bubble–bubble distance was quite small, and no stratified structure occurred under the condition that the bubble–bubble distance was large. Subject to the experimental condition, no more experiments could be conducted under the condition that the size of the air bubble was larger.
In addition, in figure 9, when φ < 1, which is equivalent to the situation where the air bubble has occupied part of the space for the development of the cavitation bubble before the generation of the cavitation bubble, it is easy for the air bubble and the cavitation bubble to merge. Under such circumstance, the shock wave would be easily stratified, and the shock wave even could not be visible on the high-speed photographic images in some experiments. When 1 < φ < 1.5ε + 1.25, the two bubbles did not merge in the process of evolution, but the shock wave was stratified. When φ > 1.5ε + 1.25, the air bubble had little influence on the evolution form of the shock wave and the shock wave was not stratified.
From the discussion above we can see that the relationship between the φ and (1.5ε + 1.25) becomes the basis for determining the critical condition for the stratification effect that the air bubble has on the shock wave from the first collapse of the cavitation bubble. From the physical properties of the surrounding medium distribution of the cavitation bubble, we can see that, because the air bubble and water are different in compressibility, the air bubble within the range of effect of the cavitation bubble changes the consistency of the surrounding medium of the cavitation bubble. Compared with the collapse of the cavitation bubble in a free field, the inconsistency of the surrounding medium of the cavitation bubble ultimately leads to an asymmetry of the shape of the cavitation bubble when it collapses. From the mechanism of generating the implosion shock wave and the water hammer shock wave, we can see that when φ > 1.5ε + 1.25, the distance between two bubbles is relatively large and the influence that the air bubble has on the shape of the cavitation bubble when the cavitation bubble collapses is small. Beig (Reference Beig2018) carried out a fine numerical simulation on the collapse of the cavitation bubble near the wall surface. From the research findings thereof, we can see that when the relative distance between the cavitation bubble and the wall surface γ > 4, the water hammer shock wave and implosion shock wave are nearly indistinguishable. When 1 < φ < 1.5ε + 1.25, the existence of the air bubble will affect the evolution of the cavitation bubble and the shape thereof when the cavitation bubble collapses. When the cavitation bubble collapses, because the re-entrant jet impacts on the surface of the opposite side of the cavitation bubble, a water hammer shock wave, i.e. the outer shock wave in the experimental images, is formed. As the cavitation bubble further collapses and rebounds, an implosion shock wave appears. Such a stratification phenomenon of the shock wave also exists when the cavitation bubble near the wall surface collapses. The shock wave from the collapse of the laser-induced cavitation bubble near the wall surface in Lindau & Lauterborn (Reference Lindau and Lauterborn2003) and the result of the high-precision numerical simulation on the collapse of the cavitation bubble near the wall surface in Beig (Reference Beig2018) verify the formation mechanism of the stratification of the shock wave from the collapse of the cavitation bubble. When φ < 1, the cavitation bubble absorbs the air bubble during its evolution, which leads to the existence of a huge amount of non-condensable gas inside the cavitation bubble that increases the minimum volume of the cavitation bubble to which the cavitation bubble contracts during its collapse, and the surface of the cavitation bubble is very irregular after it merges with the air bubble. The joint effect of such factors effectively attenuates the shock wave induced by the implosion effect of the cavitation bubble, leading to the stratification of the shock wave under the condition that the two bubbles merge, which even cannot be seen in the high-speed photographic images.
5. Analysis of shock wave intensity under different influence modes of air bubbles on cavitation bubbles
The above-mentioned experiments studied the stratification effect that the air bubble has on the shock wave in a free field and near a wall surface. We still need to further identify the impact strength of the shock wave affected by the air bubble and the relations among the factors influencing the change in strength.
We divided the experiments on the influence of the air bubble near a wall surface on the shock wave into three categories; an experiment in which the shock wave is not stratified under the condition that the air bubble does not merge with the cavitation bubble, an experiment in which the shock wave is stratified under the condition that the air bubble does not merge with the cavitation bubble and an experiment in which the shock wave is stratified under the condition that the air bubble merges with the cavitation bubble.
Figures 5–8 show that  $\alpha $ has an impact on the shielding effect of the shock wave. For the measurement points on the wall, the shielding effect of the air bubble on the shock wave decreased as
 $\alpha $ increased. It is obvious that the shielding effect that the air bubble has on the shock wave is connected with the shape of the air bubble to some extent. However, it is almost impossible to control the shape of air bubbles to make sure that the shapes of all air bubbles are exactly the same. Nevertheless, we can control the shape of the air bubbles when they float up and make sure that the change in the shape of the air bubbles is within a small scope, i.e. to guarantee that the air bubbles are in the asymmetric regime (Tripathi et al. Reference Tripathi, Sahu and Govindarajan2015). By doing so, we can guarantee that the surface of the air bubble will not be dented and can improve the accuracy of the effective radius r of the air bubble. The research of this paper is conducted under the condition that the scope of change in the distance between the cavitation bubble and the wall surface is tiny because we only want to identify the influence of the shock wave on the wall surface. However, from an existing report (Wang & Chen Reference Wang and Chen2007), it can be found that the impact strength of the collapse of the cavitation bubble on the wall surface is inversely proportional to γ (γ > 1). Besides, as for the size of air bubble, an air bubble that is relatively large has a greater effect of shielding and stratification. Thus, ε shall also be inversely proportional to the relative strength of the shock wave. Thus, we drew in figure 10 the relations between the relative pressure peak of the shock wave from the first collapse of cavitation bubbles
 ${P_{max}}_{,1}/{P^{\prime}_{max,1}}$ and the corresponding value of
 $\alpha \varphi /\varepsilon \gamma $ under the three classified conditions.
The relationship between  $\alpha \varphi /\varepsilon \gamma $ and
 ${P_{max}}_{,1}/{P^{\prime}_{max,1}}$.

From figure 10, it can be clearly seen that  ${P_{max}}_{,1}/{P^{\prime}_{max,1}}$ is comprehensively affected by the relative size of the air bubble ε, the bubble–wall distance γ, the bubble–bubble distance φ and angle
 $\alpha $. When the air bubble merges with the cavitation bubble,
 ${P_{max}}_{,1}/{P^{\prime}_{max,1}}$ is at the minimum value; when the cavitation bubble is quite close to the air bubble, the air bubble, mainly by layering the shock wave, effectively reduces the pressure peak of the shock wave; when the cavitation bubble is quite far away from the air bubble, the air bubble, to some extent, retards the direct impact of the shock wave on the wall surface, and the peak impact pressure is also reduced to a certain degree.
In figure 10, the empirical relationship between  ${P_{max}}_{,1}/{P^{\prime}_{max,1}}$ and
 $\alpha \varphi /\varepsilon \gamma $ may be obtained by a power function with the Levenberg–Marquardt method (Madsen, Nielsen & Tingleff Reference Madsen, Nielsen and Tingleff2004):
 \begin{equation}\frac{{{P_{max,1}}}}{{{{P^{\prime}}_{max,1}}}} = a{\left( {\frac{1}{\gamma }} \right)^b}{\left( {\frac{{\alpha \varphi }}{\varepsilon }} \right)^b}.\end{equation}
When the air bubble and the cavitation bubble did not merge and the shock wave was not stratified, the adjusted R 2 value in (5.1) is 0.817 and the values of a and b are 0.979 and 0.162, respectively. When the air bubble and the cavitation bubble did not merge but the shock wave was stratified, the adjusted R 2 value in (5.1) is 0.893 and the values of a and b are 0.803 and 0.271, respectively. When the air bubble and the cavitation bubble merged, the adjusted R 2 value in (5.1) is 0.435 and the values of a and b are 0.384 and 0.288, respectively. It should be noted that the fitting analysis on the pressure peak of the shock wave after the merger of two bubbles is not so satisfying, mainly because, under such circumstances, the distance between the cavitation bubble and the air bubble is small. On the one hand, corresponding experimental data are limited, one the other hand, the air bubble may merge with the cavitation bubble at any time in the first oscillation period. The stage of development of the cavitation bubble in which the merger takes place has an influence on the subsequent evolution and the collapse of the cavitation bubble. But on the whole,  ${P_{max}}_{,1}/{P^{\prime}_{max,1}}$ increases as
 $\alpha \varphi /\varepsilon \gamma $ increases, and the change trend thereof is basically consistent with that under the two no merger conditions.
In (5.1),  ${(1/\gamma )^b}$ is the parameter between the measuring point and the point where the cavitation bubble is generated, which can reflect the positional relationship between the measuring point and the cavitation bubble. As for the influence that the air bubble has on the pressure peak of the shock wave, it is mainly affected by ε, φ and the angle formed by the air bubble–cavitation bubble–wall surface system
 $\alpha $, i.e.
 ${(\alpha \varphi /\varepsilon)^b}$. It should be noted that, due to the limitations of the experimental conditions, this paper did not further explore the influence that the air bubble has on the shock wave under the circumstance where the size of the air bubble is bigger and the distance is longer. Thus, the empirical relationship above can only reflect the relationship of the change in the strength of the shock wave when ε < 0.6 and φ < 5.
The content above can only reflect the characteristics of the peak value of the shock wave. If we want to explore the strength of the shock wave under the effect of the air bubble, we still need to evaluate the energy of the shock wave. The energy of the shock wave when the cavitation bubble collapses can be acquired by means of the pressure profile (Cole Reference Cole1948; Vogel et al. Reference Vogel1999)
 \begin{equation}E =\frac{{4{\rm \pi}{s^2}}}{{{\rho _0}{c_0}}}\int {{P^2}\,\textrm{d}t} .\end{equation}
In (5.2), s denotes the distance between the shock wave emission centre and the measuring point and ρ 0 and c 0 denote the density of water and the acoustic speed in water, respectively. The integration bounds are selected to comprise the full waveform of the shock wave. By means of the equation above, we evaluated the relative energy change of the shock wave from the first collapse of the cavitation bubble under the three modes where the air bubble affects the cavitation bubble in figure 10, as shown in figure 11.
The relationship between  $\alpha \varphi /\varepsilon \gamma $ and
 ${E_1}/{E^{\prime}_1}$.

From figure 11, it can be seen that, under different modes such that the air bubble affects the cavitation bubble, the energy of the shock wave decreased to different extents. When the air bubble did not have the stratification effect on the shock wave, the degree of decrease in the energy of the shock wave was minimal. When the shock wave was stratified and the two bubbles did not merge, the degree of decrease in the energy of the shock wave was larger. When the air bubble and the cavitation bubble merged, the degree of energy attenuation of the shock wave was the largest.
In figure 11, the empirical relationship between  ${E_1}/{E^{\prime}_1}$ and
 $\alpha \varphi /\varepsilon \gamma $ may be obtained by a power function with the Levenberg–Marquardt method (Madsen et al. Reference Madsen, Nielsen and Tingleff2004)
 \begin{equation}\frac{{{E_1}}}{{{{E^{\prime}}_1}}} = a{\left( {\frac{1}{\gamma }} \right)^b}{\left( {\frac{{\alpha \varphi }}{\varepsilon }} \right)^b}.\end{equation}
When the air bubble and the cavitation bubble did not merge and the shock wave was not stratified, the adjusted R 2 value in (5.3) is 0.886 and the values of a and b are 0.993 and 0.166, respectively. When the air bubble and the cavitation bubble did not merge but the shock wave was stratified, the adjusted R 2 value in (5.3) is 0.944 and the values of a and b are 0.905 and 0.217, respectively. When the air bubble and the cavitation bubble merged, the adjusted R 2 value in (5.3) is 0.674 and the values of a and b are 0.453 and 0.152, respectively.
From figure 11, it can be seen that under different modes that the air bubble affects the cavitation bubble, the energy of the shock wave decreased to different extents compared with that under the circumstance where there is no air bubble. Under the effect of the cavitation bubble, the air bubble was obviously deformed, and part of the energy of the cavitation bubble was transferred to the air bubble (Smith & Mesler Reference Smith and Mesler1972). The degree to which shock wave energy is reduced depends on whether the air bubble merges with the cavitation bubble and whether the shock wave is stratified. However, when the two bubbles merged, the non-condensable gas directly entered the cavitation bubble, which considerably buffered the degree of the contraction of the cavitation bubble. Under such circumstances, the decrease in the energy of the shock wave is the most obvious.
According to the analysis of the physical reason for the stratification of the shock wave from the first collapse of the cavitation bubble under the influence of the air bubble in § 4.3, it can be seen that the stratification phenomenon of the shock wave is closely related to the re-entrant jet. Supponen et al. (Reference Supponen, Obreschkow, Kobel, Tinguely, Dorsaz and Farhat2017) systematically studied the shape of re-entrant jet under the effect of a free surface and in the context of the law of the change in the energy of the shock wave under the condition that  ${\varphi _s}$ varies considerably and built a prediction framework of the energy of the shock wave that is of significance to the study of the attenuation of the energy of the shock wave under the influence of the air bubble in this paper. If the size of the free surface is reduced to that of the air bubble,
 ${\varphi _s}$ under the condition of free surface corresponds to
 $\varphi /\varepsilon $ in this paper. The parameter α reflects the positional relationship among the air bubble, the cavitation bubble and the measurement point. It does not reflect the influence that the air bubble has on the strength of the shock wave from the collapse of the cavitation bubble.
6. The influence of air bubble on the shock wave from the collapse of the rebounded cavitation bubble
6.1. The influence of the air bubble on the shape of the shock wave from the rebounded cavitation bubble
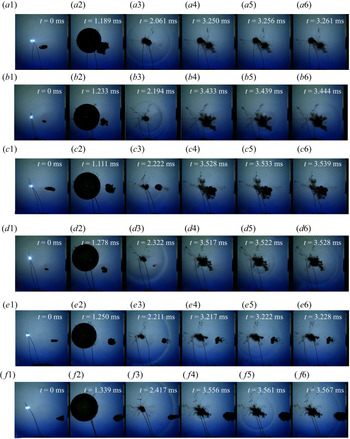
In numerous experiments, we found that, when the air bubble existed, a shock wave was also observed during the second collapse of the cavitation bubble, and that, under some conditions, such a shock wave was also stratified. The multiple peak values in the experiment conducted by Supponen et al. (Reference Supponen, Obreschkow, Kobel, Dorsaz and Farhat2019) perfectly reflect the characteristic of the gradual reduction in the strength of the collapse of the cavitation bubble. Thus, this part mainly analyses the shock wave from the second collapse of the cavitation bubble.
In figure 12(a), the relative distance between the cavitation bubble and the air bubble φ < 1. According to the critical condition of the air bubble stratifying the shock wave from the collapse of the cavitation bubble in figure 9, when the cavitation bubble contracted to its minimum volume, the air bubble had completely merged into the cavitation bubble. The minimum volume of the cavitation bubble is slightly bigger than that when there is no air bubble (comparing figures 5a 3 and 12a 3). After the cavitation bubble entered the second oscillation cycle, during its evolution, the cavitation bubble started to have an irregular shape (Lindau & Lauterborn Reference Lindau and Lauterborn2003), and during its second collapse, the shock wave is invisible on the images.
High-speed photographic image of the shock wave from the collapse of the rebounded cavitation bubble (frame rate: 180 000 f.p.s., exposure time: 0.25 μs, frame width: 42.68 mm): (a) Rmax = 10.18 mm, φ = 0.727, γ = 2.489, ε = 0.209; (b) Rmax = 10.28 mm, φ = 0.949, γ = 2.562, ε = 0.108; (c) Rmax = 10.55 mm, φ = 1.264, γ = 2.575, ε = 0.222; (d) Rmax = 10.33 mm, φ = 1.460, γ = 2.784, ε = 0.101; (e) Rmax = 10.06 mm, φ = 2.036, γ = 2.867, ε = 0.169; (f) Rmax = 10.47 mm, φ = 2.250, γ = 2.667, ε = 0.209.

In figure 12(b), the bubble–bubble relative size ε is 0.108. In the first and second collapses of the cavitation bubble, the shock wave had the characteristics of a stratified structure, as shown in figures 12(b 3) and 12(b 5). In figure 12(c,d), when the cavitation bubble contracted to its minimum volume during the second cycle, it is obvious that the volume in figure 12(c) is bigger than that in figure 12(d), as shown in figures 12(c 4) and 12(d 4). The most important point is that, in figure 12(d), during its second collapse, the shock wave showed characteristics of a stratified structure, while in figure 12(c), we did not find any trace of a shock wave. In figure 12(e,f), during the first two oscillation cycles, the cavitation bubble did not merge with the air bubble. During the second collapse, the shock waves in the two experiments were different. In figure 12(e), the shock wave from the second collapse was comprised of two layers, as shown in figure 12(e 5), while in figure 12(f), the shock wave from the second collapse had only one layer, as shown in figures 12(f 5) and 12(f 6).
Figure 13 concerns the process of the shock wave from the second collapse impacting on the wall surface, corresponding to that in figure 12. As for figure 13(a), during the second collapse of the cavitation bubble, we did not find any shock wave in the high-speed photographic image; accordingly, the pressure did not have any obvious peak value (the peak value was only 0.158 MPa) and the time taken for the whole process of the impact is relatively long. In figure 12(b), during the second collapse, the cavitation bubble still emitted a shock wave that had a stratified structure, and that the major peak value was approximately 1.290 MPa.
Process of the shock wave from the collapse of the rebounded cavitation bubble impacting on the wall surface. The images above concern the process of the shock wave from the collapse of the rebounded cavitation bubble impacting on the wall surface in figure 12. The red dotted line on the right of the images represents the location of the sensor. In the images, the shock waves in all the impact processes have been marked with a white arrow.

By comparing figure 12(c,d), we found that the size of air bubble in figure 12(c) was smaller than that in figure 12(d). During the second oscillation cycle, the shape and the size of the cavitation bubble were apparently changed after the cavitation bubble absorbed the air bubble. Due to these changes in the shape and size of the cavitation bubble, shock waves were not found in figure 12(c) during the second collapse. From the corresponding process of pressure, there were two obvious peak values during the process of the impact in figure 12(d), i.e. 0.770 and 0.838 MPa.
As for figure 12(e,f), during the first two cycles, the cavitation bubble did not merge with the air bubble. Accordingly, during the second collapse of cavitation bubble, in figure 13(e), the peak value of the impact on the wall surface was 0.270 MPa (because the distance between the two peak values is tiny, it is hard to identify the second peak value). Moreover, the time taken by the shock wave to impact on the wall surface in figure 13(e) was slightly longer than that in figure 13(f). The peak value of the impact pressure that the shock wave with a single layer in figure 13(f) had on the wall surface was 0.339 MPa.
Based on the characteristics of the shock wave from the second collapse with the effect of the air bubble, it can be found that the characteristics of the shock wave from the collapse of the rebounded cavitation bubble is closely related to φ and ε. We systematically collected experimental data on the influence of the air bubble on the collapse shock wave of the rebound cavitation bubble, as shown in figure 14.
Relations between the bubble–bubble dimensionless parameters and the stratified shock wave from the collapse of the rebounded cavitation bubble.

From figure 14, we can see that when ε and φ are quite small, the cavitation bubble merges with the air bubble during the first oscillation cycle and emits a shock wave with a stratified structure during the collapse of the rebounded cavitation bubble; when φ is quite small, if the size of the air bubble is large, the cavitation bubble will also merge with the air bubble in the first cycle and may not emit a shock wave when the rebounded cavitation bubble collapses. As φ increases, under the condition that the air bubble is small, the shock wave emitted when the rebounded cavitation bubble collapses will basically have a stratified structure, and if the air bubble is large, the rebounded cavitation bubble will not emit a shock wave. As φ further increases, the rebounded cavitation bubble will emit a shock wave. However, under such circumstances, sometimes the shock wave is not stratified and sometimes the shock wave is stratified.
Comparing figures 14 and 9, it can be seen that the critical condition for stratification of the shock wave from the collapse of the rebounded cavitation bubble is different from that of the shock wave from the first collapse of the cavitation bubble. One reason is that, after the first collapse, the form of evolution of the cavitation bubble is not symmetric in shape anymore. The other reason is that the influence that the air bubble has on the cavitation bubble is further accumulated, which leads to a certain change in the shape and volume of the cavitation bubble during its second collapse. Thus, the critical condition for stratification of the shock wave is not obvious when the two bubbles do not merge. However, when ε is relatively small, no matter whether the merger takes place in the first period or the second period, the shock wave from the collapse of the rebounded cavitation bubble will be stratified. When ε is relatively large, it is difficult for us to recognize the shock wave in the images.
As for the characteristics, i.e. whether the rebounded cavitation bubble emits a shock wave when it collapses and whether the shock wave will be stratified, by analysing the size of cavitation bubble when it collapses and whether coalescence occurs, we find that, during the evolution of the cavitation bubble, if the cavitation bubble absorbs non-condensable gas at an earlier stage, the amount of non-condensable gas in the cavitation bubble will increase when the cavitation bubble contracts to its minimum volume and the minimum volume of the cavitation bubble will also increase, which means that the degree of contraction of the cavitation bubble will decrease compared with the case when there is no air bubble. Moreover, the bigger the volume of the air bubble is, the more obvious the reduction in the degree of contraction will be. Besides, after the air bubble is absorbed by the cavitation bubble, the shape of the cavitation bubble will be very complex when the cavitation bubble contracts to its minimum volume. The smaller the air bubble is, the smaller the influence that it has on the shape of cavitation bubble when the cavitation bubble contracts to its minimum volume will be; and the bigger the air bubble is, the bigger the influence that it has on the shape of cavitation bubble when the cavitation bubble contracts to its minimum volume will be.
6.2. The influence of air bubble on the strength of the shock wave from the rebounded cavitation bubble
Section 6.1 observed and measured the influence that the air bubble has on the shock wave from the collapse of the rebounded cavitation bubble and found that the stratification phenomenon of the shock wave from the rebounded cavitation bubble is also affected by the factors such as the bubble–bubble relative distance φ and the bubble–bubble relative size ε. Thus, this section will analyse the strength of the shock wave from the collapse of the rebounded cavitation bubble.
According to the classification of the shock wave in figure 14, we analysed the relationship between the relative pressure peak of the shock wave from the collapse of the rebounded cavitation bubble under different modes, as shown in figure 15. From the distribution of  ${P_{max}}_{,2}/{P^{\prime}_{max,2}}$ in figure 15, we can see that the
 ${P_{max}}_{,2}/{P^{\prime}_{max,2}}$ is closely related to whether the two bubbles merge or not. After the cavitation bubble and the air bubble merge in the first period, the pressure peak of the shock wave from the collapse of the rebounded cavitation bubble has decreased to 20 % of the corresponding value under the circumstance where there is no air bubble. When the cavitation bubble and the air bubble merge in the second period, the pressure peak of the shock wave from the collapse of the rebounded cavitation bubble has decreased to less than 40 % of the corresponding value under the circumstance where there is no air bubble. When the cavitation bubble and the air bubble do not merge in the first two periods, the pressure peak of the shock wave from the collapse of the rebounded cavitation bubble decreases to different extents compared with that under the circumstance where there is no air bubble. If the shock wave is stratified, the degree of decrease will be larger.
The relationship between  $\alpha \varphi /\varepsilon \gamma $ and
 ${P_{max}}_{,2}/{P^{\prime}_{max,2}}$.

In addition, if the cavitation bubble and the air bubble do not merge in the first two periods, the relationship between  ${P_{max}}_{,2}/{P^{\prime}_{max,2}}$ and
 $\alpha \varphi /\varepsilon \gamma $ is similar to the change in
 ${P_{max}}_{,1}/{P^{\prime}_{max,1}}$ and
 $\alpha \varphi /\varepsilon \gamma $. The empirical relationship between
 ${P_{max}}_{,2}/{P^{\prime}_{max,2}}$ and
 $\alpha \varphi /\varepsilon \gamma $ may be obtained by a power function with the Levenberg–Marquardt method (Madsen et al. Reference Madsen, Nielsen and Tingleff2004)
 \begin{equation}\frac{{{P_{max,2}}}}{{{{P^{\prime}}_{max,2}}}} = a{\left( {\frac{1}{\gamma }} \right)^b}{\left( {\frac{{\alpha \varphi }}{\varepsilon }} \right)^b}.\end{equation}
When the cavitation bubble and the air bubble did not merge in the first two periods and the shock wave from the collapse of the rebounded cavitation bubble was not stratified, the adjusted R 2 value in (6.1) is 0.816 and the values of a and b are 0.985 and 0.141, respectively. When the cavitation bubble and the air bubble did not merge in the first two periods and the shock wave from the collapse of the rebounded cavitation bubble was stratified, the adjusted R 2 value in (6.1) is 0.882 and the values of a and b are 0.773 and 0.218, respectively.
According to (5.2), we evaluate the energy of the shock wave from the collapse of the rebounded cavitation bubble under the effect of the air bubble and make a classification based on the modes of influence that the air bubble has on the shock wave from the collapse of the rebounded cavitation bubble so that the relationship between  ${E_2}/{E^{\prime}_2}$ and
 $\alpha \varphi /\varepsilon \gamma $ is obtained, as shown in figure 16.
The relationship between  $\alpha \varphi /\varepsilon \gamma $ and
 ${E_2}/{E^{\prime}_2}$.

From figure 16, it can be seen that, if the ways that the air bubble affects the shock wave from the collapse of the rebounded cavitation bubble are different, the degrees of attenuation of the energy of the shock wave from the collapse of the rebounded cavitation bubble will also be different. No matter whether that cavitation bubble merges with the air bubble in the first period or in the second period, the energy of the shock wave from the collapse of the rebounded cavitation bubble will obviously decrease. When the cavitation bubble and the air bubble do not merge in the first two periods, the energy of the stratified shock wave will be slightly less than that of the unstratified shock wave.
In figure 16, the empirical relationship between  ${E_2}/{E^{\prime}_2}$ and
 $\alpha \varphi /\varepsilon \gamma $ may be obtained by a power function with the Levenberg–Marquardt method (Madsen et al. Reference Madsen, Nielsen and Tingleff2004)
 \begin{equation}\frac{{{E_2}}}{{{{E^{\prime}}_2}}} = a{\left( {\frac{1}{\gamma }} \right)^b}{\left( {\frac{{\alpha \varphi }}{\varepsilon }} \right)^b}.\end{equation}
When the cavitation bubble and the air bubble did not merge in the first two periods and the shock wave from the rebounded cavitation bubble was not stratified, the adjusted R 2 value in (6.2) is 0.825 and the values of a and b are 0.673 and 0.275, respectively. When the cavitation bubble and the air bubble did not merge in the first two periods but the shock wave from the rebounded cavitation bubble was stratified, the adjusted R 2 value in (6.2) is 0.865 and the values of a and b are 0.522 and 0.345, respectively. It should be noted that when the cavitation bubble and the air bubble merged in the first period or the second period, the energy of the shock wave from the collapse of the rebounded cavitation bubble decreased to less than 40 % of that under the circumstance where there is no air bubble, or even lower, and the number of experiments where the shock wave could be recognized in the photographic images were fewer. Thus, in figure 16 no fitting analysis was conducted in such situations. However, from figure 16, we can see that, under such situations, the energy of the shock wave is approximately 20 % of that under the circumstance where there is no air bubble.
Comparing figure 11 with figure 16, it can be found that, under the effect of the air bubble, the energy of the shock wave from the collapse of the cavitation bubble gradually decreases from the first collapse to the second collapse. One reason is that, as the cavitation bubble collapses, its energy is continuously released. The other reason is that the decrease in the relative energy is also connected with the way that the air bubble affects the cavitation bubble.
In short, when the air bubble – cavitation bubble – measuring point system parameters are different, the ways that the air bubble affects the shock wave from the collapse of the cavitation bubble will be different, which leads to an obvious change in the strength of the shock wave. The primary cause is that the air bubble and the water are different in compressibility, which leads to asymmetry of the surrounding medium of the cavitation bubble. When the cavitation bubble is quite close to the air bubble, the existence of the air bubble will lead to a temporal and spatial delay in the water hammer shock wave induced by the re-entrant jet and the shock wave induced by the implosion when the cavitation bubble contracts to its minimum volume, which will finally result in the stratification phenomenon of the shock wave that is photographed in the experiment. When the cavitation bubble is very close to the air bubble, the two bubbles will merge, and the non-condensable gas absorbed will increase the minimum volume to which the cavitation bubble contracts and change the original shape of the cavitation bubble when it collapses, which will finally result in the stratification phenomenon of the shock wave.
7. Conclusion
This paper, by inducing a cavitation bubble with an underwater low-voltage discharge technology, in combination with high-speed photography technology and transient pressure testing technology, studied the stratification effect that the air bubble has on the shock wave from the collapse of the cavitation bubble. The following major conclusions are drawn:
(i) The air bubble in the vicinity of the cavitation bubble has a stratification effect on the shock wave from the collapse of the cavitation bubble, and the effect differs for different bubble–bubble relative distances φ and sizes ε (0.42 < φ < 5.14 and 0.09 < ε < 0.56 in the present study). When the distance between the cavitation bubble and the air bubble is relatively large (i.e. φ > 1.5ε + 1.25), the air bubble has little influence on the shape of the collapsing cavitation bubble, which is similar to spherical collapse, and the single-layered shock wave is mainly caused by the implosion of the cavitation bubble. When the cavitation bubble is relatively close to the air bubble (i.e. 1 < φ < 1.5ε + 1.25), the existence of the air bubble leads to a temporal and spatial delay in the water hammer shock wave induced by the re-entrant jet and the shock wave induced by the implosion, which results in the stratification phenomenon of the shock wave. When the cavitation bubble is very close to the air bubble (i.e. φ < 1), the cavitation bubble is likely to merge with the air bubble during its evolution; compared with the collapse of the cavitation bubble without an air bubble nearby, the volume of the gas-bearing cavitation bubble after the bubble mergence increases, and its shape during contraction and collapse changes, which finally results in the stratification of shock wave and even some phenomena that cannot be visualized in experiments.
(ii) The extent of attenuation in the strength of the shock wave differs for different modes in which the air bubble influences the collapse of the cavitation bubble. By monitoring the strength of the shock wave, we found that the attenuation of the pressure peak and energy of the shock wave are jointly affected by the bubble–bubble relative distance φ, the bubble–bubble relative size ε and the angle  $\alpha $ formed by the air bubble, cavitation bubble and measuring point. The attenuation of the pressure peak and the energy of the shock wave are quantitatively proportional to the system parameter
 $a{(\alpha \varphi /\varepsilon )^b}$. Under the two modes, i.e. whether the shock wave is stratified or not, the values of a and b are different. In addition, when the air bubble merges with the cavitation bubble, the energy of the shock wave from the collapse of the cavitation bubble decreases to less than 40 % or less of that without the presence of the neighbouring air bubble.
The conclusions above have a great guiding significance for application scenarios of cavitation. With the presence of air bubbles in scenarios where cavitation is utilized (Reuter & Mettin Reference Reuter and Mettin2016), such findings can provide guidance on how to control the bubble–bubble parameters so as to maximize the collapse strength of the cavitation bubble. In the application scenarios of the preventive treatment of cavitation (e.g. against cavitation erosion of the blades of hydraulic machinery (Zhang et al. Reference Zhang, Chen, Li and Yu2017a; Zhang, Zhang & Wu Reference Zhang, Zhang and Wu2017b), prevention and reduction of erosion of the high-speed flood discharge structures (Bai et al. Reference Bai, Liu, Tian, Wang and Zhang2017), etc.), such findings can provide guidance on how to control the concentration and size of air bubbles within the near-wall region of the water body.
Funding
This work was supported by the Natural Science Foundation of China (NSFC) (51879178 and 51909180).
Declaration of interests
The authors report no conflict of interest.
Author contributions
W.X. contributed to the conception of the study, J.L. performed the experiment and contributed significantly to analysis and manuscript preparation, and B.C.K. helped perform the analysis with constructive discussions. All authors contributed equally to analysing the data, reaching the conclusions and writing the paper.