


Introduction
Melting plays a role both in ablation and in the other glacial processes, such as movement, ice avalanches, snow and ice metamorphism. It has long been known that melting is locally active in Terra Nova Bay, Antarctica: in the summer there are ephemeral bodies of water (Reference BaroniBaroni, 1989), liquid water in the snowpack, both seasonal (Reference CagnatiCagnati, 1997) and perennial (Reference Meneghel and SmiragliaMeneghel and Smiraglia, 1991a; Reference Motta, Pavan and SmiragliaMotta and others, 2002). During the 1998–2003 Programma Nazionale di Ricerche in Antartide (National Research Program in Antarctica), we studied the importance and spread of melting. In this paper, we show that, under particular conditions, melting occurs even at 1200–1300m a.s.l.
Melting Process of The Coastal Glaciers
Morphological surveys
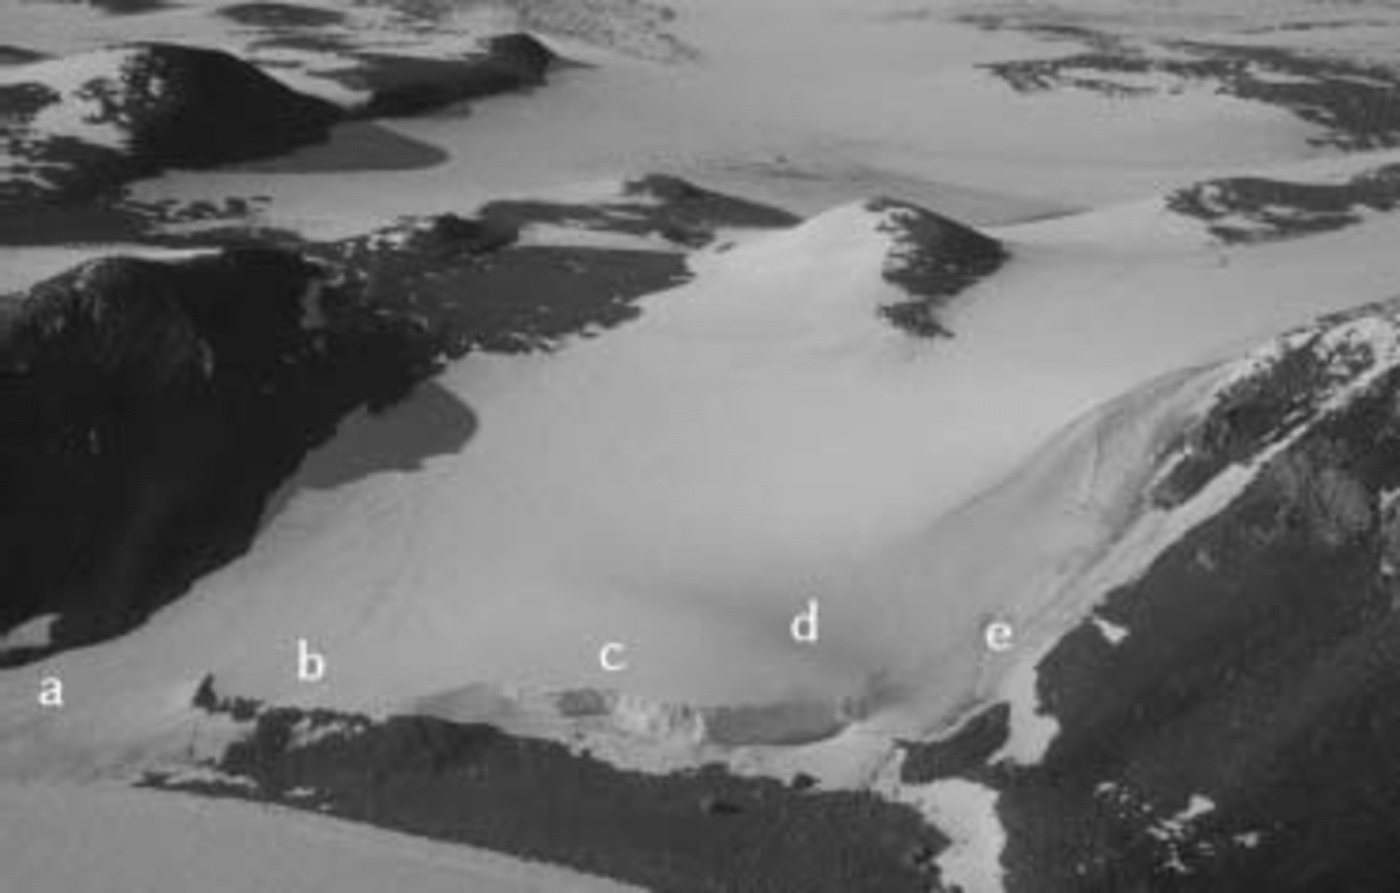
Englacial melting is visible where a step cuts off the gentle slopes, forcing the waters to emerge. This is more likely to happen at glacier fronts. Strandline Glacier, Antarctica (74˚42' S, 164˚02' E), is a good example of relationships between melting and front type. It shows all the front types of the alpine local glaciers (Reference Chinn, Whitehouse and HöfleChinn, 1985; Fig. 1). The western part is a ramp front, at the mouth of a gully, which limits the glacier sideways. The gully has aerodynamic shape because of the action of the wind (Reference ColbeckChinn and others, 1989). In summer, the gully surface is made up of cluster snow, rounded polycrystals and crushed ice (destruction ice), all very permeable materials. Below is exudation and granoblastic ice. In December 2000, a network of underground channels (with cm diameter) was found at 0.1–0.4m depth. As the external surface dropped, the channels sank progressively, maintaining a constant depth. Under the channels, the ice temperature was found to be <0˚C, even during the warmest hours of the day in mid-summer. A perfectly conserved mummified penguin was found on 30 December 2002 beneath the channels supporting the existence of permafrost. The shallow layer of snow and ice is therefore an aquifer, lying on an aquiclude. These conditions obviously occur only during the warm season, with a seasonal cycle presumably similar to that of the active layer of permafrost.
The eastern part of the Strandline front is a transition between a ramp and a dome. The ice from the small accumulation zone is not sufficient to form a dome, but it can form a slope inclined by 35–50˚. The slope is made up of destruction ice. On the slope is a network of channels like the one in the ramp front. Downstream, the slope is separated by a crevasse from an apron. The apron consists of ice covered with a 1–2m snowy layer, and ends in the sea. During the summer, the snowpack of the apron consists of cluster snow, polycrystals and slush snow. The apron has no underground channels. The apron ice lies on seashore deposits, in permafrost conditions. The active layer of permafrost, 0.04–0.10m thick, is porous. Additionally, between the active layer and the ice there is a free space (0.02–0.10m high) in which water flows. The apron is also permeable by porosity. This area can therefore be considered a wedge-shaped aquifer. The aquiclude is permafrost, below the active layer.
The steep slopes located at the sides of the front central part can be considered as dome fronts. Many outlets (0.05–0.2m in diameter) emerge at regular intervals, and all at the same distance from the slope edge. The discharge occurs only during summer afternoons.
The central part of the snout is a cliff front. The progressive enlargement of the tensional cracks parallel to the fronts causes dry calving. While setting up stakes for measuring the cliff withdrawal, it was noticed that, during the warmest hours of the day, the crevasses were completely full of water. The water was still in the crevasses that were farther away from the cliff border, but moved in the others. In this case, therefore, ‘dry’ calving only means ‘not caused by sea action’. The calving is confined to the summer season. In fact, the cliff withdrawal that takes place during the summer is comparable to the annual flow speed of Strandline Glacier (Reference ZanonZanon, 1988; Reference Meneghel and SmiragliaMeneghel and Smiraglia, 1991b). Considering that the front is stable over time, (Reference CagnatiBaroni, 1988; Reference Chinn, Whitehouse and HöfleBaroni and others, 1995), it follows that, in winter, calving is totally inactive or barely active. The slope upstream from the cliff shows glacial veins. These result from the refreezing of stagnant water inside the crevasses (Reference MiglioreMigliore, 1999). The transformation of tensional cracks into glacial veins strengthens the cliff.
Methods of data collection
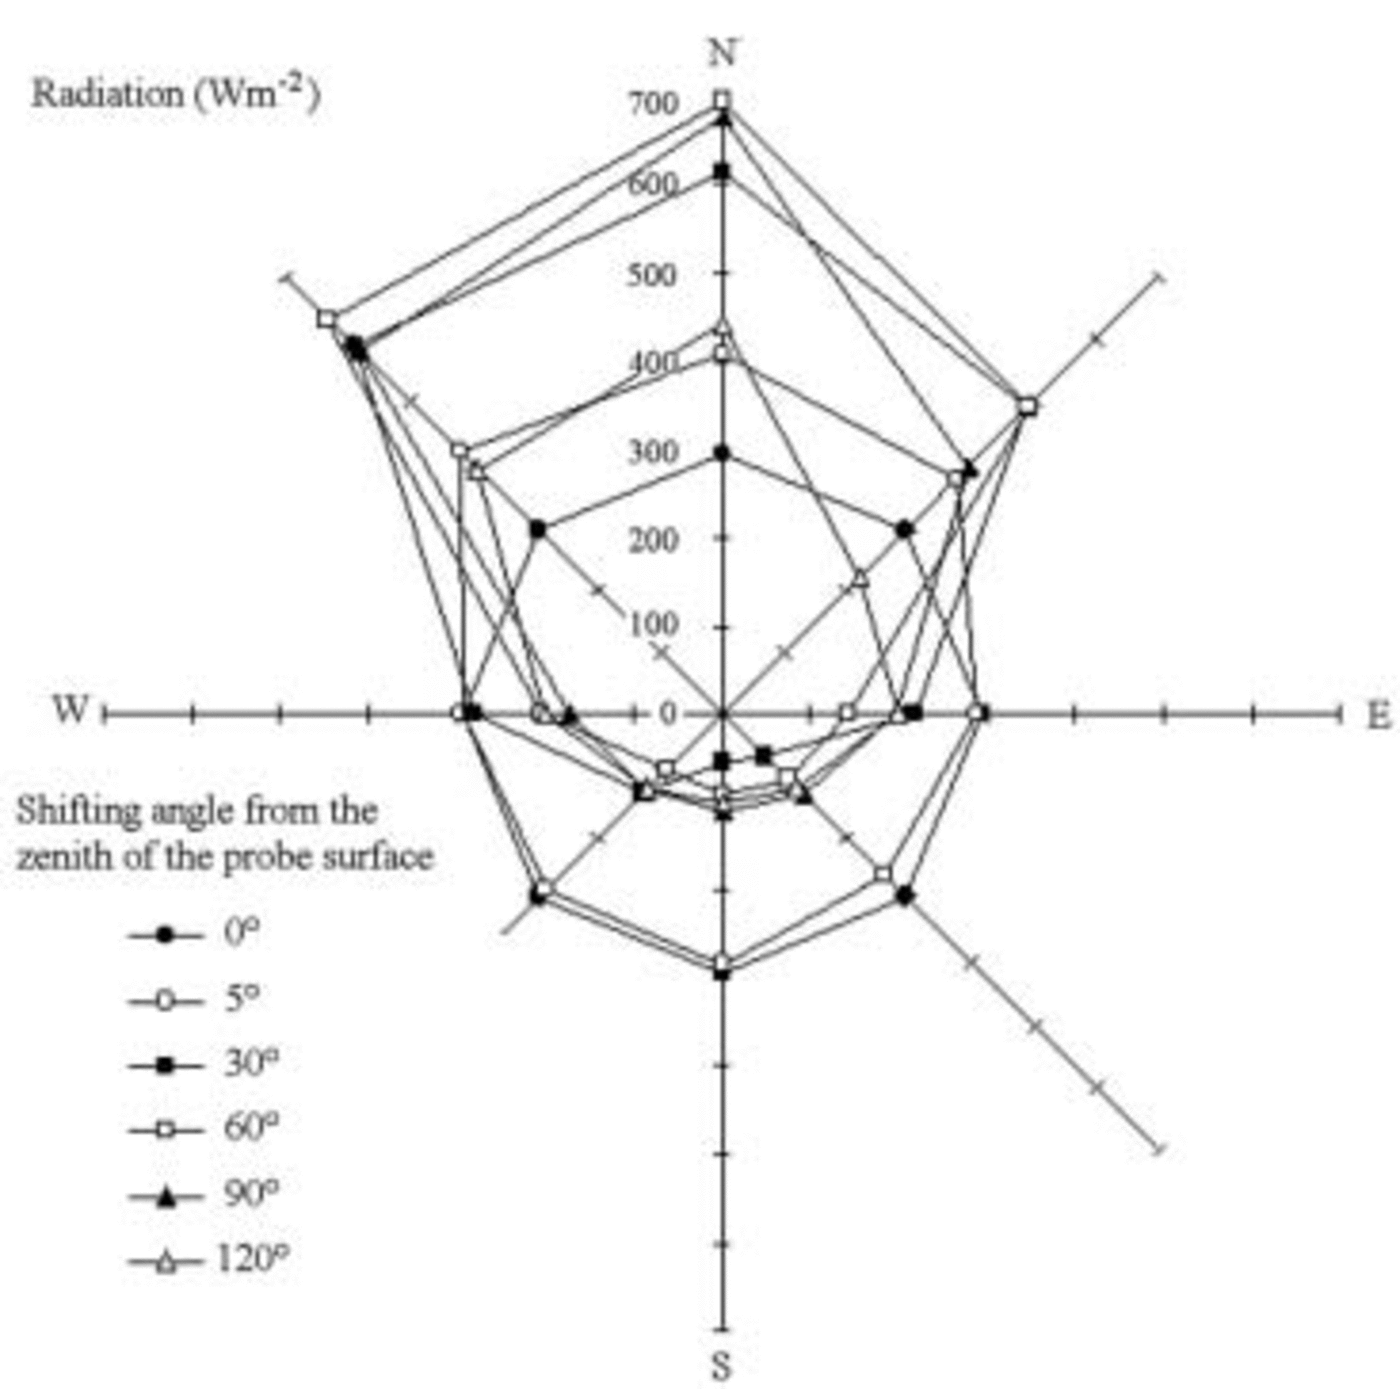
Temperatures recorded by Eneide, a climatic station near Strandline Glacier, rise above 0˚C during the warmest hours. We hypothesized that the glacier surface usually reaches melting temperature. To verify this, during the 2000/01 summer and from 28 December 2002 to 17 January 2003 (continuously from 3 January), we measured on the Strand-line temperature, melt, evaporation, and excess water related to effective porosity. We used the apron (a in Fig. 1). The exposure was northerly, with a 5˚ slope (Fig. 2). The following instruments were used:
Strandline Glacier. a: transition between a ramp and a dome front; b and d: dome fronts; c: cliff; e: ramp front.
Spatial distribution of 450–950nm radiation on Strandline Glacier, 17 January 2003, 1200 h. Sun 35˚ above the horizon, albedo 0.87.
Minidatalogger Testostor175 programmed to execute synchronized temperature surveys at –0.12 and 0m every 2 min.
Lysimeter A, made of polyethylene terephthalate (PET) with an absorption coefficient of irradiance of 24.0±0.5%, 0.12m high. It is fully immersed in the apron, and filled with an ice block taken out of the apron, having the same shape and, where there are imperfections, it is sealed up with excess material coming from the same block.
Lysimeter B, similar to the former, but the bottom has holes of 1 mm diameter to allow water drainage.
Data logger HD9071 with radiometric probes LP9021RAD (range 450–950 nm) inside a horizontal tunnel protected from light penetration by a light-gray PVC pipe. The probes measure the downward and the upward flux (Reference Liston, J.-G. Winther, Bruland, Elvehøy and SandListon and others, 1999; Reference Biancotti, Motta and MottaBiancotti and others, 2000) at 0.12 m depth.
Data logger HD9021 with radiometric probes LP9021-UVA (range 315–400 nm, probe set-up like LP9021RAD).
Ablatometric stake made of light-gray PVC, albedo similar to the ice surface. Measurements were taken upstream, downstream and on each side of the stake, and then averaged.
Every time the lysimeter data were collected, we measured albedo and snowpack specific weight with the International Classification for Seasonal Snow on the Ground (ICSSG) standard method (Reference ColbeckColbeck and others, 1990), and replaced the ice block, as the different drainage conditions of the two lysimeters point to the metamorphic evolution, especially the radius of the crystals, which affects radiation absorption (Reference WarrenWarren, 1982).
On the left side of the apron, two systems for collecting the meltwater naturally produced by the glacier were installed. One of them drained the water flowing within subglacial free space. The other drained the active layer. The collected water was measured at intervals of 10–120 s, in relation to the flux (minimum measuring errors).
Calculation methods
The calculation of the energy balance by lysimeters is complicated, as it is impossible to have exactly the same starting mass inside the two lysimeters. The following example explains the procedure followed. On 5 January, 20 g of mass were lost in lysimeter A (Table 1). This loss is due to evaporation only, as A retains the meltwater produced. According to a given proportion, 17 g must have evaporated in lysimeter B. In B, measured mass loss was 175 g; the water produced is 158 g. In proportion, 183 g of liquid water were produced in A. As the total quantity of water produced was just 160 g, it follows that 23 g were trapped in the snow.
Example of data obtained by the lysimeters (4–5 January 2003)

The energy balance (average of A and B) for melting is 8901 kJm–2, for evaporation 7250 kJ m–2. Total energy exchanged by melting is greater because the water inside the porous ice is frozen during the night, returning the melt energy absorbed.
Alternatively, the energy balance can be calculated indirectly, if the quantity of irradiance absorbed by the glacial surface is known. With good approximation (density slightly affects absorbed radiation; Fig. 3), on a surface which is large enough to allow boundary conditions to be disregarded, the radiation absorbed by lysimeters is equal to: R ass = R i – R e – D12 + U12, where R ass is the absorbed radiation, R i, R e are incident and emitted radiation at the apron surface, respectively, and D12, U12 are the downward and upward flux, respectively, at 0.12 m depth.
Correlation between density and 450–950nm radiation absorbed during the 24 hours (average) in snows having a radius of about 3 mm, and α = 68–70%. Surveys of 2–17 January 2003.

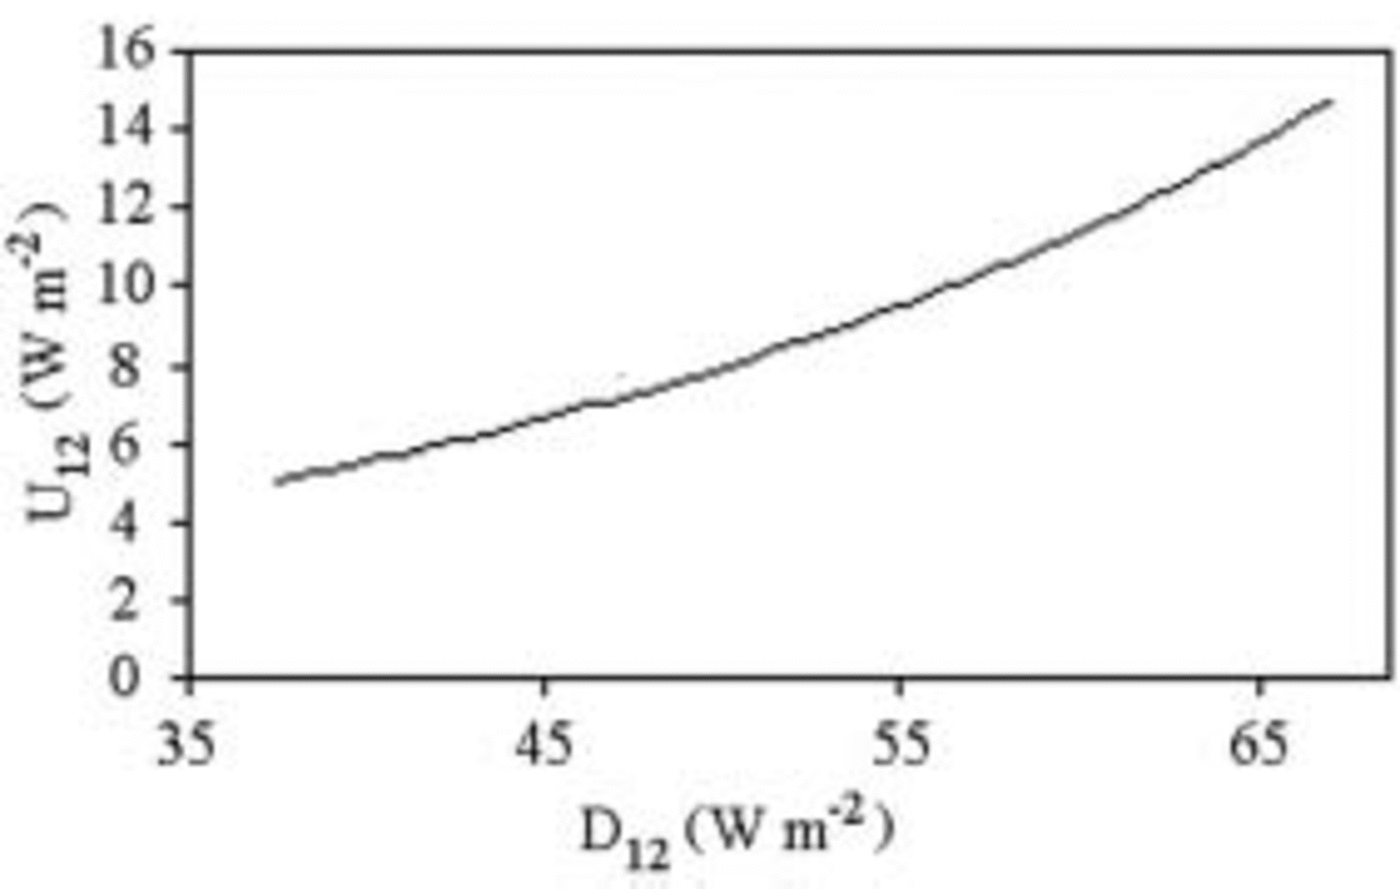
For a snowpack with constant thickness and sufficient size, the formula can be approximated to I = R i α – D12 +U12, where I (irradiance) is the power absorbed by a square meter. D 12 and U 12 can be disregarded in first approximation. D 12 is ≤1.5% of R i (Fig. 4). U 12 is less than one-seventh of D 12 (Fig. 5). This means that the process developing into the lysimeters represents at least 98% of the melting process.
Per cent of irradiance at 0.12 m depth. Average of period 2–17 January 2003.

D 12 vs U 12. Average of period 2–17 January 2003.
While the lysimeters were working, the radiometers measured I. The energy values absorbed in the same period as the previous example were 8.35–18.14 MJ in the visible and infrared (IR), and 0.26–0.34MJ in the ultraviolet (UV), according to the co-albedo used, which ranged between 28% (snow) and 40% (ice). The energy balance was therefore 8.6–18.5 MJ. These results are comparable to those yielded by the lysimeters, and the co-albedo increases approximately proportionally to density: the capacity to absorb solar energy increases with density.
Finally, the ablatometric stake can calculate melting and evaporation. While the lysimeter was working, the surface dropped by 25 mm. According to the density of the shallow snow, this value corresponds to 11.2 kg m–2. Calculating a proportion with the quantity evaporated and melted into lysimeter B, one obtains 1.09 kg m–2 evaporated and 9.48 kg m–2 melted. This value corresponds to an energy income of 5723 kJ m–2, which is definitely lower than the values calculated above. The explanation is that at the apron surface, measured by the stake, evaporation (and therefore energy absorption) is proportionally higher than in the first 12 cm of depth as measured by the lysimeter.
While calculating the value of ablation, deep-density variations, up to the aquiclude, can be considered in addition to surface ablation. As the proportion between melted mass and evaporated mass is unknown, it is only a mass balance, not an energy balance.
Results
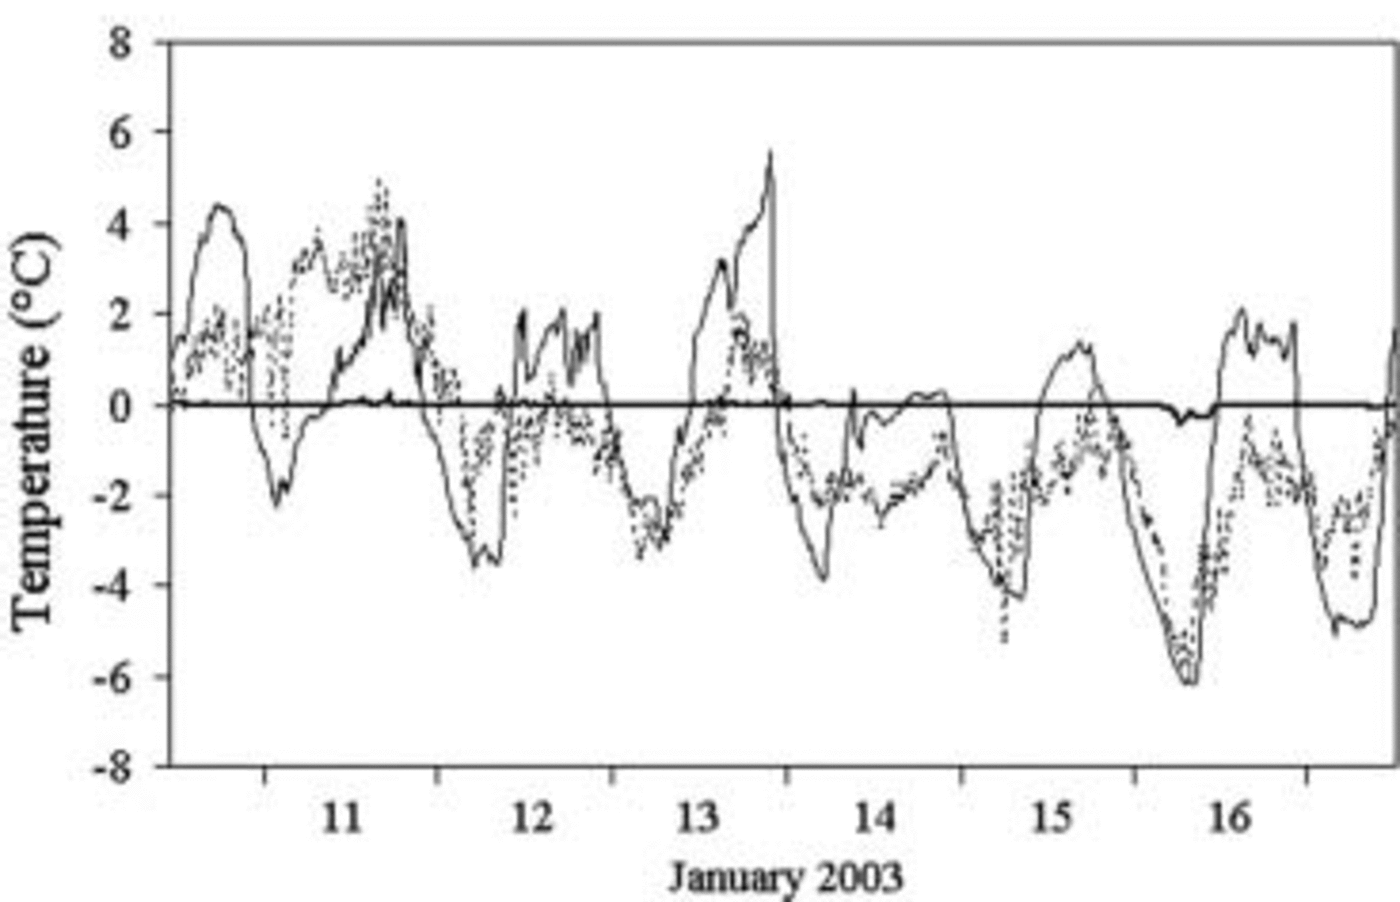
On a day with good weather (Fig. 6), the glacier surface stays below 0˚C for <9 hours, and the length of this period decreases quickly with the increase in depth so that at 12 cm depth it is <4 hours. Hence, temperature variations per hour are reduced to ±1˚C.
Temperature measured every 2 min during good (a) and bad weather (b) on the surface and at 0.12 m depth. The probes are sheltered from direct sunlight. They are affected, however, by radiation diffused sideways into the ice and by radiation coming from the screen protecting them. If it is at melting point, the probe records a temperature ranging between +0.48˚C and +0.24˚C depending on radiation conditions.
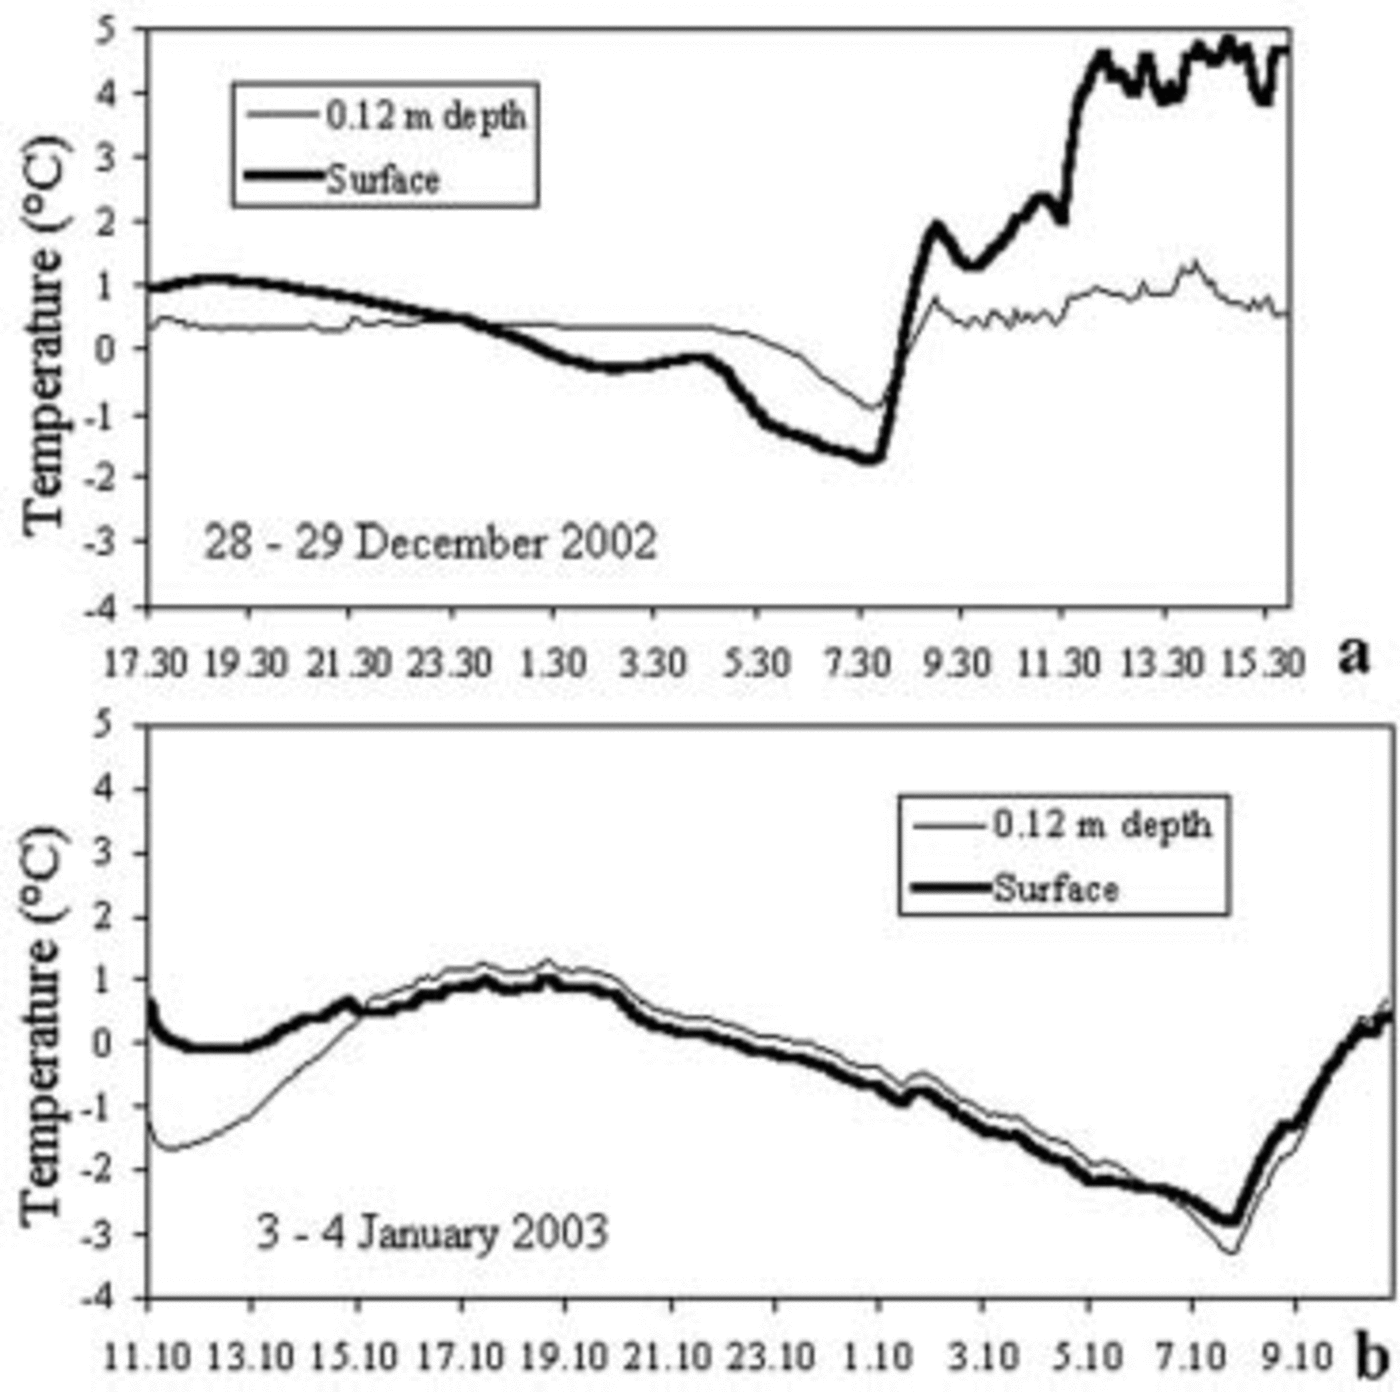
Surface ice temperature shows strong daily fluctuations (Fig. 7). Only the most negative peak, when the surface temperature drops below –6˚C, was measured, and found to be extremely subdued, at 0.12m depth. Apart from this episode, the ice constantly remains at melting point.
Temperature trend at Eneide (air, dashed line) and at the Strandline Glacier surface (thin line) and 0.12 m depth (thick line). Highs and lows are more pronounced on the Strandline (slope with northerly exposure) than at Eneide (flat surface). Therefore the Strandline melting does not depend on a particular microclimate. Hence, it can be assumed that similar processes also take place on the other glaciers of Terra Nova Bay.
According to daily values recorded by the experimental field, in the period 3–17 January 2003 the ratio between melt and evaporation averaged 23.2 (Fig. 8): melting is the most important cause of ablation. Evaporation and melt increase greatly in the presence of katabatic wind, as occurred on 11 and 12 January. So, the katabatic winds along the coast of Terra Nova Bay cause ablation on the frontal zone, even when it snows during the day (11 January). On 14 and 16 January, cloudiness, low air temperature, and cold wind for the 16th, caused a drop in melting, so discharge was nil.
Daily values of melt, evaporation, superficial and total ablation recorded in 2003. Melting and evaporation refer to the lysimeters, surface ablation to the ablatometric stake. Global ablation is the balance of density variations of the snow and surface ablation.
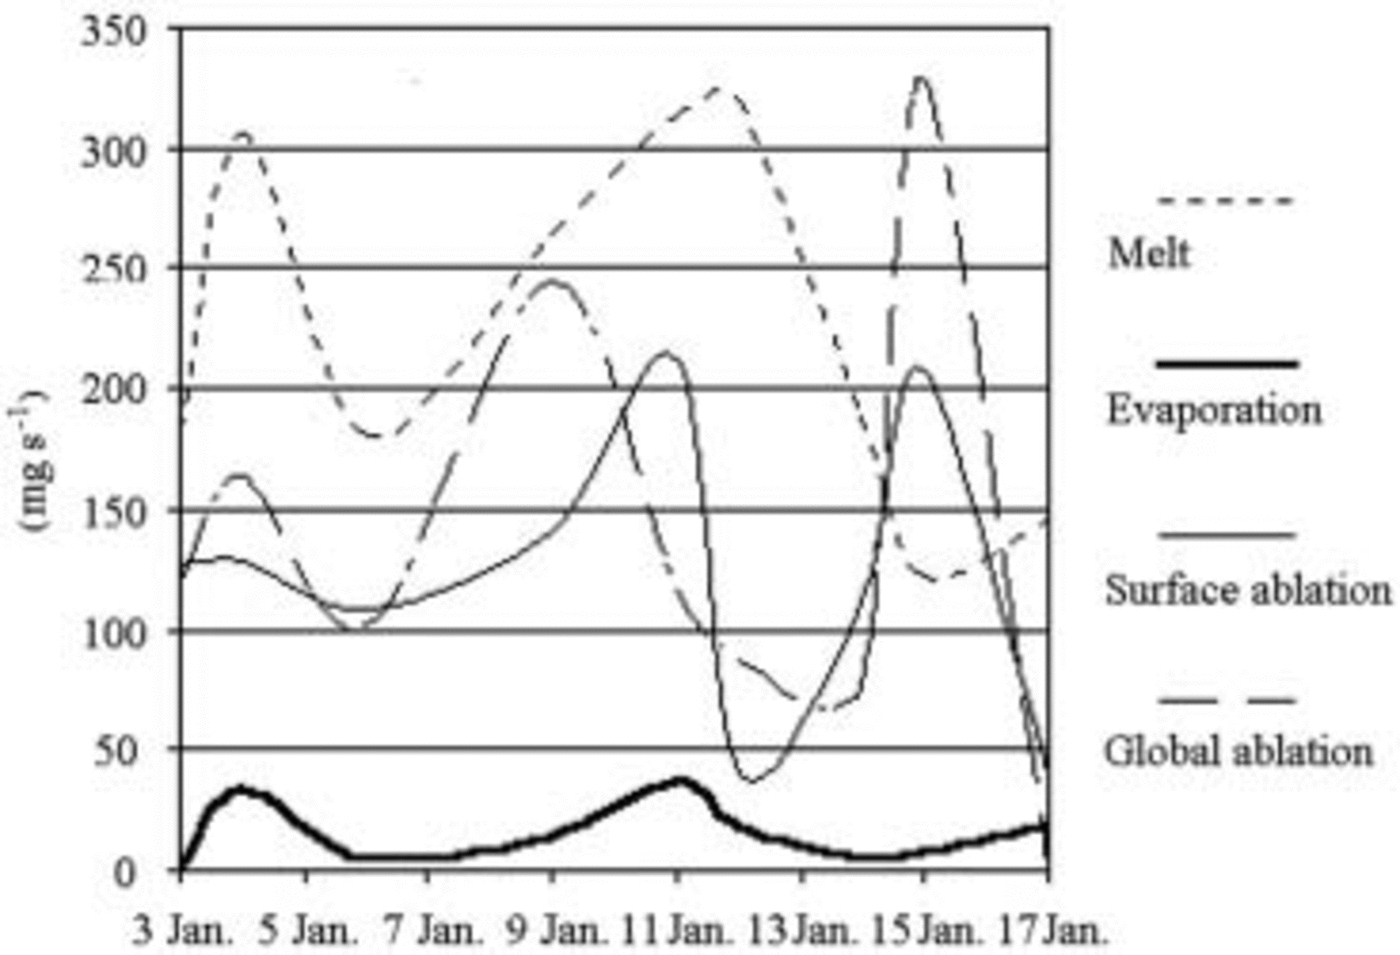
The loss of mass due to total ablation, on average, is larger than surface ablation, but smaller than the sum of melted and evaporated water. This suggests refreezing processes at greater depth.
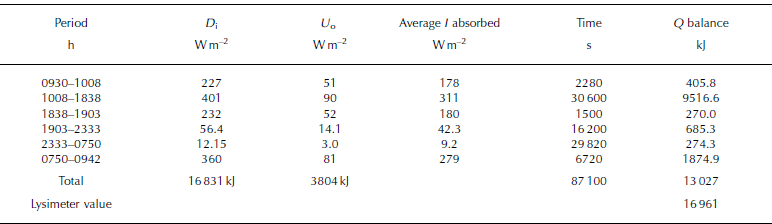
While the lysimeter was working, the difference between absorbed and outgoing radiation was also measured (Table 2). The radiative balance represents only 77% of the energy exchange ongoing with the lysimeter. This is partly due to technical causes, such as the tendency of lysimeters slightly to overestimate the absorbed energy because of PET’s radiation absorption. But the main reason probably stems from non-radiative heat exchanges (Reference Brandt and WarrenBrandt and Warren, 1997). These can be heat conduction from the air, warmed up by rocky slopes whose albedo is low at the sides of the ice (Reference Meesters and van den BroekeMeesters and Van den Broeke, 1997), and groundwater flow, when deriving, in part, from ice-free slopes around the glacier.
Radiative balance from 10 to 11 January when the lysimeter was operational. D i is incident downward flux, and U o superficial upward flux
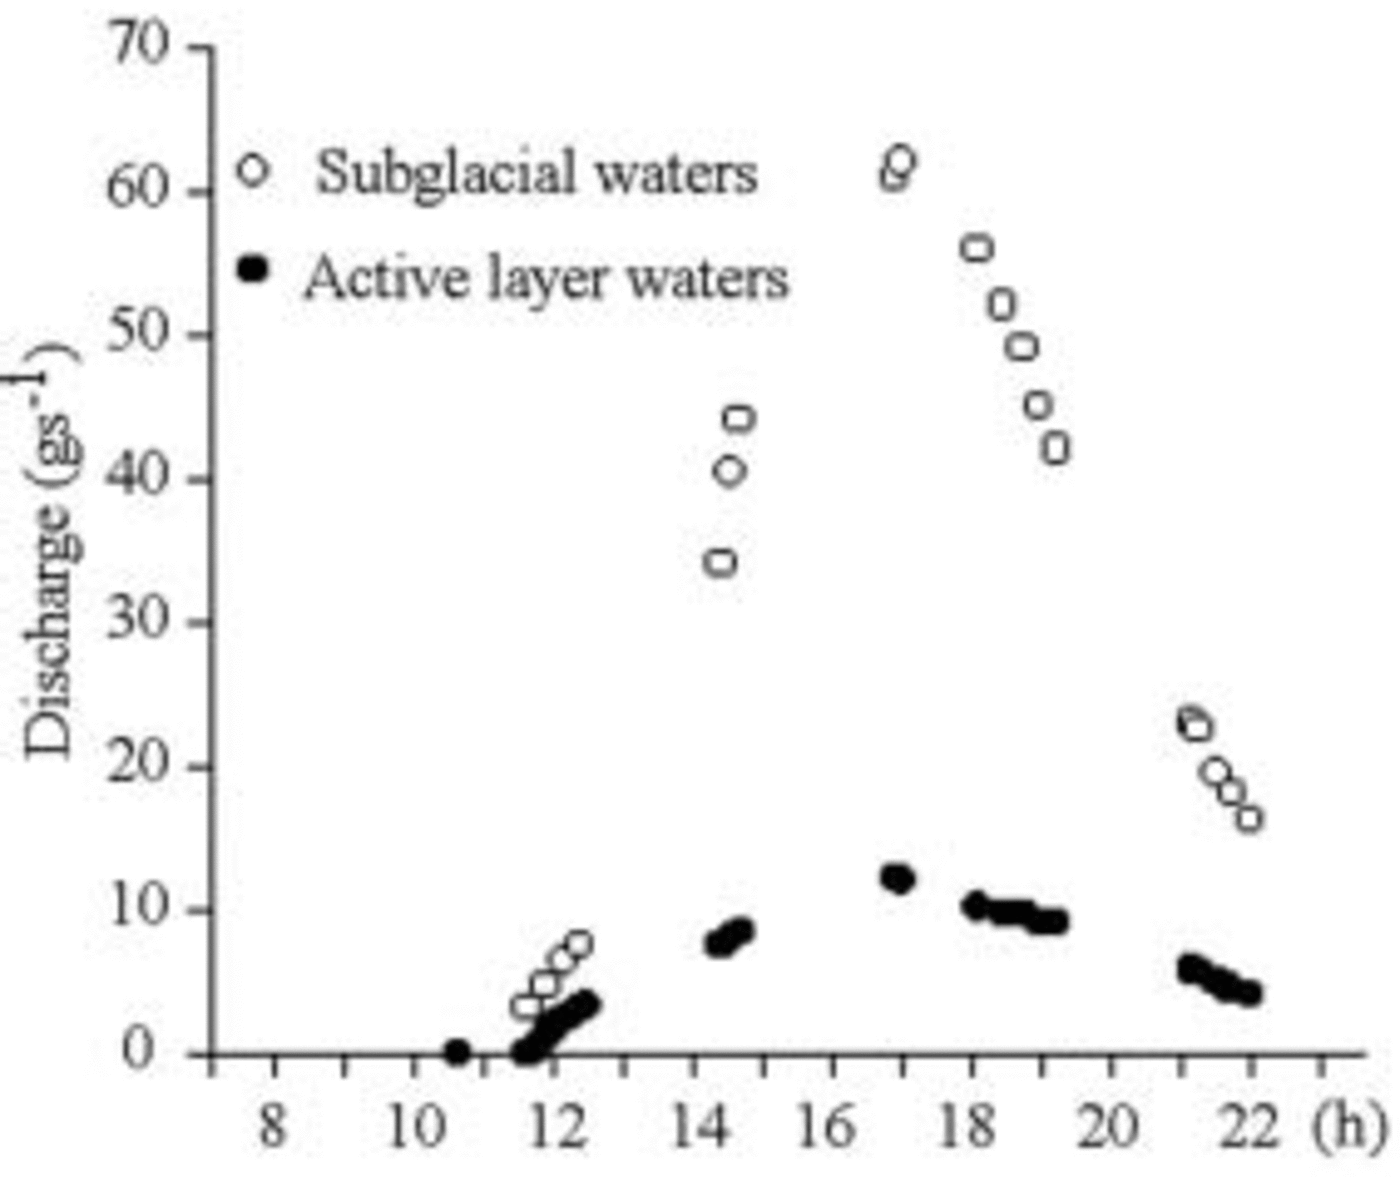
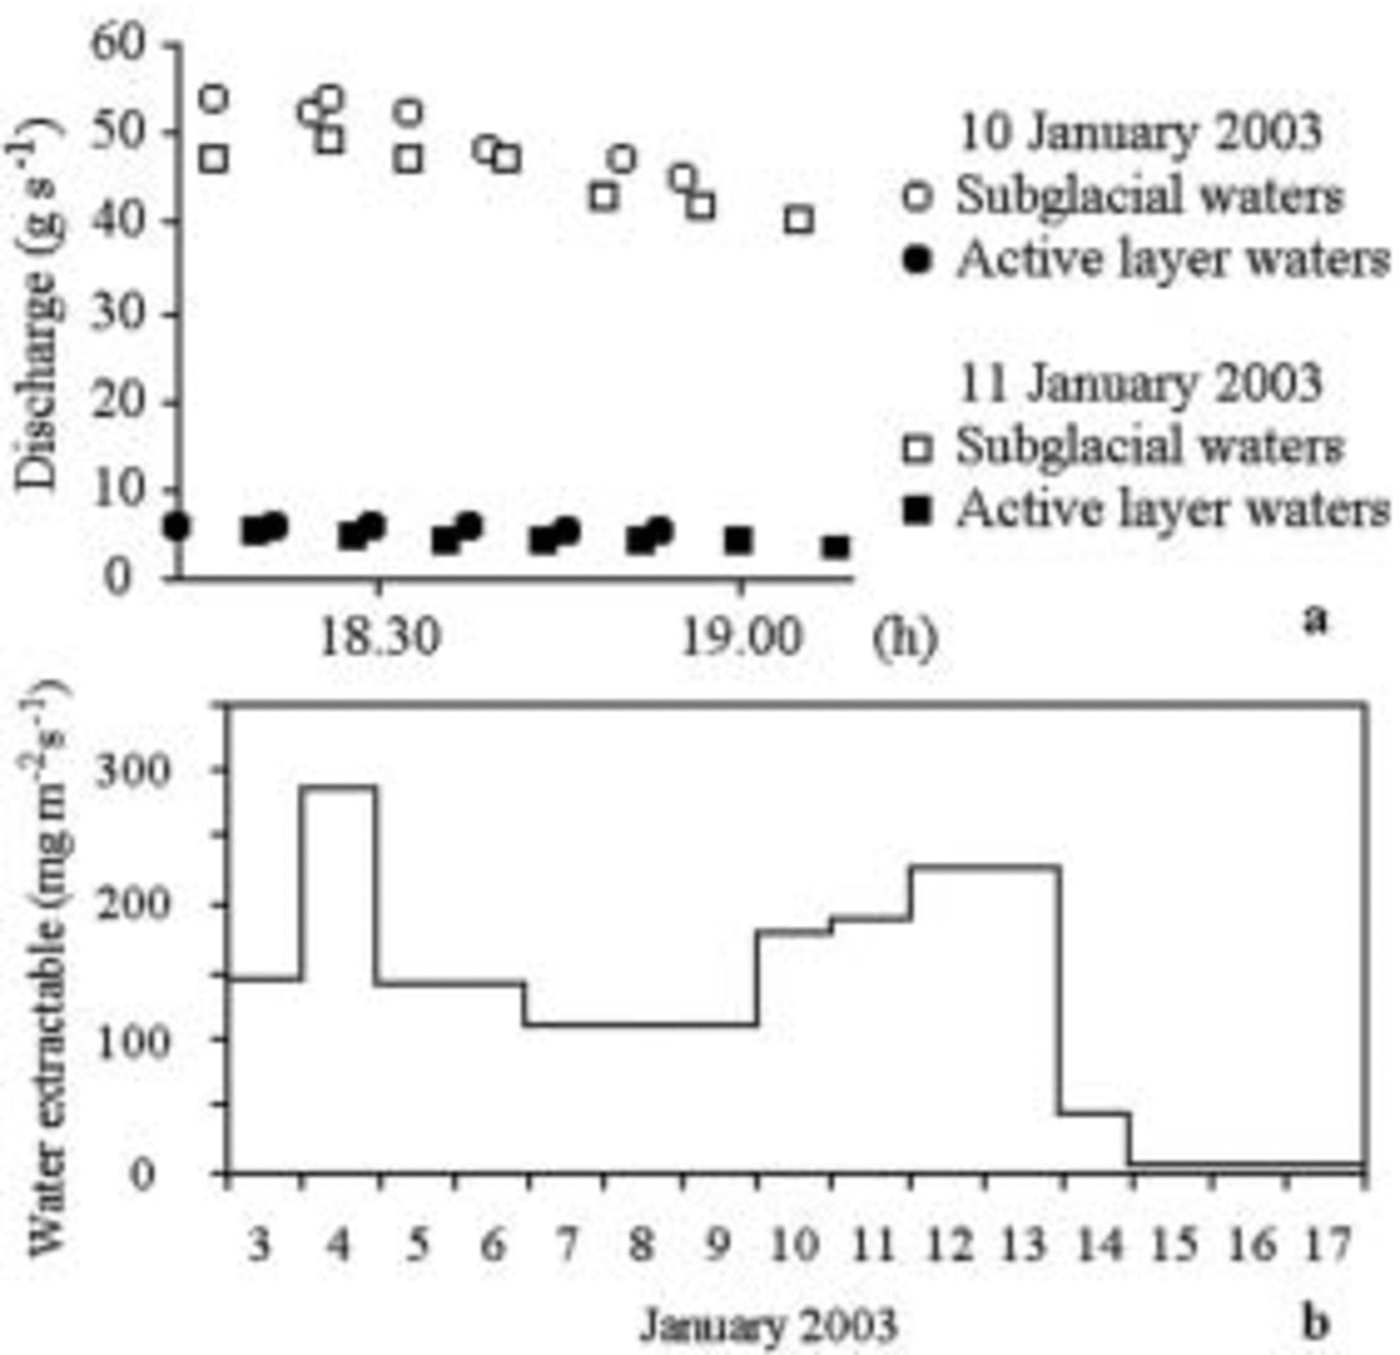
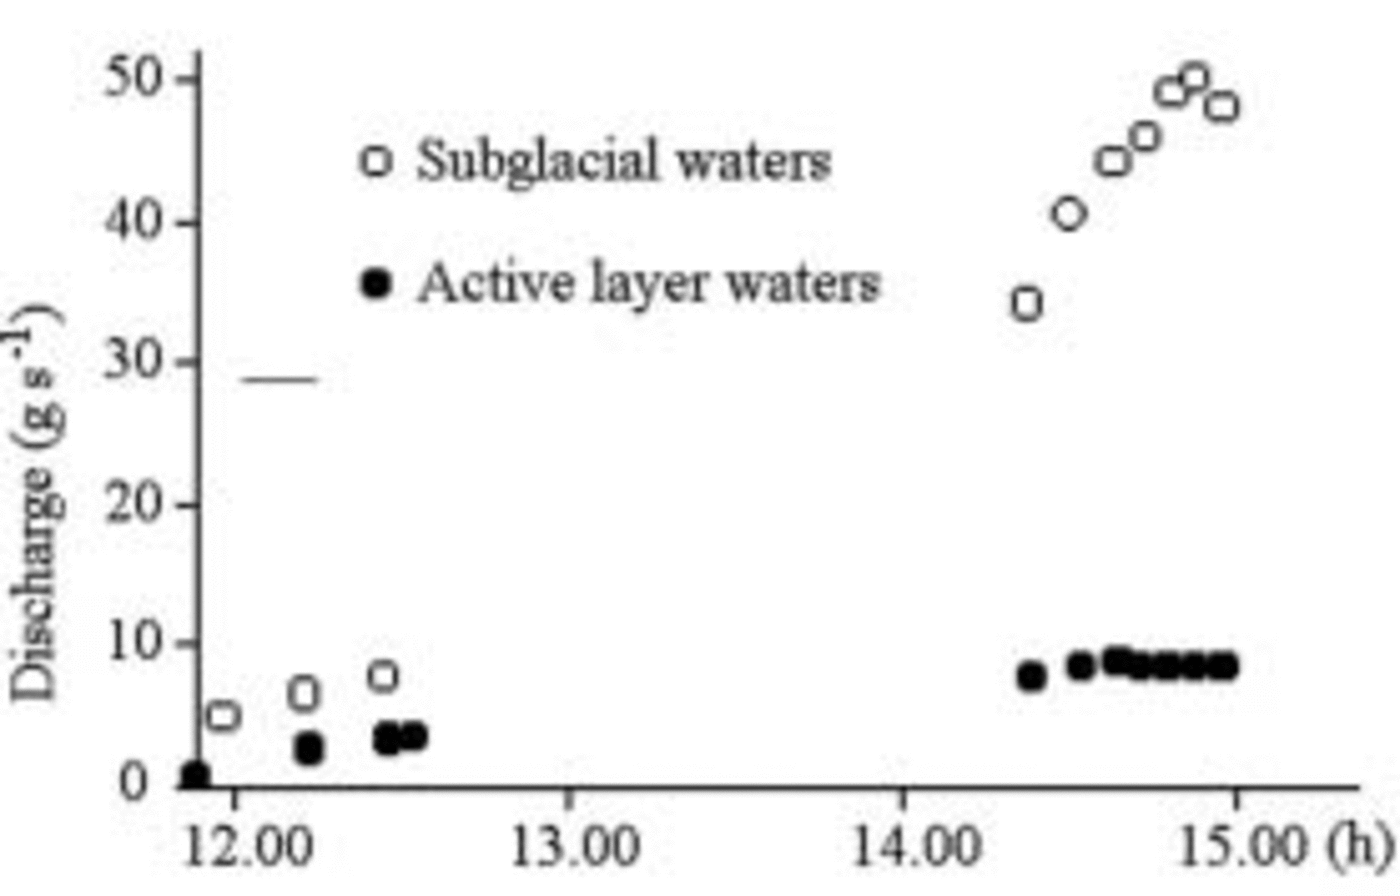
Figures 9–11 show that the maximum discharge of subglacial water is simultaneous, but 5–10 times greater than the discharge in the active layer; discharge is nil early in the morning and in fine weather, and rises rapidly between 1000 and 1200 h (Fig. 9). Discharge is fairly variable from one day to another. This does not seem to be related to the daily values of superficial ablation and of water exceeding the effective porosity (Fig. 10). It means that part of the subterranean water remains in the aquifer more than 24 hours. The flow of subglacial waters is affected by clouding after a few minutes: waters having a very short route within the aquifer influenced the flow (Fig. 11).
Discharge of 4 January 2003. There is no runoff early in the morning, as water saturates the porosity. Between 1000 and 1200 h, water starts to flow. The flow rises far more quickly in the subglacial waters. Both peaks are at 1702 h, about 5 hours after maximum radiation.
(a) Comparison between the exhaustion of the discharge during two consecutive days. (b) Water extractable by gravity from lysimeter A. The 10–11 January discharge decreases, whereas extractable water rises. On the 14th, water was extracted at the lysimeter, but discharge was nil at the collecting points.
Effects of clouding on the flow, at 1447 h, 5 January. The subglacial flow decreased a few minutes after the sun shading, while the water flow in the active layer remained constant. This shows that the medium lag between the input event and the output response of the subglacial water lasts a few minutes (short travel).
Discussions
At 12 cm depth, the ice constantly remains at melting point: this definitively demonstrates that the cause of any temperature fluctuations is external. The main source of energy required for melting is solar radiation (Reference SchlatterSchlatter, 1972; Reference Brandt and WarrenBrandt and Warren, 1993). The porous ice is not the only reason for absence of water on the glacier surface. Radiation is absorbed into a space whose thickness varies according to the transparency of the shallow materials (Reference Liston, J.-G. Winther, Bruland, Elvehøy and SandListon and others, 1999). On the Terra Nova Bay glaciers, 99% of the visible and IR radiation is absorbed into the first 16–25cm of depth (Fig. 12). Melting is fundamentally a shallow process, but not exclusive of the air–ice interface.
Percentages of absorption of downward flux recorded during 2000–01 and 2002–03. The measurement method used is the same as for Strandline Glacier. The trend is very similar in all ablation zones of the alpine local glaciers, snow-clad (Strandline, Crummer 1a, 1b, 2b) or with clean ice (Crummer 2a, Tarn Flat, Strandline). Reeves Glacier (an outlet glacier) blue ice and the seasonal snowpack (Eneide) are more transparent.

The aquiclude, despite being below 0˚C, does not cool visibly, even when external temperatures are at their lowest. This is certainly due to the great heat capacity of liquid water. Melted water may remain in the liquid state for several hours, generating the greatest runoff in the afternoon.
The discharge shows daily, hourly and more frequent fluctuations. The daily fluctuations are probably connected to weather variations (Fig. 7, 8 and 10). The lag between the input event and the output response is short, i.e. 5 hours on average. This shows that water comes mainly from shallow melting.
Some short fluctuations depend on cloudiness. The response time lag is of a few minutes (13 min in Fig. 11). This shows that most of the water originates near the front, and the apron is very permeable.
Comparison between our Data and Climatic Data
Strandline Glacier is situated very close to the Eneide meteorological station, equipped with a Kipp & Zonen CM11 pyranometer (spectrum amplitude 335–2200 nm, sensitivity 4–6 μVW–1μ2). The data provided by Eneide enable us to calculate the ratio between radiative energy and unit of surface area as well as the ratio between average irradiance (Fig. 13) for time intervals corresponding to the measuring intervals of lysimeters and radiometers (Table 3). Although there are slight differences due to the different range of radiations considered, the results are comparable to those of Strandline Glacier. Evaporation and melting do not absorb more than 30% of irradiance, whilst the rest of the energy is reflected or used to warm up the air above the glacier (Fig. 7). Melting has a 10–20% absorption percentage. Evaporation varies considerably (Fig. 14), but it stays below 15%, even though ice evaporation energy is much greater in relation to melting energy (cf. Reference Braithwaite, Konzelmann, Marty and OlesenBraithwaite and others, 1998).
Percentage of absorbed energy due to melt (thick line) and evaporation (thin line) at the lysimeters, assuming average irradiance measured at Eneide to be 100%.

Wind (1 knot = 1.85 km h–1) at the weather station Eneide. The katabatic winds alternate with very weak winds.

Table 3 shows the capacity of the lysimeters to absorb solar radiation. It is always lower than Eneide’s because of the difference in orientation. This difference decreases during the mid-day hours, and becomes great from 1903 h to 0750 h, at dusk. As albedo changes according to the height of the sun (Reference LliboutryLliboutry, 1964), the ratio between absorbed energy at the lysimeters and the energy per unit of surface area measured at Eneide is not proportional to the ratio between the irradiance connected with lysimeters and irradiance measured at Eneide.
Comparison between radiation measured at Eneide and incident radiation on the lysimeters

New Data on the Maximum Elevation of Melting
On 14 and 29 December 2002 and on 6, 9 and 13 January 2003, on M. Joyce Glacier (74˚08' S, 163˚10' E) and Crater Cirque Glacier (72˚38' S, 169˚22' E), active sub-superficial melting was found as high as 1200 –1300ma.s.l. We observed hollows, liquid water and micro-icicles at the base of the snowpack (Fig. 15). Air temperature was <0˚C, so the only possible cause of melting was solar radiation. Radiation and albedo were therefore measured on the surface and inside the cavities.
Sections of M. Joyce Glacier flat surface. Lefthand side shows two hollows: an expanded one below, and an upper one still developing. On the righthand side there is only one hollow, in the initial phase of development. D: downward flux. ICSSG abbreviations (Reference ColbeckColbeck and others, 1990).

Fifteen measurements showed that the layer of snow over the hollow absorbs 67.5–81.0% of the downward irradiance flux, while the remainder of the flux reaches the base of the hollow, made up of ice covered by 0.01–0.04m of rocky dust. The dust is black and its albedo ranges between 10% (dry) and 4% (wet). Therefore, the bottom of the hollows absorbs about 17–30% of the incoming solar radiation at the surface. Forty-two measurements taken at different times during the day show that the interior of the hollow, thermally insulated by fresh snow, progressively warms up to >0˚C during the warmest hours of the day. Part of the hollow’s top melts. When solar radiation decreases, refreezing water forms icy layers and icicles up to 0.07m long on the hollow tops. The main effect of this process is the speedy transformation of fresh snow into ice layers, resistant to wind erosion.
Conclusions
The distribution of melting along the coast of Terra Nova Bay is closely linked to solar irradiation and altitude. In glaciers like the Strandline, with a northerly exposure and an elevation of <210–220ma.s.l., melting is mainly a summertime ablation process. It is also synergetic with the other ablation processes: dry calving is facilitated by liquid water, while one of the main effects of katabatic wind on the coast is increased melting. At 0–100ma.s.l., shallow melting forms an aquifer in the glacier, inferiorly limited by an aquiclude, which can be the bedrock or permafrost. Flow follows solar radiation patterns with a delay of a few hours. From about 100 to 220ma.s.l., snow always undergoes melting in the summer, but water refreezes in deep layers. At 1200–1300ma.s.l., although air temperature remains below 0˚C even in the summer, melting can still occur if albedo is low enough. This is normal in local glaciers, where the wind often deposits dust from the surrounding de-iced areas. The final effect is not one of ablation but, on the contrary, of protection of the snowpack against wind erosion.



