Lacaune sheep originated in France and produce the milk used to prepare Roquefort cheese. This breed has become one of the world's highest-yielding ovine milk breeds, with average daily milk yields of 1·59 l and a total milk yield of 270 l over a 165-d lactation period (Barillet et al. Reference Barillet, Marie, Jacquin, Lagriffoul and Astruc2001). Since 1992, 17 countries have officially imported dairy Lacaune from France. In Spain, for example, the Lacaune breed produces a standard daily milk yield of 1·43 l compared with Manchega production of 0·75 l (Such & Caja, Reference Such and Caja1995). In our previous study, average productivity was 448 l over a 238-d lactation period in an intensively managed Lacaune flock (Hernandez et al. Reference Hernandez, Elvira, Gonzalez-Martin, Gonzalez-Bulnes and Astiz2011). In Canada, the productivity of the Lacaune is 330 l in the first lactation (lactation period, 220 d) and 392 l in the second and subsequent lactations (lactation period, 241 d; Regli, Reference Regli1999).
Production of Roquefort cheese is strictly regulated by legislation protecting Designation of Origin (AGRP0001838D); this legislation prohibits intensive milk production and mandates traditional management, which includes only one lambing per year (from October to January). Subsequently, the ewes are allowed to suckle for a 30-d period. Then ewes are milked and dried off in July or August, when dairy factories stop or reduce their activities. For producers outside the Roquefort Designation of Origin, who cannot charge the high prices of true Roquefort cheese, these production conditions are not cost-effective and intensive management is the only way to achieve profitable and sustainable farms. Since most ovine production systems include long suckling periods and are conducted according to Roquefort regulations (Barillet et al. Reference Barillet, Marie, Jacquin, Lagriffoul and Astruc2001), information about the dairy performance and milk yield of Lacaune sheep during complete lactation periods under intensive management is scarce. This information is of great importance to producers outside the Roquefort region.
Milk yield is affected by many factors, and dry period (DP) is one of the most often mentioned in the dairy production literature, particularly for dairy cattle (Wiggans et al. Reference Wiggans, VanRaden, Bormann, Philpot, Druet and Gengler2002). The dry period length (DPL) is crucial not only because it influences the productivity of the next lactation, but also because it affects the health of dairy animals. In dairy cattle, a large body of information attests to the effects of DPL on the productivity, health and physiology of individual animals, as well as on the collective profitability of the herd (Bachman & Schairer, Reference Bachman and Schairer2003; Grummer, Reference Grummer2007; Bernier-Dodier et al. Reference Bernier-Dodier, Girard, Talbot and Lacasse2011; Pinedo et al. Reference Pinedo, Risco and Melendez2011).
In contrast to the abundant information on DPL and productivity of dairy cattle, little is known about optimal DPL in dairy sheep, mainly because most ovine production systems are traditional and do not involve intensive breeding management, which means that they allow long suckling periods for the first period of the lactation (Gabiña et al. 1993; Fuertes et al. 1998; Barillet et al. Reference Barillet, Marie, Jacquin, Lagriffoul and Astruc2001; Morrissey et al. 2008; Ramón et al. 2010). Indeed studies that have examined the factors affecting milk yield and lactation curves have not measured DPL (Ruiz et al. Reference Ruiz, Oregui and Herrero2000; Peralta-Lailson et al. Reference Peralta-Lailson, Trejo-González, Pedraza-Villagómez, Berruecos-Villalobos and Vasquez2005; Oravcová et al. Reference Oravcová, Margetín, Peškovičová, Daňo, Milerski, Hetényi and Polák2006). Instead, authors have focused on lactation length, with two studies reporting that lactation length does not influence milk yields in the Israeli breeds Awassi and Assaf under intensive management (Gootwine & Pollott, Reference Gootwine and Pollott2000; Pollott & Gootwine, Reference Pollott and Gootwine2004).
Therefore, the present study aimed to investigate the optimal DPL in dairy Lacaune ewes under intensive management by evaluating the effect of DPL on reproductive performance and productivity of the sheep. These data should help us establish the most suitable and profitable management guidelines for DPL on dairy ewe farms.
Material and Methods
Animals and management
This study includes data on milk production from 8136 lactations of 4220 Lacaune sheep on a single farm for the period 2005–2010. The first lambing was recorded on 14 November 2005 and the last birth in the study occurred on 16 October 2010. Ewes belonged to a flock of approximately 4000 sheep on the Cerromonte Farm (Avila, Spain; continental climate, latitude of 40·90°N, altitude of 900 m). The original flock had been imported from the French Lacaune Association (Upra Lacaune Region of Aveyron) between 2005 and 2006. The data were recorded from the first lambing of the first imported group onwards. The environmental conditions of the animals remained approximately the same over the entire study period. Animal management on this farm has been described by Hernandez et al. (Reference Hernandez, Elvira, Gonzalez-Martin, Gonzalez-Bulnes and Astiz2011) and is summarized as follows. Animals are housed indoors. Food is rationed according to the sheep's production level and is based on corn, soybean and dry beet pulp, alfalfa, rye silage and wet brewers’ grain.
Reproductive management during 2005–2007 involved continuous mating and lambings. From 2008 through to the end of the study period, reproductive management included five mating periods per year, during which the different groups of ewes remained with males for 25 d to allow natural mating. Mating periods were adapted to the farm routines and occurred during the following intervals: period, 15 January–9 February; period 2, 9 April–4 May; period 3, 16 June–13 July 13; period 4, 27 August–21 September; and period 5, 5–30 November. Hence, lambing periods were the following: lambing period 1, 19 January–13 February; lambing period 2, 29 March–23 April; lambing period 3, 8 June–3 July; lambing period 4, 1–26 September; and lambing period 5, 10 November–5 December. The female:male ratio in these groups was 20:1. No synchronization method other than the ‘male-effect’ was applied to the mature sheep, since the males were present in the ewe stables only during the 25-d mating periods in order to allow natural mating. Lambing groups comprised approximately 1000 animals/group and included maiden sheep and ewes whose last lambing had occurred more than 50 d ago. Ewe lambs were mated for the first time between 8 and 10 months of age. Maiden sheep underwent oestrus synchronization for 14 d by intravaginal insertion of progestagen-impregnated sponges (40 mg fluorogestone acetate, FGA, Chronogest®, MSD Animal Health, Boxmeer, Netherlands); on the day of sponge removal, 400 IU of eCG was administered (Folligon®, MSD Animal Health, Boxmeer, Netherlands). Starting 36 h later, females were exposed to rams and natural mating was allowed for 25 d. In these synchronized mating groups, the female:male ratio was 5:1. From 2009 until the end of the study period, approximately 25% of pregnancies were achieved by artificial insemination using frozen semen of purebred Lacaune rams. Insemination was performed only in maiden sheep. Pregnancy was diagnosed by transabdominal ultrasonography in all sheep 35–60 d post-mating. The mean age at first lambing was 432·9±78·8 d (14·4 months). The ewes were mated again approximately 50–140 d after lambing.
The day after lambing, ewes were milked twice a day until milk production dropped below 0·5 l/d or until 30 d before the next lambing, when they were dried off without pharmacological dry-off treatments. Exceptions to the rule of a 30-d dry period occurred when farmers either shortened the lactation in order to ensure the formation of complete lambing groups of 1000 animals, or shortened the dry period when ewes gave exceptionally high milk yields. The flock was managed in ‘lambing groups’ of approximately 1000 ewes/group. This allowed a broad range of DPLs (i.e., involuntary DP lengths), even though the farmers' objective was to control the DPL in each group. No suckling period was allowed, since the lambs were raised completely artificially.
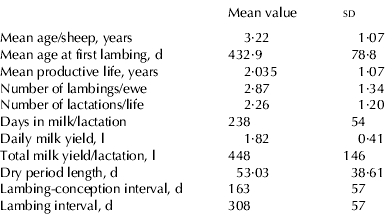
Performance records were collected, stored and validated using on-farm Alpro Windows software (DeLaval, Tumba, Sweden). Over the entire period, we analysed data from a total of 8136 lactations, from lactaions 1–7. Data from the fifth to seventh lactations were not included for further analyses, owing to the low number of records compared with those of the other lactation numbers. Only the mean flock performance from 2005 to 2010 (Table 1) included all lactations (1–7) from the ewes with complete productive life cycles (n=3088), in order to describe accurately the scenario of the studied flock.
Mean flock performance for 2005–2010, including only ewes with complete productive life cycles (n=3088)

Experimental groups and endpoints
In Part I of the study, the factors and circumstances that influence DPL following the current lactation were examined. Complete data on the total milk yield (MY), daily milk yield (DMY) and the lambing-to-conception interval (LC) were available for a total of 6762 lactations: 2924 first lactations, 1969 second lactations, 1292 third lactations and 577 fourth lactations.
Five experimental groups of lactations were defined for Part I of the study:
-
• DPL-XS (very short, n=1161): a dry period lasting 1–30 d
-
• DPL-S (short, n=3542): a dry period lasting 31–60 d
-
• DPL-M (medium, n=853): a dry period lasting 61–90 d
-
• DPL-L (long, n=342): a dry period lasting 91–120 d
-
• DPL-XL (very long, n=864): a dry period lasting more than 120 d.
Mean DPL for the five experimental DPL groups were as follows: DPL-XS, 17·8±10·7 d; DPL-S, 45·4±7·9 d; DPL-M, 72·3±8·9 d; DPL-L, 103·5±8·9 d; and DPL-XL, 187·5±61·8 d.
In Part I of the study, MY and DMY refer to the milk yield in the same lactation of the dry period under study, i.e., the milk yield just before the animal was dried off. Similarly, LC refers to the interval between the last lambing and conception, both prior to the dry period under study (Fig. 1).
Diagram outlining which lactation before or after the dry period was studied in Parts I and II of the study

Seasonality was taken into account by classifying the lambings according to lambing period and analysing whether there were statistically significant differences in DPL for the same lactation for different lambing periods. The significance of these differences was assessed by Kruskal–Wallis test, because data did not show a normal distribution. When no significant differences were observed, data were grouped by experimental groups.
In Part II of the study, the influence of previous DPL (P-DPL) on the next lactation was examined (Fig. 1). A total of 4318 complete lactations followed by the next lactation were analysed: 2176 first P-DPLs followed by a second lactation, 1470 s P-DPLs followed by a third lactation, 672 third P-DPLs followed by a fourth lactation.
Five experimental groups of lactations (P-DPL-XS, -S, -M, -L, and -XL) were defined based on P-DPL using the same dry period ranges as in Part I of the study. The mean P-DPL in each group was as follows: P-DPL-XS, 17·8±10·6 d; P-DPL-S, 44·24±8·0 d; P-DPL-M, 72·5±8·8 d; P-DPL-L, 103·6±8·3 d; and P-DPL-XL, 187·0±59·9 d.
In Part II of the study, MY and DMY refer to the milk yield in the lactation following the dry period under study (described by P-DPL), i.e., the milk yield of the subsequent lactation after the dry period. Similarly, the lambing-to-next conception interval (LNC) refers to the interval between the lambing and conception following the dry period under study (described by P-DPL).
Figure 1 outlines which period before or after the dry period was studied in parts I and II of the current study.
The following information was recorded for each lambing/lactation: date of birth of the ewe, date of next lambing, date of dry-off, lactation number of the ewe, total milk production per lactation, days in milk and date of culling. Productive parameters were calculated in l milk/d (DMY) or per lactation (MY).
Reproductive parameters (expressed in days) were determined on the basis of the LC in Part I of the study, when the relationship between the DPL and LC in the same lactation was analysed, or on the basis of the LNC in Part II of the study, when the relationship between P-DPL and LNC in the next lactation was analysed. Mean fertility was calculated as percentage of pregnant ewes in each mating group.
Statistics
Data were analysed using SPSS® 19·0 (IBM, New York, USA). The statistical significance of differences in continuous parameters for more than two groups was assessed by analysis of variance (ANOVA), and either a Student–Newman–Keuls or a Duncan post-hoc test were performed to compare the differences within groups. Relationships between the parameters MY, DMY, LNC and LC and DPL, all considered as continuous variables, were assessed by Pearson correlation analysis. When data did not show a normal distribution, the significance of differences was assessed by the Kruskal–Wallis test.
Results
Flock performance
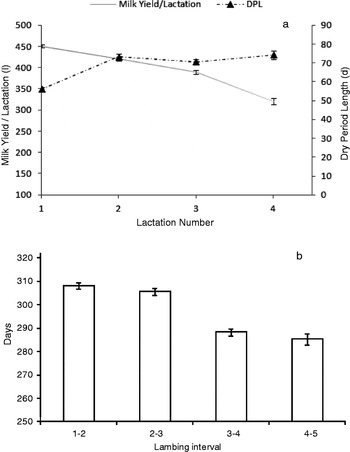
Productive and reproductive characteristics of the flock are summarized in Table 1 containing data for ewes with complete cycles (slaughtered or dead, n=3088 ewes) and Fig. 2. As lactation number increased, milk yield/lactation decreased, whereas DPL increased. Days between lambing intervals decreased as the sheep aged.
Milk yield/lactation (l), dry period length (DPL, d) and lambing intervals (d) per lactation, of the flock from 2005–2010. Data are shown as means±sem

The mean data for the 6762 lactations analysed (data from lactations 1–4, from all the ewes included in the study, not only with completed life), were a MY of 444±188 l; a DMY of 1·82±0·55 l/DIM (days in milk) and a mean LC of 157±67 d.
Mean fertility over the entire study period was 64% and the fertility for each mating period was 68·50% for the first mating period (January–February), 52·25% for the second (April–May), 53·50% for the third (June–July), and 73·50% for the fourth, and 72·25% for the fifth.
Part I: relationship between performance parameters and DPL following the current lactation
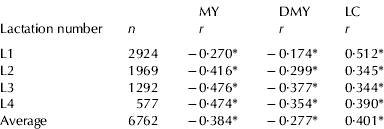
DPLs following each lactation were 56·1±53·2 d following the first lactation, 72·7±61·1 d following the second, 70·2±51·8 d following the third and 77·0±57·1 d following the fourth lactation. DPL was inversely correlated (P<0·0001) with MY and DMY for the first to the fourth lactation. No correlation was found between the birth-to-first conception interval and the first DPL (P=0·702). However, LC was positively correlated with MY (r=0·463, P<0·0001). DPL was positively and directly correlated (P<0·0001) with LC for the first lactation through the fourth (Table 2).
Estimates of Pearson correlation coefficients of milk yield (MY), daily milk yield (DMY) and lambing to conception interval (LC) with dry period length, per lactation and as average across the lactations (Average)

* P<0·0001
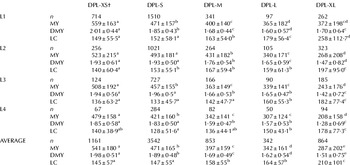
Table 3 summarizes the productive and reproductive parameters for the different lactation numbers and as a function of the DPL within the same lactation. Total MY and DMY were significantly larger among ewes with very short and short DPL (DPL-XS and DPL-S), than in the ewes with longer DPL (P<0·0001), when data from all lactations were considered together (Average; Table 3). The same trend was observed in each lactation number (L1–L4), with largest MY and DMY when DPL was shorter. Ewes with DPL-XS and DPL-S had shorter LC compared with ewes with DPL-M and DPL-L (P<0·0001), whilst the longest LC was observed in the ewes with the longest DPL (DPL-XL), when average data were considered (Average; Table 3).
Milk yield (MY; l) daily milk yield (DMY; l) and lambing to conception interval (LC; d) per lactation (L1–4)and as average across the lactations (Average) based on dry period length (DPL; d). Data are shown as means±sd

† DPL-XS=dry period length of 1–30 d; DPL-S=dry period length of 31–60; DPL-M=dry period length of 61–90 d; DPL-L=dry period length of 91–120 d; DPL-XL=dry period length of >120. Values without a common superscript are significantly different between columns and within rows (P<0·0001)
In order to investigate the influence of mating period, i.e., seasonality, on DPL, the DPL for each of the five lambing periods were compared with one another. DPLs for each lambing period were as follows: 59·9±50·6 d for January–February, 67·0±64·4 d for March–April, 70·1±62·7 d for June–July, 74·7±65·5 d for September and 62·8±48·9 d for November–December. These lengths did not differ significantly (P=0·115).
Part II: influence of previous DPL (P-DPL) on performance parameters of the following lactation
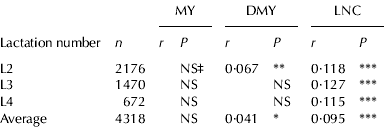
The possible influence of the P-DPL on the productive parameters of the next lactation was studied. Taking all data into account, P-DPL showed a slightly positive and highly significant correlation with the LNC (r=0·095, P<0·0001). This positive correlation was observed for the second, third and fourth lactations. No correlation was found between productive parameters MY and DMY and P-DPL for any lactation number, except for DMY in the second lactation, which showed a weak positive correlation with P-DPL (Table 4).
Estimates of Pearson correlation coefficients of milk yield (MY), daily milk yield (DMY) and lambing to conception interval (LC) with previous dry period length, per lactation and as average across the lactations (Average)†

† Data for the first lactation are omitted because there is no previous dry period
‡ NS=Non significant; ***P<0·0001; **P<0·001; **P<0·01; *P<0·05
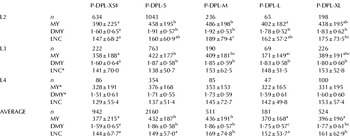
In order to detect non-linear relationships between the P-DPL and performance parameters of Lacaune sheep, lactations were analysed according to P-DPL. A total of 4318 second, third and fourth lactations were included in this analysis and classified by lactation number. Table 5 summarizes the productive and reproductive parameters of sheep classified into five P-DPL categories. LNC was significantly shorter among ewes with very short, short, and long P-DPL than in ewes with medium or very long P-DPL (P<0·0001) when data from all lactations were considered together (Average; Table 5).
Milk yield (MY, l) daily milk yield (DMY, l) and lambing to conception interval (LC, d) per lactation and as average across the lactations (Average) based on previous dry period length (P-DPL, d). Data are shown as means±sd †

† Data for the first lactation are omitted because there was no previous dry period
‡ P-DPL-XS=dry period length of 1–30 d; P-DPL-S=dry period length of 31–60 d; P-DPL-M=dry period length of 61–90 d; P-DPL-L=dry period length of 91–120 d; P-DPL-XL=dry period length of >120 d. Values without a common superscript are significantly different between columns and within rows (P<0·05). * P<0·05 by ANOVA test, but post hoc Duncan test could not detect significant differences between groups
Analysis of different lactation numbers showed that very short P-DPL in the second lactation led to the shortest LNC (P-DPL-XS, 147±68·2 d), while medium and very long P-DPLs led to the longest LNC (P-DPL-XL, 176±73·5 d; P-DPL-M, 189±79·4 d; P<0·0001). Ewes with different P-DPLs had significantly different LNCs in the third lactation, with the shortest LNC after the P-DPL-S. Although statistical significance among groups was detected through ANOVA-test (P=0·002), the Duncan test failed to detect significant differences among groups in the third lactation. P-DPL did not appear to affect LNC of ewes in the fourth lactation (P=0·09).
Taking into account data from all lactations together, very short, long, and very long P-DPLs led to less productive lactations, while short and medium P-DPLs led to the most productive next lactations (Average; Table 5). In the second and third lactations, we observed the lowest MY and DMY after a very short dry period (P-DPL-XS, P<0·0001) and the next lowest MY and DMY after long and very long dry periods (P-DPL-L and P-DP-XL). Maximal dairy productivity was observed in the lactation after a short P-DPL (31–60 d), and productivity was significantly larger than after P-DPLs of other lengths in the second and third lactations. Similar results were observed in the fourth lactations, but the differences between groups did not achieve statistical significance (Table 5).
Discussion
Optimizing management procedures to improve the productive and reproductive potential of a selective dairy breed such as elite Lacaune under intensive conditions may prove extremely useful for milk producers around the world. The present study offers the first detailed information on the influence of DPL on productive and reproductive parameters in Lacaune sheep maintained under intensive practices. The results indicate that the largest yields were achieved in lactations with the shortest DPLs. Similarly, the best LCs were observed in ewes with DPL-XS and DPL-S. Moreover, P-DPL of 30–90 d was followed by the largest lactation yields, while the shortest LNC was observed in ewes with P-DPLs of <30 d and 31–60 d. Therefore, a DPL of 30–60 d appears to be optimal for maximizing profitability on intensive Lacaune dairy sheep farms.
Lactations with the largest MY and DMY were followed by the shortest dry periods. This significant relationship was observed not only in the correlation analysis but also after analysing the averages of the lactations after grouping the animals by DPL. These results support the practice on the farm under study of drying off animals based on yield and pregnancy status. Ewes that have a DMY of 0·5 l/d or less, or that undergo the next lambing fewer than 30 d later, are dried off. In other words, less productive ewes are dried off earlier, regardless of the gestation period. At the same time, shortening the DPL extends the lactation period before dry-off, yielding additional milk (Bernier-Dodier et al. Reference Bernier-Dodier, Girard, Talbot and Lacasse2011).
The results described here indicate a direct relationship between LC and DPL after this conception, such that ewes that became pregnant earlier in the lactation period showed shorter dry periods. This may be another consequence of the farm's practice of intentional dry-off based on productivity. These findings are consistent with the practice on the farm under study of delaying conception in order to obtain more milk from these more productive ewes. This practice is supported by studies such as that of Pollott & Gootwine (Reference Pollott and Gootwine2004) linking earlier conception with a reduction in milk yield. These authors found early conception in Assaf sheep under intensive management systems to be associated with lower total milk yield, shorter lactations, less persistence and smaller peak yields.
Conversely, a longer post-partum period has been associated with greater milk production in Assaf and Awassi sheep under a variety of management conditions (Eyal et al. Reference Eyal, Lawi, Folman and Morag1978; Kassem et al. Reference Kassem, Owen and Fedel1989; Gootwine & Pollott, Reference Gootwine and Pollott2000; Pollott & Gootwine, Reference Pollott and Gootwine2004). Elevated milk yields at the beginning of lactation probably delay conception, owing to negative energy balance, as reported for dairy cattle (Butler, Reference Butler2000; Pryce et al. Reference Pryce, Royal, Garnsworthy and Mao2004).
Some results in the present study are contradictory. The longer the LC, the longer was DPL and the larger was MY (r=0·469, P<0·0001). At the same time, the larger the MY, the shorter was DPL. LC showed the strongest correlation with DPL in the first lactation (r=0·512, Table 2), while the correlations between DPL and yield variables were the weakest in the first lactation. From the second lactation onwards, LC did not significantly vary with DPL (Table 3). These results reflect the fact that the first lactation lasts the longest and is the most productive of all lactations, leading farmers to choose the moment of mating most carefully in first lactation ewes. It may therefore be in the first lactation when the negative relationship between yield and reproductive performance is most notable. Our study included a larger proportion of first lactations, which may explain the contradictory relationship between LC and MY; in fact, our study reinforces the usefulness of analysing the data according to lactation number. It also highlights the limitations of carrying out studies on commercial farms rather than under experimental conditions. Nevertheless, the large size of our data sample is likely to compensate partly for this bias.
Neither mating period nor lambing period was observed to affect the next DPL. This lack of influence may reflect the possibility that seasonality is not as strong in Spain as in other parts of the world. It may also reflect a genotype effect, since previous authors indicated that Lacaune sheep are less sensitive to photoperiod than are other dairy breeds like Assaf (Ramírez-Andrade et al. Reference Ramírez-Andrade, Salama, Caja, Castillo, Albanell and Such2008) and Manchega (Palacín et al. Reference Palacín, Abecia, Forcada, Casao, Cebrián, Muiño, Palacios and Pontes2008). Differences in fertility were observed, but they were not large enough to induce differences in DPL. In addition, the observed lack of a seasonality effect may indicate that management practices can mitigate influences from the environment. Sheep under intensive conditions are not affected by the seasonal variations in food availability and in thermoperiod that influence the performance of grazing animals (Finocchiaro et al. Reference Finocchiaro, van Kaam, Portolano and Misztal2005). Similar mitigation of seasonal variations has been achieved for dairy cattle using technology and management practices (West, Reference West2003; Flamenbaum & Galon, Reference Flamenbaum and Galon2010).
No, or very weak, linear correlations were observed between P-DPL and the productive parameters of the next lactation. Nevertheless, when the same analysis was repeated on subgroups of animals classified by P-DPL, differences in productivity appeared. The shortest P-DPLs (0–30 d) and the longest (>90 d) were followed by the smallest milk yields, while intermediate P-DPLs (31 and 90 d) resulted in the largest subsequent yields. These results are similar to those from studies in dairy cattle (Pinedo et al. Reference Pinedo, Risco and Melendez2011). Longer P-DPLs have been associated with poorer udder health status in dairy cows, which may be a reason for this reduction in productivity (Natzke et al. Reference Natzke, Everett and Bray1975; Pinedo et al. Reference Pinedo, Risco and Melendez2011). The lower productivity observed with short P-DPL in dairy cattle may be due to decreased mammary cell growth during the dry period; this decrease in growth is observed regardless of the P-DPL, which does not affect apoptosis or proliferation rates during the next lactation (Bernier-Dodier et al. Reference Bernier-Dodier, Girard, Talbot and Lacasse2011). Bernier-Dodier et al. (Reference Bernier-Dodier, Girard, Talbot and Lacasse2011) speculated that the cause of the lower milk yield in cows with shorter P-DPL was that lactating cows with shorter P-DPLs had higher prolactin concentrations during late gestation. This may be the reason behind the low productivity of Lacaune dairy sheep with shorter P-DPLs, but more research is needed to test these hypotheses.
The finding that intermediate P-DPLs gave the largest milk yield in the next lactation was not observed for all lactation numbers; it was most noticeable in ewes that had had short P-DPLs at the end of their first lactation. Similar results have been reported in dairy cows (Pezeshki et al. Reference Pezeshki, Mehrzad, Ghorbani, Rahmani, Collier and Burvenich2007; Watters et al. Reference Watters, Guenther, Brickner, Rastani, Crump, Clark and Grummer2008; Santschi et al. Reference Santschi, Lefebvre, Girard and Pellerin2009). Our study contained a high proportion of primiparous ewes, which may partially explain the substantial negative effect of the shorter P-DPL on milk production. Analogous results were reported by Bernier-Dodier et al. (Reference Bernier-Dodier, Girard, Talbot and Lacasse2011) in dairy cows.
We observed a positive linear correlation between P-DPL and LNC in the second, third and fourth lactations. The shortest LNCs were associated with very short and short P-DPLs (P-DPL-XS and P-DPL-S). Analogous results were found in a retrospective study in dairy cows, where the longest calving intervals were associated with the longest dry periods (>76 d; Pinedo et al. Reference Pinedo, Risco and Melendez2011). In fact, earlier studies in dairy cows reported better reproductive performance in cows with no planned dry period than in those subjected to a dry period of 60–75 d (Kuhn et al. Reference Kuhn, Hutchison and Norman2006, Reference Kuhn, Hutchison and Norman2007; Grummer, Reference Grummer2007; Watters et al. Reference Watters, Wiltbank, Guenther, Brickner, Rastani, Fricke and Grummer2009). One explanation for this relationship is that shortening or eliminating the dry period in dairy cattle may improve their energy status after calving, enhancing dry matter intake during the transition period. Indeed, this practice has been shown to affect fertility by decreasing the number of days until the first ovulation, increasing the rate of first service conception, decreasing the number of days open, and decreasing the percentage of anovular cows (Gümen et al. Reference Gümen, Rastani, Grummer and Wiltbank2005; Watters, Reference Watters2006; Grummer, Reference Grummer2007). This may also be true of Lacaune dairy sheep, but more research is needed to test this possibility.
Our study was conducted on an intensive commercial farm where intentional dry-off management is practised in order to sustain profitability. For determining when to dry off, the following criteria are applied on this farm, in this order: the need to complete lambing groups of approximately 1000 ewes/group, low daily milk yield (<0·5 l/d) and <30 d before the next lambing. Since the formation of complete lambing groups is the first priority, many ewes are mated or dried off regardless of their yield and/or time before lambing. This gives our data a certain degree of randomness with respect to milk yield and gestation day. Future studies should strive to control these and potentially other conditions of dairy ewes, such as body condition or health status, as has already been recommended for studies in dairy cattle (Sorensen et al. Reference Sorenson, Enevoldsen and Kristensen1993).
The present results provide the first detailed insights into the influence of DPL on the productivity and reproductive behaviour of dairy sheep. Our results show that very short or long dry periods in Lacaune dairy sheep negatively affect performance, similarly to what has been observed in dairy cattle (Bachman & Schairer, Reference Bachman and Schairer2003; Pinedo et al. Reference Pinedo, Risco and Melendez2011). Since the management practices used for this flock can be considered as representative of other Lacaune farms outside the Roquefort Designation of Origin, and indeed as common practices in the management of other dairy sheep breeds under intensive management, our results may be relevant to most intensive dairy sheep farms around the world.
Conclusion
This study indicates that in Lacaune dairy sheep, higher production (total milk yield and daily milk yield) is associated with shorter dry period in the same lactation. Ewes with a dry period of 30–90 d showed larger yields in the next lactation, while ewes with the shortest dry period (<60 d) showed the best lambing-to-next conception interval. Based on these results, we recommend 30–60 d as the optimal dry period length for Lacaune sheep under intensive conditions.
The authors would like to thank Frank Wallner for assistance with data collection; Antonio Gonzalez-Bulnes for his critical revision; the farm workers who managed the flock for their collaboration; and Pedro Cuesta and Iagoba Cano (Department of Research Support, Complutense University of Madrid) for statistical analyses.