Introduction
Boars synthesize high amounts of androgens, oestrogens and the pheromone 5α-androst-16-en-3-one (androstenone) in testicular Leydig cells (Claus and Hoffmann, Reference Claus and Hoffmann1980). Apart from their regulatory role in reproductive functions, androgens and oestrogens have a high anabolic potential. Androstenone has no hormonal activity but stimulates female reproductive functions as a pheromone (Reed et al., Reference Reed, Melrose and Patterson1974) and is mainly responsible for the unpleasant ‘boar taint’ (Patterson, Reference Patterson1968). To prevent this taint, male piglets are usually castrated surgically without anaesthesia shortly after birth, even though fattening performance, nitrogen retention and the ratio of lean to fat are inferior in barrows compared with boars. In recent years, castration without anaesthesia has become an important animal-welfare issue. Norway expects to ban surgical castration completely in 2009.
Currently, there are two approaches under discussion for the control of boar taint, which will not compromise animal welfare. The first is surgical castration with anaesthesia (Prunier and Bonneau, Reference Prunier and Bonneau2006; Thun et al., Reference Thun, Gajewski and Janett2006; Zöls et al., Reference Zöls, Ritzmann and Heinritzi2006). The second is the use of vaccines (immunological castration) to inactivate gonadotropin releasing hormone (GnRH), causing a drop of LH, a reduction of steroid synthesis and, consequently, decreased taint levels. FSH is reported to remain unchanged after immunization, probably due to a different regulation via the activin system (Li et al., Reference Li, Macdonald, Wise and Ford1998). Metz and Claus (Reference Metz and Claus2003) found that GH concentrations in immunocastrated boars remained at the same high level typically found in intact males. Normal barrows, however, have GH levels that are 31% lower than immunocastrates (Metz and Claus, Reference Metz and Claus2003) although steroid concentrations are low as in barrows. Thus, the mechanism that maintains GH in immunocastrates at a level typical for intact boars cannot be due to the feedback effect of steroids on GH secretion (Breier et al., Reference Breier, Gluckman, Blair and McCutcheon1989). Rather, it may depend on an interaction between GnRH and growth hormone releasing hormone (GRH) either in the hypothalamus or in the pituitary. In the pituitary, such an interaction may occur by cells that are thought to be able to synthesize GH and gonadotropins (Childs, Reference Childs2000; Childs et al., Reference Childs, Unabia and Wu2000). The hypothesis is substantiated by the infusion of GnRH in pigs, which led to an increase of LH by 86% but to a concomitant decrease of GH by 18%. Infusion of GRH in turn elevated GH by 78% and decreased LH by 16% (Claus and Weiler, Reference Claus and Weiler1994). Since immunization against GnRH leads to an inactivation of GnRH, a rise of GH might be expected. Barrows are an appropriate model to clarify this hypothesis because they have higher levels of GnRH and gonadotropins due to the absence of negative feedback by gonadal steroids compared to boars. Immunization against GnRH should then lead to a rise of GRH and GH. Because GH is known as the anabolic ‘master-hormone’, such a rise should also be reflected by corresponding changes of parameters that characterize an anabolic metabolism. Such a mechanism might also be of practical relevance to improve the growth performance of barrows.
Materials and methods
Study design
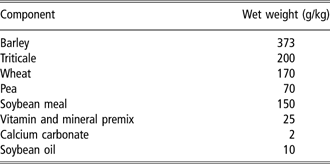
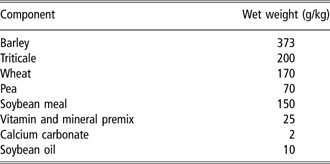
Experimental pigs were German Landrace barrows that had been surgically castrated at 1 week of age. The aim of the study was to compare groups of six immunized and six non-immunized barrows. Because the maintenance of catheters and animal welfare over prolonged periods require extensive care, it is not possible to keep 12 cannulated pigs at the same time. Consequently, the study was performed in two replicates where each replicate comprised three non-immunized barrows as controls and three immunized barrows. Care was taken to provide the same environment in the two replicates. For that reason, animals were kept under a constant light regime (12 h light : 12 h dark). Each pig was kept separately in an individual pen measuring 3 × 2.5 m, and fed twice daily at 0800 and 1500 h with 1.5 kg of a diet containing 16.7% crude protein and 13.5 MJ ME/kg (Table 1). The barrows were slaughtered at 28 weeks of age.
Feed composition
Immunization
Immunization was performed with GnRH, which had been linked to a glycoprotein carrier. This antigen is commercially available (Improvac®, Pfizer Animal Health, Parkville, Australia) and was administered in accordance with the manufacturer’ recommendations. The first 2 ml dose was given when pigs were 18 weeks old; a second 2 ml dose was given 4 weeks later at 22 weeks of age.
The control group was not injected because the adjuvant alone is not available. Furthermore, it is known that it does not lead to tissue reactions (Dunshea et al., Reference Dunshea, Colantoni, Howard, McCauley, Jackson, Long, Lopaticki, Nugent, Simons, Walker and Hennessy2001).
Blood sampling
For blood sampling, each barrow was fitted with a cephalic vein catheter under general anaesthesia at 17 weeks of age (BW range: 50 to 57 kg in replicate 1; 53 to 58 kg in replicate 2) as described earlier (Claus et al., Reference Claus, Bingel, Hofäcker and Weiler1990). Blood samples were drawn daily at 0900 h in heparinized vials and stored at −20°C after centrifugation.
Metabolic measurements
To determine body fat content, the deuterium oxide method was performed at an age of 20 and 25 weeks as described earlier (Claus et al., Reference Claus, Lacorn, Danowski, Pearce and Bauer2007). Protein synthesis was measured by 13C-leucine infusion at the day of slaughter as described below. For GH determination, additional samples (window sampling) were drawn for 24 h every 20 min at 19 and 24 weeks of age. Catheters were rinsed using sterile heparinized saline after each sampling. The whole experiment including the cannulation had been approved by the animal welfare committee of the state of Baden-Württemberg.
Analytical methods
GnRH–antibody titre
GnRH (Bachem, Weil am Rhein, Germany; 15.6 ng/well in 0.05 M carbonate buffer, pH 9.6) was coated on MaxiSorp microtitre plates (Nunc, Wiesbaden, Germany) for 1 h at 37°C under shaking. Blocking with testing buffer (overnight at 4°C) and washing steps have been described before (Claus et al., Reference Claus, Lacorn, Danowski, Pearce and Bauer2007). Plasma samples were diluted 1 : 1600 with testing buffer and 100 μl of each dilution per well was incubated for 2 h at 37°C. Thereafter, rabbit anti-swine IgG-horseradish peroxidase (P0164, Dako, Hamburg, Germany) was added at a dilution of 1 : 10000 in testing buffer and incubated for one hour at 37°C in the dark. Colour reaction and optical density determination were measured as described previously (Claus et al., Reference Claus, Lacorn, Danowski, Pearce and Bauer2007). Repeatability was determined using three different plasma samples from immunized boars with different known titres (n = 7). Interassay coefficients of variation were 24%, 9.4% and 3.6% for extinctions of 0.486, 2.754 and 3.903, respectively.
LH
Earlier determinations of LH in barrows were based on window sampling at 20-min intervals and led to an erratic pattern of LH concentrations (Metz, 2003). Because the diurnal pattern of LH was not relevant for this publication, we preferred to determine LH in samples taken at a standardized time over prolonged periods. Such a sampling regime was shown earlier to reflect major changes over prolonged periods without short-term fluctuation (Claus et al., Reference Claus, Lacorn, Danowski, Pearce and Bauer2007). LH in samples taken every third day during the whole experiment was measured by radioimmunoassay (RIA) (Wagner and Claus, Reference Wagner and Claus2004). The specific antiserum (AFP15103194) was kindly provided by Dr Albert Parlow (NIDDK, Torrance, CA, USA) and a highly purified pLH standard (AFP11043B) was used for radio-iodination and for calibration. The coefficients of variation within one day and between days were 6.8% (mean: 0.4 ng/ml) and 6.7% (mean: 0.37 ng/ml), respectively. The lower limit of sensitivity was 0.024 ng/ml. For determination of recovery, spiked samples were prepared, which reflect mean physiological concentrations. Thus the recovery for 0.5 ng/ml was 105% (n = 6).
FSH
FSH was measured in samples from every third day by RIA (Wagner and Claus, Reference Wagner and Claus2004). A specific antiserum (AFP2062096) was provided by Dr Parlow (NIDDK, Torrance, CA, USA) and a highly purified pFSH standard (AFP10640B) was used for radio-iodination and for calibration. The coefficients of variation within one day and between days were 3.3% (mean: 1.92 ng/ml; n = 10) and 9.2% (mean: 1.7 ng/ml; n = 5), respectively. The lower limit of sensitivity was 0.03 ng/ml and the recovery for spiked samples with 2.5 ng/ml was 105% (n = 6).
Testosterone
A specific RIA including a solvent extraction step was used as described earlier (Wagner and Claus, Reference Wagner and Claus2004) to measure plasma testosterone every third day. Antiserum against testosterone-3-carboxymethyloxime-BSA was raised in rabbits. Cross-reactivities with other steroids were 30% for dihydrotestosterone and 0.5% for dehydroepiandrosterone, whereas 17ß-estradiol, progesterone and epitestosterone showed cross-reactivities less than 0.1%. Repeatability was determined by measurement of spiked samples on consecutive days (n = 12) and the interassay coefficient of variation was found to be 8% for concentrations between 0.5 and 2.5 ng/ml. The lower limit of detection was 0.05 ng/ml. The average recovery after extraction was above 95%.
GH
Due to the pulsatile secretion pattern of GH, which is more important than the mean level, this hormone was determined in plasma obtained by window sampling. Determination was performed as described before (Claus et al., Reference Claus, Bingel, Hofäcker and Weiler1990). A specific antiserum (AFP422801) was kindly provided by Dr Parlow (NIDDK, Torrance, CA, USA) and a highly purified pGH standard (AFP10864P) was used for radio-iodination and calibration. The intraassay coefficient of variation was 9.3% at a concentration of 4.2 ng/ml (n = 10) while the interassay coefficient of variation was 10% (mean: 3 ng/ml, n = 6). Recovery was above 95% for spiked samples (1.5 to 6 ng/ml). Each GH profile was evaluated for pulses. The mean for all 74 samples per window for each animal was determined. A pulse was assumed when at least two consecutive GH concentrations exceeded this mean value by at least 50%. The maximal level was the mean of the maximal concentrations of these pulses. The base levels were calculated by the mean of the 14 lowest values. The frequency was defined as the number of pulses per 24 h.
IGF-1
Concentrations of IGF-1 were determined by a double-antibody RIA in daily plasma samples after HCl/ethanol-extraction using a specific antiserum raised in rabbits (Claus et al., Reference Claus, Weiler, Hofäcker, Herzog and Meng1992). The highly purified IGF-I standard was obtained from Gro Pep (CU020, Adelaide, Australia) and was used for radio-iodination and for calibration. Extraction yield was between 61% and 70% for samples spiked from 75 to 400 ng/ml (n = 9). The coefficients of variation within and between assays were 6.9% and 5.7% for concentrations of 186 ng/ml (n = 10) and 183 ng/ml (n = 9), respectively.
Urea
Urea in plasma was measured to characterize protein degradation and therefore nitrogen excretion. Determination was performed on microtitre plates as reported earlier (Claus et al., Reference Claus, Lacorn, Danowski, Pearce and Bauer2007). Intra- and interassay coefficients of variation were 8.9% (n = 10) and 9.7% (n = 14) at concentrations of 322 and 347 μg/ml, respectively.
Hydroxyproline
Total hydroxyproline (OH-Pro) in blood reflects collagen breakdown and thus catabolic mechanisms. It was measured using an HPLC method published before (Claus et al., Reference Claus, Lacorn, Danowski, Pearce and Bauer2007). Coefficients of variation were 2.7% (n = 10) for intraassay and 9.1% (n = 14) for interassay variations in samples containing 22.6 and 20.9 μg/ml, respectively.
Protein synthesis by infusion of 13C-leucine
Determination of protein synthesis by infusion of 13C-leucine is an established method (Waterlow et al., Reference Waterlow, Garlick and Millward1978). It is based on a constant infusion of leucine up to a constant equilibrium so that the maintenance of a plateau during ongoing infusion represents leucine used for protein synthesis.
To obtain background values for 13C/12C-enrichment, a sample of heparinized blood was taken before giving the bolus of leucine described below. A bolus of 30 mg l-[1-13C] leucine (Euroisotope, Saarbrücken, Germany) dissolved in 5 ml saline was administered intravenously, followed by continuous infusion at the rate of 30 mg/h for 6 h (150 ml/h) via the implanted catheter using a peristaltic pump. Blood samples were taken at 30 min intervals during the 6 h infusion period. To measure the exact concentration of leucine solution infused to each pig, an aliquot of 10 ml was taken from the residual solution at the end of the experiment, and all animals were weighed before slaughter. Leucine was isolated from plasma and derivatization was performed using the test kit EZ:faast (Phenomenex, Aschaffenburg, Germany). In brief, plasma samples were acidified by 1 M HCl (40 μl/100 μl plasma), amino acids were extracted by a cation exchanger, eluted and derivatized using propyl chloroformate. For quantification, norvaline was added as internal standard. GC-MS (GC-17A coupled to a QP 5050, Shimadzu, Duisburg, Germany) was conducted in the single ion mode (m/z 158 for internal standard, m/z 200 and 201 for leucine) under conditions described by the manufacturer of the test kit. For quantification of 13C-leucine in infusion solutions, an external standard containing 200 nmol/ml was processed as described above and the leucine content calculated using the internal standard, after which the infusion rate was estimated. To determine 13C-enrichment, peak areas for m/z 201 were related to m/z 200 and plotted against time of sampling. Intraassay coefficient of variation was 2.75%. Constant enrichment was obtained from 3 h to 6 h after onset of infusion and was used to calculate the total leucine flux together with the infusion rate (see above). For calculation, a percentage of 7.6% leucine in total protein was assumed (Waterlow et al., Reference Waterlow, Garlick and Millward1978; Eggum, Reference Eggum1989).
Total body fat content
Because GH primarily changes the lean/fat ratio, anabolic parameters are insufficient and the additional determination of body fat with the D2O method was included. Application of D2O, measurement of isotopic enrichment by infrared spectroscopy and calculations including coefficients of variations were published recently (Claus et al., Reference Claus, Lacorn, Danowski, Pearce and Bauer2007).
Statistics
Data were analysed using Statistical Package for the Social Sciences (SPSS v.13.0; Chicago, IL, USA). Data in figures are presented as means ± s.e. of six animals per group, with day 0 being the day of the first immunization and day 28 the day of the second immunization. In the tables, data for IGF-1, urea, OH-Pro and fat content are presented for two phases. Phase 1 comprised values from day 0 to day 27; phase 2 comprised values from day 39 to day 72 as similarly reported earlier (Claus et al., Reference Claus, Lacorn, Danowski, Pearce and Bauer2007). Days 28 to 38 were not included because of transient increasing or decreasing values due to the onset of immunization effects. Trend analysis was performed as described by Neumann (Reference Neumann1941) and Hart (Reference Hart1942). Changes in titre were tested as described previously (Claus et al., Reference Claus, Lacorn, Danowski, Pearce and Bauer2007). A linear mixed model with repeated measures was used to compare barrows and immunized barrows. Fixed effects (group and phase) and their interaction were tested for statistical significance. Replicate was included as a random effect. For none of the parameters investigated, a significant replicate effect was found (estimate of covariance parameter by the Wald test). Interactions were significant for FSH and antibody titres.
Results
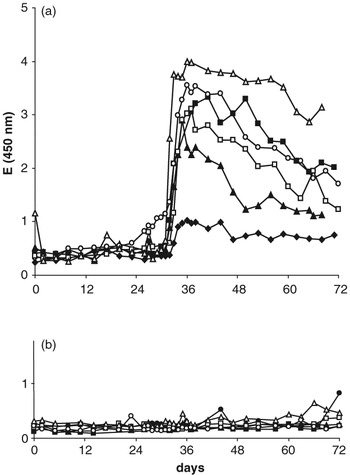
Changes in titre of antibodies against GnRH are shown in Figure 1a and b. In immunized barrows (Figure 1a), antibody titres rose rapidly and peaked seven days after administration of the second dose of Improvac. Titres then declined until the end of the study on day 72 after initial vaccination (P < 0.05; trend analysis). Nevertheless, on day 72, titres were still higher than they had been before the second immunization (P < 0.001). Differences between both groups and phases were highly significant. Control barrows (Figure 1b) had low extinctions around 0.3 throughout the experimental period, comparable to values in immunized animals before they were given a second dose of Improvac.
Antibody titre in immunized barrows (a) and control barrows (b). First immunization was on day 0 (18 weeks of age). Second immunization was on day 28 (22 weeks of age). Closed circles represent animals from replicate 2, open circles animals from replicate 1.

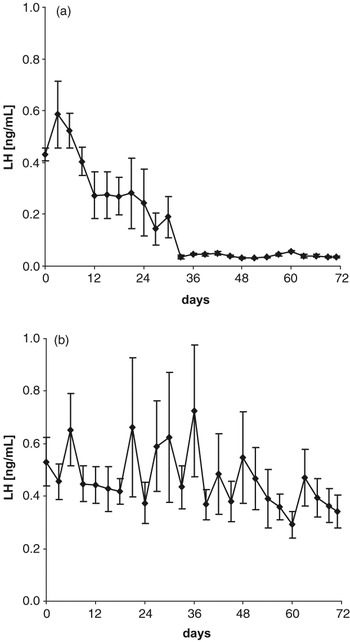
A decrease in LH to values near the detection limit within 5 days was observed after the second immunization (Figure 2a; P < 0.01). The decrease in LH between the first and second immunization was significant in four of the six pigs as shown by trend analysis (P < 0.05). Plasma LH in control barrows (Figure 2b) remained at about 0.5 ng/ml throughout the experiment.
LH concentrations (mean ± s.e.) in immunized barrows (a) and control barrows (b). First immunization was on day 0 (18 weeks of age). Second immunization was on day 28 (22 weeks of age).

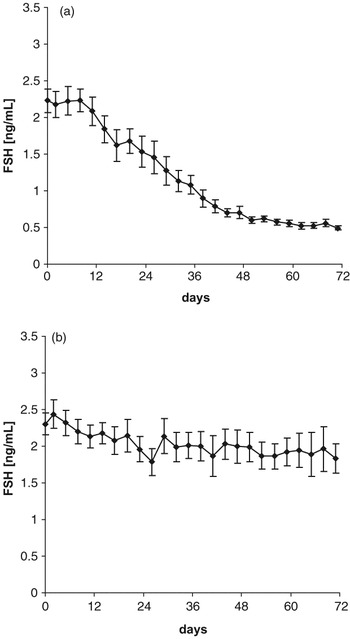
FSH determination (Figure 3a) revealed decreasing values already before the second immunization in five of the six immunized barrows (P < 0.05; trend analysis). After the second dose of the vaccine, FSH decreased from 1.3 to 0.5 ng/ml (P < 0.001) and remained at this level until the end of the study. Control barrows (Figure 3b) began with levels of about 2 ng/ml and these did not decrease significantly.
FSH concentrations (mean ± s.e.) in immunized barrows (a) and control barrows (b). First immunization was on day 0 (18 weeks of age). Second immunization was on day 28 (22 weeks of age).

Testosterone values in all animals remained below the detection limit of 0.05 ng/ml throughout the experiment (data not shown). There was no significant difference between vaccinated and unvaccinated barrows.
The GH parameters are given in Table 2. Mean GH concentrations decreased significantly (P = 0.01) from the first window at age 19 weeks (1 week after first vaccination) to the second window at age 24 weeks (2 weeks after the second vaccination) both in control barrows and in immunized barrows. The decrease was 18% in the control barrows and 22% in the immunized barrows. While maxima decreased in the same way (P < 0.015) the base levels remained unchanged. The pulse frequency was lower in the second window compared with the first one (P = 0.048). Nevertheless, there were no significant differences between the two treatment groups in any of the GH parameters evaluated, in either the first or second sampling windows.
Characterization of GH concentrations in blood plasma of barrows and immunized barrows in 24-h windows at an age of 19 and 24 weeks

Values are given as mean ± s.e.
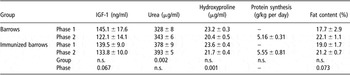
IGF-1 (Table 3) tended to decrease due to immunization but was not significantly different from the controls (P = 0.067).
Metabolic parameters

Phase 1 refers to day 0 (day of first vaccination at age 18 weeks) to day 27 while phase 2 comprise day 39 to day 72. Protein synthesis was determined on the last day of phase 2, while fat content was measured on day 2 and day 49.
Values are given as mean ± s.e.
Data for metabolic parameters are also presented in Table 3. Compared to phase 1, urea concentrations in phase 2 were increased by 15 μg/ml in both groups (not significant) while differences between groups exist (P = 0.002). There was a significant decrease in OH-Pro by about 10% after the second immunization (P = 0.001). Protein synthesis values were 5.16 and 5.55 g/kg BW per day for barrows and immunized barrows, respectively, and were not significantly different. Comparison of deuterium oxide applications in weeks 20 and 25 demonstrated that fat content tended to increase by 15% in this period (P = 0.073) and there was no statistical difference between the groups.
Discussion
In an earlier study (Metz and Claus, Reference Metz and Claus2003), using immunocastrated entire male pigs at ages of 10, 16 and 23 weeks, we found that GH concentrations in blood plasma at 23 weeks were identical to entire control boars (both 4.09 ng/ml). In contrast, GH concentrations in blood plasma of surgical castrates only reached 2.88 ng/ml, and thus were 42% lower than the other two groups. The maintenance of GH concentration after immunocastration was recently confirmed in another study (paper in preparation; boars: 3.57 ng/ml; immunized boars: 3.24 ng/ml; not significant). These results indicated a systematic difference in GH concentrations between surgically castrated and immunocastrated pigs. It is well known that GnRH and thus gonadotropins are elevated in barrows due to the absence of negative feedback by steroids. Since surgically castrated and immunocastrates have low steroid values, we hypothesized that there may be an interaction between elevated GnRH and GRH, which might be abolished by GnRH vaccination of barrows.
In contrast to our earlier study with boars, gonadotropin concentrations in barrows already decreased in response to the first vaccination, which is known to lead to low levels of immunoglobulins primarily represented by IgM. Such an effect was also found previously (Oonk et al., Reference Oonk, Turkstra, Schaaper, Erkens, Schuitemaker-de Weerd, van Nes, Verheijden and Meloen1998; Turkstra et al., Reference Turkstra, Oonk, Schaaper and Meloen2001 and Reference Turkstra, Zeng, van Diepen, Jongbloed, Oonk, van de Wiel and Meloen2002). It is likely that our assay system did not detect low levels of IgG and did not detect IgM at all because it was raised against IgG.
The difference in gonadotropin reaction between boars and barrows might be due to the absence of negative steroid feedback in the barrows, which thus have higher gonadotropin concentrations in the beginning and are probably more sensitive to low levels of immunoglobulins. Detailed mechanisms of a possible interaction of the immune system and hormonal feedback regulation have not been investigated. Such an assumption, however, is supported by the maintenance of an intermediate LH level of about 0.2 ng/ml until the second vaccination, which corresponds to the physiological LH concentration in boars (Wagner and Claus, Reference Wagner and Claus2004; Claus et al., Reference Claus, Lacorn, Danowski, Pearce and Bauer2007). The second vaccination then led to a rise of antibody titre and to a further decrease of LH down to base levels. Interestingly, FSH also decreased continuously after a latency period of about 10 days after the first immunization. In earlier studies we found no change in FSH concentrations following immunization of boars: levels remained the same (0.5 ng/ml) in immunized and control boars (Wagner and Claus, Reference Wagner and Claus2004). In the present study, barrows of both groups had higher FSH concentrations due to the absence of negative steroid feedback. Immunization clearly decreased FSH but values were again stabilized at 0.5 ng/ml. With regard to FSH regulation, differences exist with other species. Both the function of activin from the anterior pituitary and the existence of a hypothalamic releasing hormone, other than GnRH, were assumed (Kauffold et al., Reference Kauffold, Schneider, Zaremba and Brüssow2005). This does not exclude the fact that GnRH plays a role in stimulating the high FSH concentrations due to the absence of negative feedback in barrows. From other species it is known that GnRH and activin interact (Liu et al., Reference Liu, Shintani, Wakatsuki, Sakamoto, Harada, Zhang and Saito1996; Shupnik and Weck, Reference Shupnik and Weck1998; Gregory et al., Reference Gregory, Lacza, Detz, Xu, Petrillo and Kaiser2005) so that high GnRH concentrations might be paralleled by elevated activin. Because activin in turn inhibits the synthesis and release of GH (Childs and Unabia, Reference Childs and Unabia1997), these effects might also explain lower GH levels in surgical castrates. The comparison of the two windows in the immunized barrows, one during high and one during low FSH, however, did not lead to different GH concentrations so that lower levels of GH in surgical castrates do not support the assumption of activin effects even if this substance was not measured in this study. Furthermore, GH secretion was not influenced by immunization of barrows, so the hypothesis of an interaction between the releasing hormones GnRH and GRH in the hypothalamus or pituitary also could not be substantiated.
As many of the metabolic effects of GH are mediated by IGF-I, levels of this hormone were also determined and again revealed no differences between barrows and immunized barrows. As expected, metabolic parameters confirm the absence of an effect of immunization on GH in barrows. In both groups, however, the age-dependent influence is obvious such as the increase of urea concentrations and the decrease of OH-Pro levels in blood plasma as it is known from other studies (Miller et al., Reference Miller, Judge and Schanbacher1990). The fat content also increased with age, as expected. It is concluded that interactions between GnRH and GRH in the hypothalamus or the pituitary do not explain why GH concentrations in surgically castrated males are lower than in GnRH immunized boars. It might be that boars, which remain intact until GnRH immunization, e.g. at 18 weeks, react differently compared to those that were castrated during the first week of life. Indeed, it is known from rodents that a later ‘male pattern’ of GH secretion is imprinted by gonadal steroids early postnatally (Jansson et al., Reference Jansson, Ekberg, Isaksson, Mode and Gustafsson1985). Such a transient increase of gonadal steroids in pigs is known to occur about 3 to 4 weeks after birth (Schwarzenberger et al., Reference Schwarzenberger, Toole, Christie and Raeside1993).
Acknowledgements
We would like to thank Bill Dunne, Mohammed Mecellem and Claudia Fischinger for animal care; Stefanie Mayer for her analytical talent, Anna Wagner for supervising the LH and FSH determinations, and Herbert Steingass and Mrs Haller for the help during D2O analysis. The study was financially supported by Pfizer, Sandwich, UK. We also thank Michael Pearce for critical suggestions and discussions.