

Introduction
The relationship between democracy and quality of life is one of the biggest issues in the studies of quality of life. The nature of the political regime matters because it conditions political rights and civil liberties that citizens enjoy. Rights and liberties can affect one's prospects for life, life satisfaction, subjective happiness − thus quality of life − because citizens can be frustrated when they find themselves constrained in terms of their rights and liberties. Democratic political rights and civil liberties also matter because they are necessary for access to the political sphere so that citizens can express their demands to reform policies and to enhance public welfare. Thus, we suppose regime type, particularly democracy, is one of the most important factors that leads to development of one's quality of life.
Extant literature has provided two competing views. A first key finding from cross-national studies is that democracy has a positive effect on quality of life. Scholars used Freedom House score (2010; see Dorn et al., Reference Dorn, Justina, Fischer and Sousa-Poza2007; Frey and Al-Roumi, Reference Frey and Al-Roumi1999), Polity IV score (Marshall and Jaggers, Reference Marshall and Jaggers2003; see Owen et al., Reference Owen, Videras and Willemsen2008), or Bollen's democracy index (Reference Bollen1980; see Moon and Dixon, Reference Moon and Dixon1985; London and Williams, Reference London and Williams1990) as the indicator of political democracy. In these cases, the data used are ‘objective’ measures of political regime. As for quality of life, London and Williams (Reference London and Williams1990) test their hypothesis by using an objective indicator of quality of life measured through indices of human basic needs, which consist of indicators of Physical Quality of Life Index (PQLI) (Morris, Reference Morris1980) and Net Social Progress (Estes Reference Estes1984). In contrast to that, Dorn et al. (Reference Dorn, Justina, Fischer and Sousa-Poza2007) use subjective indicators of quality of life drawn from an international survey of public opinion, International Social Survey Programme (ISSP, 2007).
The second important finding from cross-national analyses suggests that democracy has no effect on quality of life. Inglehart and Klingemann (Reference Inglehart, Klingemann, Diener and Suh2000) employ the Freedom House score as a measure of democracy and the index of subjective well-being from the World Values Survey (WVS) as a measure of happiness. They conclude that democracy is not necessarily the important factor to improve subjective happiness. Veenhooven (2000) uses the Freedom House score to operationalize ‘freedom’, not democracy, and average poll data of happiness to represent quality of life. After investigating whether country-level freedom affects happiness, he concludes that freedom does not affect happiness in poor countries, though this relationship is significant and positive in affluent countries.
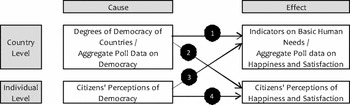
Researches arguing the causal relationship between democracy and individuals’ quality of life can be classified into the following four approaches with respect to the nature of the variable they employ. The first approach employs country-level variables as both the dependent and independent variable (Approach 1). As for democracy, the most widely used indicators are taken from Freedom House or Polity projects (Inglehart and Klingemann, Reference Inglehart, Klingemann, Diener and Suh2000; Owen et al., Reference Owen, Videras and Willemsen2008; London and Williams, Reference London and Williams1990; Frey and Al-Roumi, Reference Frey and Al-Roumi1999). Freedom House, a non-profit organization that publishes an annual report on the degrees of freedom around the world, assigns each country/territory a score from 1 (most free) to 7 (least free) to assess civil liberties and political rights. Polity is a set of projects that measures the degree of democracy and autocracy by a 21-point scale indicator ranging from –10 (hereditary monarchy) to +10 (consolidated democracy). Also, scholars use aggregated data of public opinion about democracy. Questions about democracy include respondents’ satisfaction with their country's democratic system. While Freedom House and Polity scores are used to measure the ‘objective’ degree of democracy, aggregate poll data are used to grasp the ‘subjective’ degree of democracy in a given country (e.g. Afrobarometer, Asiabarometer, Latinobarometer, and World Values Survey).
Country-level data of quality of life is often taken from some indicators of basic human needs: PQLI consists of infant mortality rate, literacy rate, life expectancy, while Net Social Progress includes about 40 indicators (Moon and Dixon, Reference Moon and Dixon1985; London and Williams, Reference London and Williams1990; Frey and Al-Roumi, Reference Frey and Al-Roumi1999). These indicators represent quality of life in the ‘objective’ sense. On the other hand, a ‘subjective’ indicator of happiness can be taken from aggregated poll data, as is the case for satisfaction with democratic political system.
The second approach sets the individual-level data as the dependent variable, while country-level data as the independent variable (Approach 2). For example, some scholars use two types of individual-level variables to measure quality of life (Dorn et al., Reference Dorn, Justina, Fischer and Sousa-Poza2007). One approach asks whether respondents feel happy with their life, and another set of questions asks whether respondents are satisfied with their life. The third approach is analogous to the second approach, but here the independent variable is individual-level data and the dependent variable is country-level data (Approach 3).Footnote 1 Fourth, both dependent and independent variables are taken from individual-level data (Approach 4). Individual-level variables regarding democracy are represented by questions about whether respondents are satisfied with their country's democratic system. Figure 1 summarizes the relationship between independent and dependent variables by the level of the variables.
Four approaches to the links between democracy and quality of life

Four approaches are ideally possible. The extant research employs primarily the first and second approach, but there seem to be a few studies that use individual-level independent variables (Approaches 3 and 4). If the regularity between democracy and quality of life is also confirmed by the analysis of individual-level data, the empirical findings of scholars would be more robust. Furthermore, since the two major findings discussed above have competing views on the relationship between democracy and quality of life, we need to test which hypothesis is valid. Note, however, that the relationship found between aggregated country-level variables would not necessarily be identical with the relationship found between individual-level variables. In order to fill the gap, our analysis applied hierarchical modeling whereby we can scrutinize the relationship between individual-level variables while taking into consideration the country-level variation.
Democracy and quality of life in Asia
Asian societies exhibit different features in politics, economy, and society (Katayama and Ohnishi, Reference Katayama and Ohnishi2006). In terms of political regime, there are four groups of countries in post-war Asia. Countries in the first group, Japan and India, consistently maintain democratic rules. In contrast, China, Vietnam, Laos, Singapore, and Central Asian states, have remained authoritarian for decades. Third, so-called ‘third-wave’ democracies such as South Korea, Taiwan, Indonesia, the Philippines, and Mongolia are the group of nations that transited to liberal democracy after the 1970s. Finally, Thailand, Malaysia, Nepal, Bangladesh, and Myanmar follow a back-and-forth path between democracy and autocracy.
Note that, however, both democratic and non-democratic regimes in Asia have pursued the well-being of the people. On the one hand, leaders in authoritarian regimes – Lee Kuan Yew (Singapore), Park Chung-hee (South Korea), and Suharto (Indonesia) – promised to improve macro-economic conditions, develop infrastructures, increase household incomes and enhance individual livelihoods. On the other hand, democratic and industrialized countries have also provided the electorate with both basic human needs and material wealth. Which type of regime is then likely to achieve high qualities of life? This is an important question for those who consider democracy as a prerequisite of the individual's well-being (Putnam, Reference Putnam2000).
Since different types of regime have attempted to improve quality of life in Asia, Asia is an interesting region to investigate the relationship between regime type and quality of life. However, many previous studies have been unable to investigate some Asian nations. Frey and Al-Roumi (Reference Frey and Al-Roumi1999) include 87 developing and less developed countries, but do not examine some communist states such as China, one of the largest and most important states in Asia. Additionally, since Inglehart and Klingemann (Reference Inglehart, Klingemann, Diener and Suh2000) and Owen et al. (Reference Owen, Videras and Willemsen2008) use WVS data, they are forced to remove some countries in Asia. Hence, we would benefit from focusing only on Asia to investigate the links between democracy and the quality of life.
Measurement issues
Democracy and quality of life
Scholars measure good quality of life by happiness (Dorn et al., Reference Dorn, Justina, Fischer and Sousa-Poza2007).Footnote 2 For them, the quality of life is understood by one's feelings, subjective assessment. The source of happiness would lie in both country-level economic performance and personal feelings. That is, both ‘objective’ indicators of economic prosperity and ‘subjective’ assessment of, for example, standard of living can be causes of one's happiness. It is straightforward to imagine that economic prosperity is higher in developed countries than developing countries. However, note that the people living in less prosperous countries do not necessarily feel less happy than those in more prosperous countries. For example, it is known that the government of Bhutan renders most of its citizens happy although the country is by no means economically successful (Wangchuch, Reference Wangchuck2007; Motobayashi, Reference Motobayashi2006). Therefore, we need to take into account both individual-level and country-level well-being as the effect of economy on the quality of life.
Also, there remains a problem concerning the measure of democracy. Some researchers evaluate the function of democracy in light of the extent to which the political institution works. The role of democratic institution is often represented by that of electoral system, system of government, and party system. If such institutions function very well, people can participate in the political process and convey their demands to political representatives. As a result, a well-functioning democracy can help the people to enhance their well-being. On the other hand, it is also possible to understand the function of democracy from citizen's perspective. They evaluate how their own political regime relates to their subjective happiness. Therefore, we deal with both subjective and objective measures of the function of democracy; the former is measured by individuals’ perception of democracy in the responses to the question items regarding this issue in survey, while the latter is evaluated by the types of political regime − democracy or non-democracy.
The hypotheses
Building upon the argument above, this section summarizes our hypotheses which are examined in the following empirical analysis. We verify whether the citizens’ perception of democracy affects their general feeling of happiness. Hypotheses 1a and 1b examine whether the individual-level assessment of democracy affects one's general happiness.
Hypothesis 1a. The more satisfied the citizens are with the state of political rights they enjoy, the happier they are.
Hypothesis 1b. The more satisfied the citizens are with the state of civil liberties they enjoy, the happier they are.
If the hypotheses hold, those who are satisfied with their democratic system − political rights and civil liberties − would feel happier than those who are dissatisfied with them.Footnote 3
We then employ country-level data of regime type as the independent variable. We test whether a regime type is the cause of citizens’ happiness. We examine the effect of regime type rather than the level of democracy which is often measured by Polity IV score because the continuous indicator of democracy does not differentiate the effect of regime type, which is the central concern in our analysis.
Hypothesis 2. The citizens are in a democracy rather than a non-democracy.
If hypothesis 2 is supported, it means that policies provided in democratic regimes generally render the citizens happy. This hypothesis was also examined by Dorn et al. (Reference Dorn, Justina, Fischer and Sousa-Poza2007). The authors found the positive impact of democracy on happiness in the comparative study of 28 countries, by using Polity IV democracy index.
Methods
The sample
Our research is based on the AsiaBarometer Survey data. Our sample included 39 surveys of 20 countries. We examined the data of Bangladesh (2005), Bhutan (2005), Cambodia (2004, 2007), China (2003, 2006, 2008), India (2003, 2005, 2008), Indonesia (2004, 2007), Japan (2003, 2004, 2006, 2008), Kazakhstan (2005), Kyrgyzstan (2005), Malaysia (2003, 2004, 2007), Mongolia (2005), Nepal (2005), Pakistan (2005), the Philippines (2004, 2007), Singapore (2004, 2006), South Korea (2003, 2004, 2006), Sri Lanka (2003, 2005), Tajikistan (2005), Thailand (2003, 2004, 2007), and Uzbekistan (2003, 2005). The sample size is 25,661.
The method
Since we analyze cross-national survey data, an adequate way to examine them is to apply Hierarchical Modeling (HM). We follow a two-step estimation to run our model. That is, we first estimate latent variables of the level of satisfaction with political rights and civil liberties through confirmatory factor analysis, and then run multilevel linear regression.Footnote 4 We set individual-level independent variables (i.e. question items) as the first level variable and the country-level variables as the second level variable. Several ways of model specification are possible in the HM framework, and we apply a model which allows varying intercept.
Variables
Dependent variable
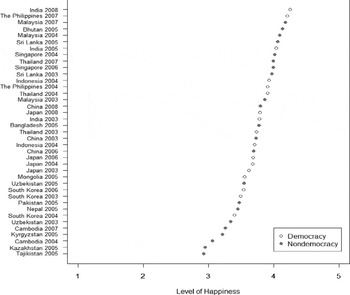
The dependent variable is general happiness. It is measured through a survey question asking how happy a respondent feels. It is a five-point scale ordinal variable whose response categories ranges from 1 (very happy) to 5 (very unhappy). We reverse the value of the variable so that a larger value means that a respondent feels happier (i.e. 5 (very happy) to 1 (very unhappy) in our analysis.) Figure 2 shows the mean level of happiness across space and time in our sample. We can observe the variation in the level of happiness across space and time. For example, the mean level of happiness increases, for example, in India, Japan, Malaysia, and Thailand over time. Note that the aggregated level of happiness might not depend on the regime type, which will be further explored in the following empirical analysis.
The Mean Level of Happiness in Asian Societies

Individual-level independent variables
Perception of democracy. Perception of democracy is a key explanatory variable in our analysis. It is measured by satisfaction with political rights and satisfaction with civil liberties. Political rights are one component of democracy. The extent to which citizens are satisfied with the state of political rights they enjoy is measured through the following three questions: satisfaction with the right to vote, the right to participate in any kind of organization, and the right to gather and demonstrate. The response is a four-point scale ranging from 1 (very satisfied) to 4 (very dissatisfied). In order that a larger value represents greater popular satisfaction with political rights, we reverse the value of the variables. Civil liberties are also considered one aspect of democracy. A citizen's satisfaction with the state of civil liberties in his/her country is grasped by three question items: satisfaction with the right to be informed about the government, freedom of speech, and the right to criticize the government. Response category is identical with that of political rights, thus we reverse the value of the variables.
Satisfaction with political rights and satisfaction with civil liberties are supposedly similar concepts, but our confirmatory factor analysis shows that the two-factor model is better fitted to the data than the one-factor model. Indices of the two-factor model with better fit are: CFI (Comparative Fit Index) = 0.969, TLI (Tucker−Lewis Index) = 0.973, and RMSEA (Root Mean Square Error of Approximation) = 0.109.Footnote 5 All factor loadings are positive and statistically significant. The two latent variables exhibit high correlation (the correlation coefficient was 0.917), thus our model does not include both variables simultaneously because it would cause multicollinearity. In other words, we include either satisfaction with political rights or satisfaction with civil liberties in our analysis.
Individual-level control variables. We add six control variables to our model, that are satisfaction with government performance, standard of living, gender, age, education level, and religious affiliation. We introduce them as control variables reflecting past research (e.g. Inoguchi et al., Reference Inoguchi, Mikami and Fujii2007; Inglehart and Klingemann, Reference Inglehart, Klingemann, Diener and Suh2000; Fails and Pierce, 2008; Seki, Reference Seki and Ito2007; Owen et al., Reference Owen, Videras and Willemsen2008). First of all, we need to control for ideas a citizen holds about the performance of government, since their estimation of government might have some sort of impact on their feeling of happiness. There might be a possibility that a citizen is satisfied with the performance of government no matter how non-democratic the regime is. Next, we include standard of living as a control variable because people's living condition might be related to their happiness. People may feel happy if they have a higher income than others. In that case, the level of real wages would not necessarily be problematic. And we also control for individual attributes. These variables are mainly expected to be associated with the dependent variable.
Satisfaction with government performance is a latent variable, that is the observed indicators measure the extent to which a citizen evaluates the government. These indicators cover the following six issues: the economy, political corruption, human rights, unemployment, crime, and public services. The original response category is 1 (very well) to 4 (not well at all), and therefore we reverse the value of the items. Confirmatory factor analysis exhibits sufficient model fit indices such as CFI = 0.973, TLI = 0.980, and RMSEA = 0.097. Standard of living is measured by one question item which asks for an evaluation of standard of living. The five-point scale is adapted to the question which ranges from 1 (high) to 5 (low). The value is again reversed in our analysis.
Gender is a dummy variable. We recode the variable so that the score 1 signifies a respondent is male and 0 female. Age is a continuous variable. Education level has different number of categories across countries. Thus we recode it and assign 1 (elementary school or lower), 2 (secondary education), and 3 (college/university or higher). Finally, we use a question item which asks one's religious affiliation. The question found in the AsiaBarometer survey prepared 14 response categories, but we decided to generate four dummy variables for the sake of parsimony, that is Christian, Muslim, Buddhist, and Other.Footnote 6 Those who answer Catholic and Other Christian are considered ‘Christian’. We regard both Sunnah and Shiah Muslim as ‘Muslim’. Both Mahayana and Theravada Buddhist are categorized as ‘Buddhist’. The other religion is considered ‘Other’ along with Other and None responses. The last dummy variable is the base category in our analysis.
Country-level independent variables
Democracy. We use a dichotomous measure of regime type: democracy and non-democracy. Since our dataset covers years from 2003 to 2008, our best effort to classify political regimes is to use Polity IV data. We follow the conventional operationalization in the literature and consider a country as democratic if the Polity IV score marks more than seven (Epstein et al., Reference Epstein, Bates, Goldstone, Kristensen and O'Halloran2006: 555).Footnote 7
Two country-level control variables are the natural log of GDP per capita and the level of urbanization which are presumably positively associated with the level of happiness. Data of GDP comes from United Nations Statistics Division's ‘‘Gross Domestic Product (GDP): GDP/breakdown at current prices in US Dollars (all countries).’ And urbanization rates are based on data of World Bank's ‘Urban Development’.Footnote 8
The model
We estimate a model which includes popular satisfaction with political rights (or civil liberties) and the regime type variable along with other control variables. We consider the dependent variable as a categorical variable, and therefore run ordered logistic regression. Since the SEM framework treats the varying intercept (β0) as a continuous latent variable that varies across clusters (in our model, the cluster represents survey year), we do not have a constant when estimating the varying intercept. The intuitive presentation of our empirical model is as follows:

where
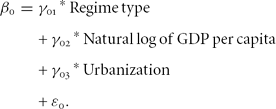
We estimate a random intercept model since our hypotheses do not presume that country-level variables condition individual-level slope coefficients. In other words, our model specification implies that country-level variables account for variation in individual-level constants which are left unexplained by individual-level explanatory variables.
Findings
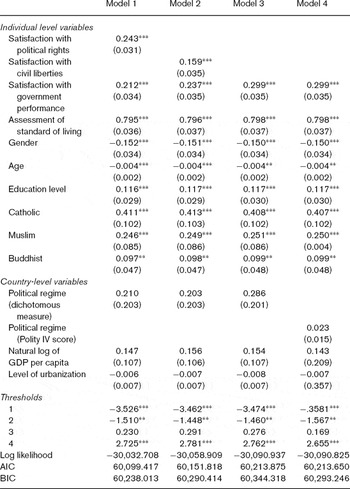
Table 1 summarizes the results of statistical analysis. First, Model 1 and Model 2 show a positive effect of satisfaction with political rights and civil liberties on one's happiness after controlling for satisfaction with government performance, standard of living, gender, age, education level, religious affiliation, regime type, the level of economic development, and the level of urbanization. In contrast, we could find no causal effect of regime type on general happiness although the sign of the coefficient is positive (p-value is 0.302). In sum, individual-level evaluation of the satisfaction with political rights and civil liberties does positively increase happiness, while dichotomously classified regime type has no effect on it.
Democracy and quality of life in Asian societies

Notes: *p < 0.10, **p < 0.05, ***p < 0.01. Two–tailed test. Standard errors are in parentheses. The number of observations is 25,661 and the number of clusters is 39 in each model.
As for control variables, greater satisfaction with government performance and standard of living increase happiness. Men are generally less happy than women. Older people feel less happy than the younger. Higher education increases happiness. Catholic, Muslim, and Buddhist are happier than others, although we are not able to discuss the substantive meaning of the impact of religious affiliation on one's happiness. The level of economic development shows a positive sign, but it is not statistically significant at the conventional level (p-value is 0.170). Similarly, the coefficient of urbanization is negative and is not statistically significant (p-value is 0.371).
Since it is possible that the causal effect of regime type disappears once we take into account satisfaction with political rights and civil liberties, Model 3 excludes satisfaction with political rights from Model 1. Even with this specification, we could not find any causal effect of regime type on the feeling of happiness, although the p-value improves from 0.302 to 0.155. This result is driven by excluding satisfaction with political rights. Despite of the fact that the standard error of the regime type variable does not change significantly, the coefficient estimate increases from 0.210 to 0.286, suggesting that the coefficient is overestimated in Model 3. Also, in order to test if our findings are driven from using the dichotomous measure of regime type, Model 4 substitutes the Polity IV score for the dichotomous measure of regime type in Model 3.Footnote 9 The result does not change, and the level of democracy does not explain the variation in happiness in the individual level (p-value is 0.114 with a positive coefficient), at least among Asian countries.
For robustness check, we test several alternative model specifications.Footnote 10 First, we exclude dummy variables of religion from Model 1. The findings incur no substantive change. Second, we exclude the level of urbanization from Model 1 since this variable is highly correlated to the level of economic development (the correlation coefficient is 0.816 in Model 1). The result remains again unaffected and the level of economic development shows a positive coefficient but is not statistically significant (p-value is 0.268). Third, we omit the subjective assessment of the standard of living from Model 1 although this variable is negatively correlated to the level of economic development in our sample (the correlation coefficient between economic development and standard of living is –0.015 in Model 1). In this specification, we do not find a statistically significant causal effect of the level of economic development on happiness, while the sign of coefficients is positive. The coefficient is 0.174 with p-value 0.121 (slightly improved from 0.170).
In sum, the series of robustness checks yield the following two conclusions. First, as we hypothesized, individual-level satisfaction with political rights and civil liberties is a strong explanatory factor of one's happiness. That is, not only socio-economic status of an individual but also one's evaluation about politics plays an important role to increase one's happiness. Second, the country-level regime type does not show a statistically significant effect on the level of happiness at least in Asian societies. This finding remains unaffected even when we exclude individual-level satisfaction with political rights and civil liberties. The evidence suggests that a regime type per se plays at least a minor role in increasing one's happiness. The more important factor, we find, is the extent to which individuals are satisfied with actual function of political regime and the extent to which they enjoy political rights and civil liberties in their countries.
6. Conclusion
In this paper, we examine the effect of democracy on the subjective quality of life by looking at both the regime type and perceived satisfaction with political rights and civil liberties. Our findings suggest that popular satisfaction with democratic political rights and civil liberties increases their feeling of happiness, while the macro-level regime type does not. Our conclusion, therefore, is different from that of Dorn et al. (Reference Dorn, Justina, Fischer and Sousa-Poza2007) in that regime type does not have causal effect on happiness. Note that, however, our sample is limited to Asian countries.
We draw the following implication from our findings. It would not be surprising to find that the causal effect of the level of perceived satisfaction with political regime on one's happiness is positive and statistically significant, while the effect of the regime type per se is not. The dichotomous measure of regime type − democracy and non-democracy − does not capture the actual function of different regime types, especially the extent to which a regime is ‘democratic’ among democracies and a regime is repressive among non-democracies. Therefore, we can infer that citizens in Asian societies are more concerned about how their government functions rather than an important but rough distinction between democracy and non-democracy with respect to expressing their feelings of happiness. Even though a political regime is classified as democratic, we have seen democracies in which, for example, electoral accountability does not function as is expected and elections yield patronage politics and are often associated with corruption of elected officials. Those factors might affect the level of happiness among individuals. Hence, it would be reasonable to argue that citizens’ happiness is a function of their evaluation of a political regime including their satisfaction with political rights and civil liberties, and that the regime type itself plays a marginal role.
About the authors
Shinya Sasaoka is Associate Professor of Political Science at Hiroshima Shudo University, Japan. His primary teaching and research interests include comparative politics, Russian politics, and Japanese politics.
Katsunori Seki is PhD student in Political Science at Texas A&M University.