


1. Introduction
Over the past 50 years, the hours worked by women in the US have increased dramatically, while the hours worked by men have fluctuated with the business cycle. As a result, the ratio of women’s hours to men’s hours has increased from less than 40% in 1968 to about 75% in 2018. However, the rate of convergence has not been uniform. As the left panel of Figure 1 shows, the ratio of female to male hours has leveled off since the early 1990s.
It could be argued that the plateau is natural because the gender hours ratio cannot rise indefinitely. While this argument has some merit, the plateau still raises an important question as it reflects the changes in the relative demand for and supply of female labor when the trends in the gender hours ratio and the gender wage ratio are considered together. The gender wage ratio has also risen sharply but the gap has stopped closing since the early 1990s, as shown in the right panel of Figure 1. The pause in both the gender hours gap and the gender wage gap suggests that the relative demand for female labor has grown more slowly since the early 1990s. Prior to the 1990s, both the gender hours ratio and the gender wage ratio rose sharply because the relative demand for female labor grew faster than the relative supply. Since then, both ratios have stagnated, suggesting that the pace of the increase in the relative demand for female labor has slowed considerably compared to the previous period. These trends imply that the flattening out of the gender hours ratio is due to the factors affecting the relative demand for female labor.
This paper attempts to explain the change in the gender hours ratio in terms of the differential impact of offshoring on female and male labor. Specifically, I focus on service offshoring, which increased during the same period that the gender hours ratio began to level off, namely the 1990s. I postulate a mechanism by which the increase in service offshoring has exerted greater downward pressure on women’s hours since the 1990s, thereby slowing the rise in the gender hours ratio since then.
Female to male hours ratio and female to male wage ratio in the US.
Notes: The hours ratio is the ratio of average annual hours of work by individuals aged 21 to 65. The female-to-male wage ratio is calculated as the exponential of the coefficient on a female dummy, after regressing the log of hourly wages on a female dummy, age, age squared, educational attainment (4 categories), and ethnicity (nonwhite dummy) for each year.
Sources: Current Population Survey (CPS) March Supplement.

Changes in hours worked by gender and occupation group support this mechanism. The share of “sales and administrative support occupations” in women’s hours worked has declined significantly since 1990, while the share of the same occupations among men’s hours worked remained relatively stable. Given that these occupations have the highest offshoring potential and that the occupation groups with higher offshoring potential have a higher female to male hours ratio, the diverging trends by gender suggest that the negative impact of the increase in offshoring has been greater for women. In particular, given that women are more likely than men to be employed in the service sector, these facts are consistent with the increase in service offshoring that has taken place since the late 1980s. Routine-biased technological change (RBTC) could be a prominent alternative to offshoring in this mechanism, but I find that it does not reconcile the empirical facts well enough compared to offshoring.
I propose a static, general equilibrium model with two genders, two sectors, and a continuum of occupations. The model is based on Ngai and Petrongolo (Reference Ngai and Petrongolo2017), and incorporates the offshoring elements of Grossman and Rossi-Hansberg (Reference Grossman and Rossi-Hansberg2008). Motivated by the empirical evidence, the model imposes the assumptions that more women are employed in highly offshorable occupations and that offshoring in the goods sector has been more widespread than offshoring in the services sector. Under these assumptions, the model implies a higher female to male hours ratio in services. This result, together with the assumptions that productivity growth is faster in the goods sector than in the services sector and that the consumption of goods and services is complementary, suggests an increasing female to male hours ratio. However, the decline in the cost of offshoring in the services sector, facilitated by the developments in information and communication technology (ICT) in the 1990s, causes the gender hours ratio to fall. This is because the increase in service offshoring replaces highly offshorable and female-dominated domestic occupations with offshored labor.
Quantitative analysis allows for three sources of the slowdown in the gender hours ratio since the early 1990s. The first is the increase in service offshoring. Second, the forces driving structural transformation into the service sector have weakened. Finally, the pace of decline in gender productivity wedge has been more moderate. The results show that the increase in service offshoring is a larger contributor than the weaker structural transformation toward services. This means that the service offshoring mechanism has played a more important role in rationalizing the flattening of the gender hours ratio. Comparing the service offshoring channel with the gender productivity wedge channel also confirms the quantitative importance of the increase in service offshoring.
This paper contributes to the existing literature on women’s labor market performance in three aspects. First, I consider both the extensive and the intensive margins of the labor market by focusing on hours worked by women and men. Most previous studies have only looked at the trends in the extensive margin, such as women’s labor force participation or women’s employment-to-population ratio. However, it is crucial to look at both margins simultaneously, as there is a greater potential for women’s hours worked to increase due to the lower hours worked by employed women, even though women’s labor force participation is rapidly approaching that of men.
Second, this paper sheds light on the demand side of female labor, which is driven by offshoring. The literature has primarily focused on the supply side of female labor, which is at odds with the evolution of the gender wage ratio. If an increase in the female labor supply was the main driver of women’s high labor market performance, we would have observed a declining gender wage ratio with an increasing gender hours ratio.
The paper by Ngai and Petrongolo (Reference Ngai and Petrongolo2017), which focuses on hours worked and presents the rise in services as a factor contributing to the increase in the relative demand for female labor, is a notable exception to the previous two aspects. They obtain women’s comparative advantage in services by directly imposing a higher weight on female labor in the services sector. On the other hand, this paper provides a novel channel that can lead to higher female intensity in services. The model shows that this can arise endogenously due to the unequal impact of offshoring by gender and the different degree of offshoring across sectors. I also show that introducing the offshoring channel outperforms Ngai and Petrongolo (Reference Ngai and Petrongolo2017) in explaining the slowdown in the growth of the gender hours ratio since 1990.
This paper is also the first to examine the differential impact of offshoring by gender in an advanced economy. Previous literature on offshoring has not addressed this issue. It is well known that an increase in offshoring leads to the reallocation effect from domestic to offshored labor and the scale effect due to an overall increase in productivity. Studies that explore the size of the reallocation effect report that the overall impact of offshoring on domestic employment is modest at best. However, these studies cannot answer the question raised in this paper because small aggregate employment effects could mask large asymmetric effects for women and men.
A few papers have touched on the issues relevant to this paper. For example, Acemoglu and Autor (Reference Acemoglu, Autor, Acemoglu and Autor2011) found that the average offshorability index was higher for women than for men using the 1980 Census data, but they did not pursue this further. Using Brazilian data, Peri and Poole (Reference Peri and Poole2013) attempted to identify the differential impact of the increase in offshoring on women and men. They find that the relative demand for cognitive versus manual tasks rises in each firm as the offshoring to the country increases, but that firms do not hire more women.
Building on Autor and Dorn’s (Reference Autor and Dorn2013) offshorability index for each occupation, this paper addresses the unequal effects of offshoring by gender in the US and finds that the effects may be different from those in Brazil, which is mainly on the receiving end of offshoring. In particular, I document that the more offshorable occupation groups employ more women relative to men and that this trend has been constant in the US since 1970. These findings suggest that the growth of offshoring has an additional impact on the labor market through the gender dimension.
1.1. Related literature
A large body of previous research has identified numerous candidates for the improvement in women’s labor market outcomes since World War II. These include advances in women’s education and human capital (Goldin, Reference Goldin2006; Eckstein and Lifshitz, Reference Eckstein and Lifshitz2011), home technology (Greenwood et al. Reference Greenwood, Seshadri and Yorukoglu2005), medical technology (Albanesi and Olivetti, Reference Albanesi and Olivetti2016), the closing of the gender wage gap (Jones et al. Reference Jones, Manuelli and McGrattan2015), the expansion of the service sector (Ngai and Petrongolo, Reference Ngai and Petrongolo2017), and the interaction between the size of the service sector and the tax system (Rendall, Reference Rendall2018). Santos and Weiss (Reference Santos and Weiss2016) examined the role of increased income volatility on marriage rates, which in turn affects female labor supply. One strand of the literature argues that the marketization of childcare costs has affected the labor supply behavior and willingness to have children of highly educated women (Hazan and Zoabi, Reference Hazan and Zoabi2015; Bar et al. Reference Bar, Hazan, Leukhina, Weiss and Zoabi2018; Hazan et al. Reference Hazan, Weiss and Zoabi2021). Other studies highlight the role of ICT development (Weinberg, Reference Weinberg2000; Dettling, Reference Dettling2017), increased demand for female-oriented skills (Cortes et al. Reference Cortes, Jaimovich and Siu2018), family peer effects (Nicoletti et al. Reference Nicoletti, Salvanes and Tominey2018), and politics (Cohen et al. Reference Cohen, Hazan and Weiss2024) in improving women’s labor market outcomes.
Relatively less attention has been paid to the stagnation of women’s labor market performance, which is a more recent phenomenon. These papers document that age-LFP (labor force participation) profiles that differ across cohorts (Juhn and Potter, Reference Juhn and Potter2006; Krueger, Reference Krueger2017), single women’s labor supply (Moffitt, Reference Moffitt2012), family policies (Blau and Kahn, Reference Blau and Kahn2013), and married women’s labor supply response to their husbands’ earnings (Albanesi and Prados, Reference Albanesi and Prados2017) are responsible for the stagnation. Kleven et al. (Reference Kleven, Landais and Søgaard2019) found that the “child penalties” persists in determining married women’s hours worked and labor market participation.
This paper is also closely related to the literature on the employment effects of offshoring, of which the theoretical work of Grossman and Rossi-Hansberg (Reference Grossman and Rossi-Hansberg2008) has been the most influential in recent years. They incorporate trade in tasks into the model, providing a tractable framework for analyzing the effects of offshoring. Empirically, most researchers agreed that the impact of service offshoring on aggregate employment was either statistically insignificant or slightly negative (Liu and Trefler, Reference Liu and Trefler2008; Amiti and Wei, Reference Amiti and Wei2009). A small number of studies, including Crinò (Reference Crinò2010), probed the employment effects by different demographic groups, but none of them, with the exception of Peri and Poole (Reference Peri and Poole2013), considered the differential impact on men and women. Some papers attempted to estimate the share of offshorable jobs by creating a new index (Blinder, Reference Blinder2009; Jensen and Kletzer, Reference Jensen, Kletzer, Jensen and Kletzer2010) and conducting a new survey (Blinder and Krueger, Reference Blinder and Krueger2013). Another strand of the literature considered the effects of RBTC together with those of offshoring (Autor and Dorn, Reference Autor and Dorn2013; Goos et al. Reference Goos, Manning and Salomons2014; Autor et al. Reference Autor, Dorn and Hanson2015).
2. Empirical facts
This section first discusses the unequal impact of offshoring across gender. I construct the average offshoring potential of each occupation group and describe the underlying trends in the share of each occupation group in each gender’s hours worked based on this new statistic. I then document the increase in actual service offshoring and the correlation between the female intensity and the increase in imports across services. Finally, I present the rationale for focusing on offshoring rather than RBTC in this paper.
2.1. Offshoring potential by occupation
Offshoring refers to the movement of jobs, but not the people who perform them, across national borders. An offshorability index for each occupation is derived from the task measures that can represent the potential for offshoring. It is assumed to be fixed over time because it indicates the intrinsic nature of an occupation.Footnote 1 One point to note is that a high offshorability index for an occupation simply means that the occupation has a high potential for offshoring, not that many jobs in that occupation have actually been offshored.
I use the offshorability index for each occupation to construct the average offshoring potential of broader occupation groups. Specifically, I use Autor and Dorn’s (Reference Autor and Dorn2013) offshorability index. They focus on the elements of each occupation that represent Face-to-Face contact and On-Site Job, as originally proposed by Firpo et al. (Reference Firpo, Fortin and Lemieux2011).Footnote 2 This occupation-specific content is available from the Occupational Information Network (O*NET), which has been developed and maintained by the US Department of Labor. Their offshorability index is defined so that occupations that require more Face-to-Face contact and involve more On-Site Job are less offshorable. The main advantage of using this index is that it has a consistent occupational classification structure over time.Footnote 3
Occupations are divided into five occupation groups based on the Dorn’s (Reference Dorn2009) classification.Footnote 4 I then calculate the average offshoring potential of each broad occupation group by taking averages of offshorability, using as weights the total hours worked by occupations within each group from 1968 to 2018 in the Current Population Survey (CPS) March Supplement data provided by Flood et al. (Reference Flood, King, Rodgers, Ruggles and Warren2018). According to the calculation, “sales and administrative support” occupations have the highest offshoring potential (0.58), followed by “service” (−0.12), “managers and professionals” (−0.14), “operators and laborers” (−0.16), and “craft and repair” (−0.82) occupations.Footnote 5
Figure 2 shows that managers and professionals are the occupations that have shown the greatest improvement in their share of hours worked since 1970. The share of service occupations also increased, while the shares of operators/laborers and craft/repair occupations decreased over the same period. The share of hours worked in sales and administrative support occupations followed a hump-shaped pattern, peaking in 1990.
Share of each occupation group in hours worked.
Notes: Figures are 5-year moving averages. Farming, forestry, and fishing occupations are omitted due to their small share of hours worked.
Sources: CPS March Supplement, David Dorn’s website.

In terms of labor supply, these transitions across occupation groups suggest that the supply of skilled workers has increased as a result of higher educational attainment among younger cohorts.Footnote 6 Managers and professionals employed the most skilled workers, while operators/laborers and craft/repair occupations were the occupations with the fewest skilled workers.Footnote 7
Sales and administrative support occupations also employ significant numbers of skilled workers, but their share of hours has declined since 1990. A possible explanation for this observation can be found in Figure 3, which describes the share of each occupation group in each gender’s hours worked. The top panel shows that the share of hours worked by women in sales and administrative support occupations has declined since 1990. These occupations have been the largest employers of female workers and have shown the greatest potential for offshoring. Over the same period, managers and professionals and service occupations, which are relatively less vulnerable to offshoring, have increased their shares. Given the definition of offshorability, these trends are all consistent with an increase in offshoring.
Share of each occupation group for each gender’s hours worked.
Notes: The average offshoring potential for each occupation group is; −0.14 (Managers, Professionals), 0.58 (Sales, Administrative support), −0.12 (Service), −0.82 (Craft, Repair), and −0.16 (Operators, Laborers). These average offshoring potentials are calculated by averaging the offshorability index of occupations in each occupation group, using hours worked from 1968 to 2018 as the weight. The figures are 5-year moving averages.
Sources: CPS March Supplement, David Dorn’s website.
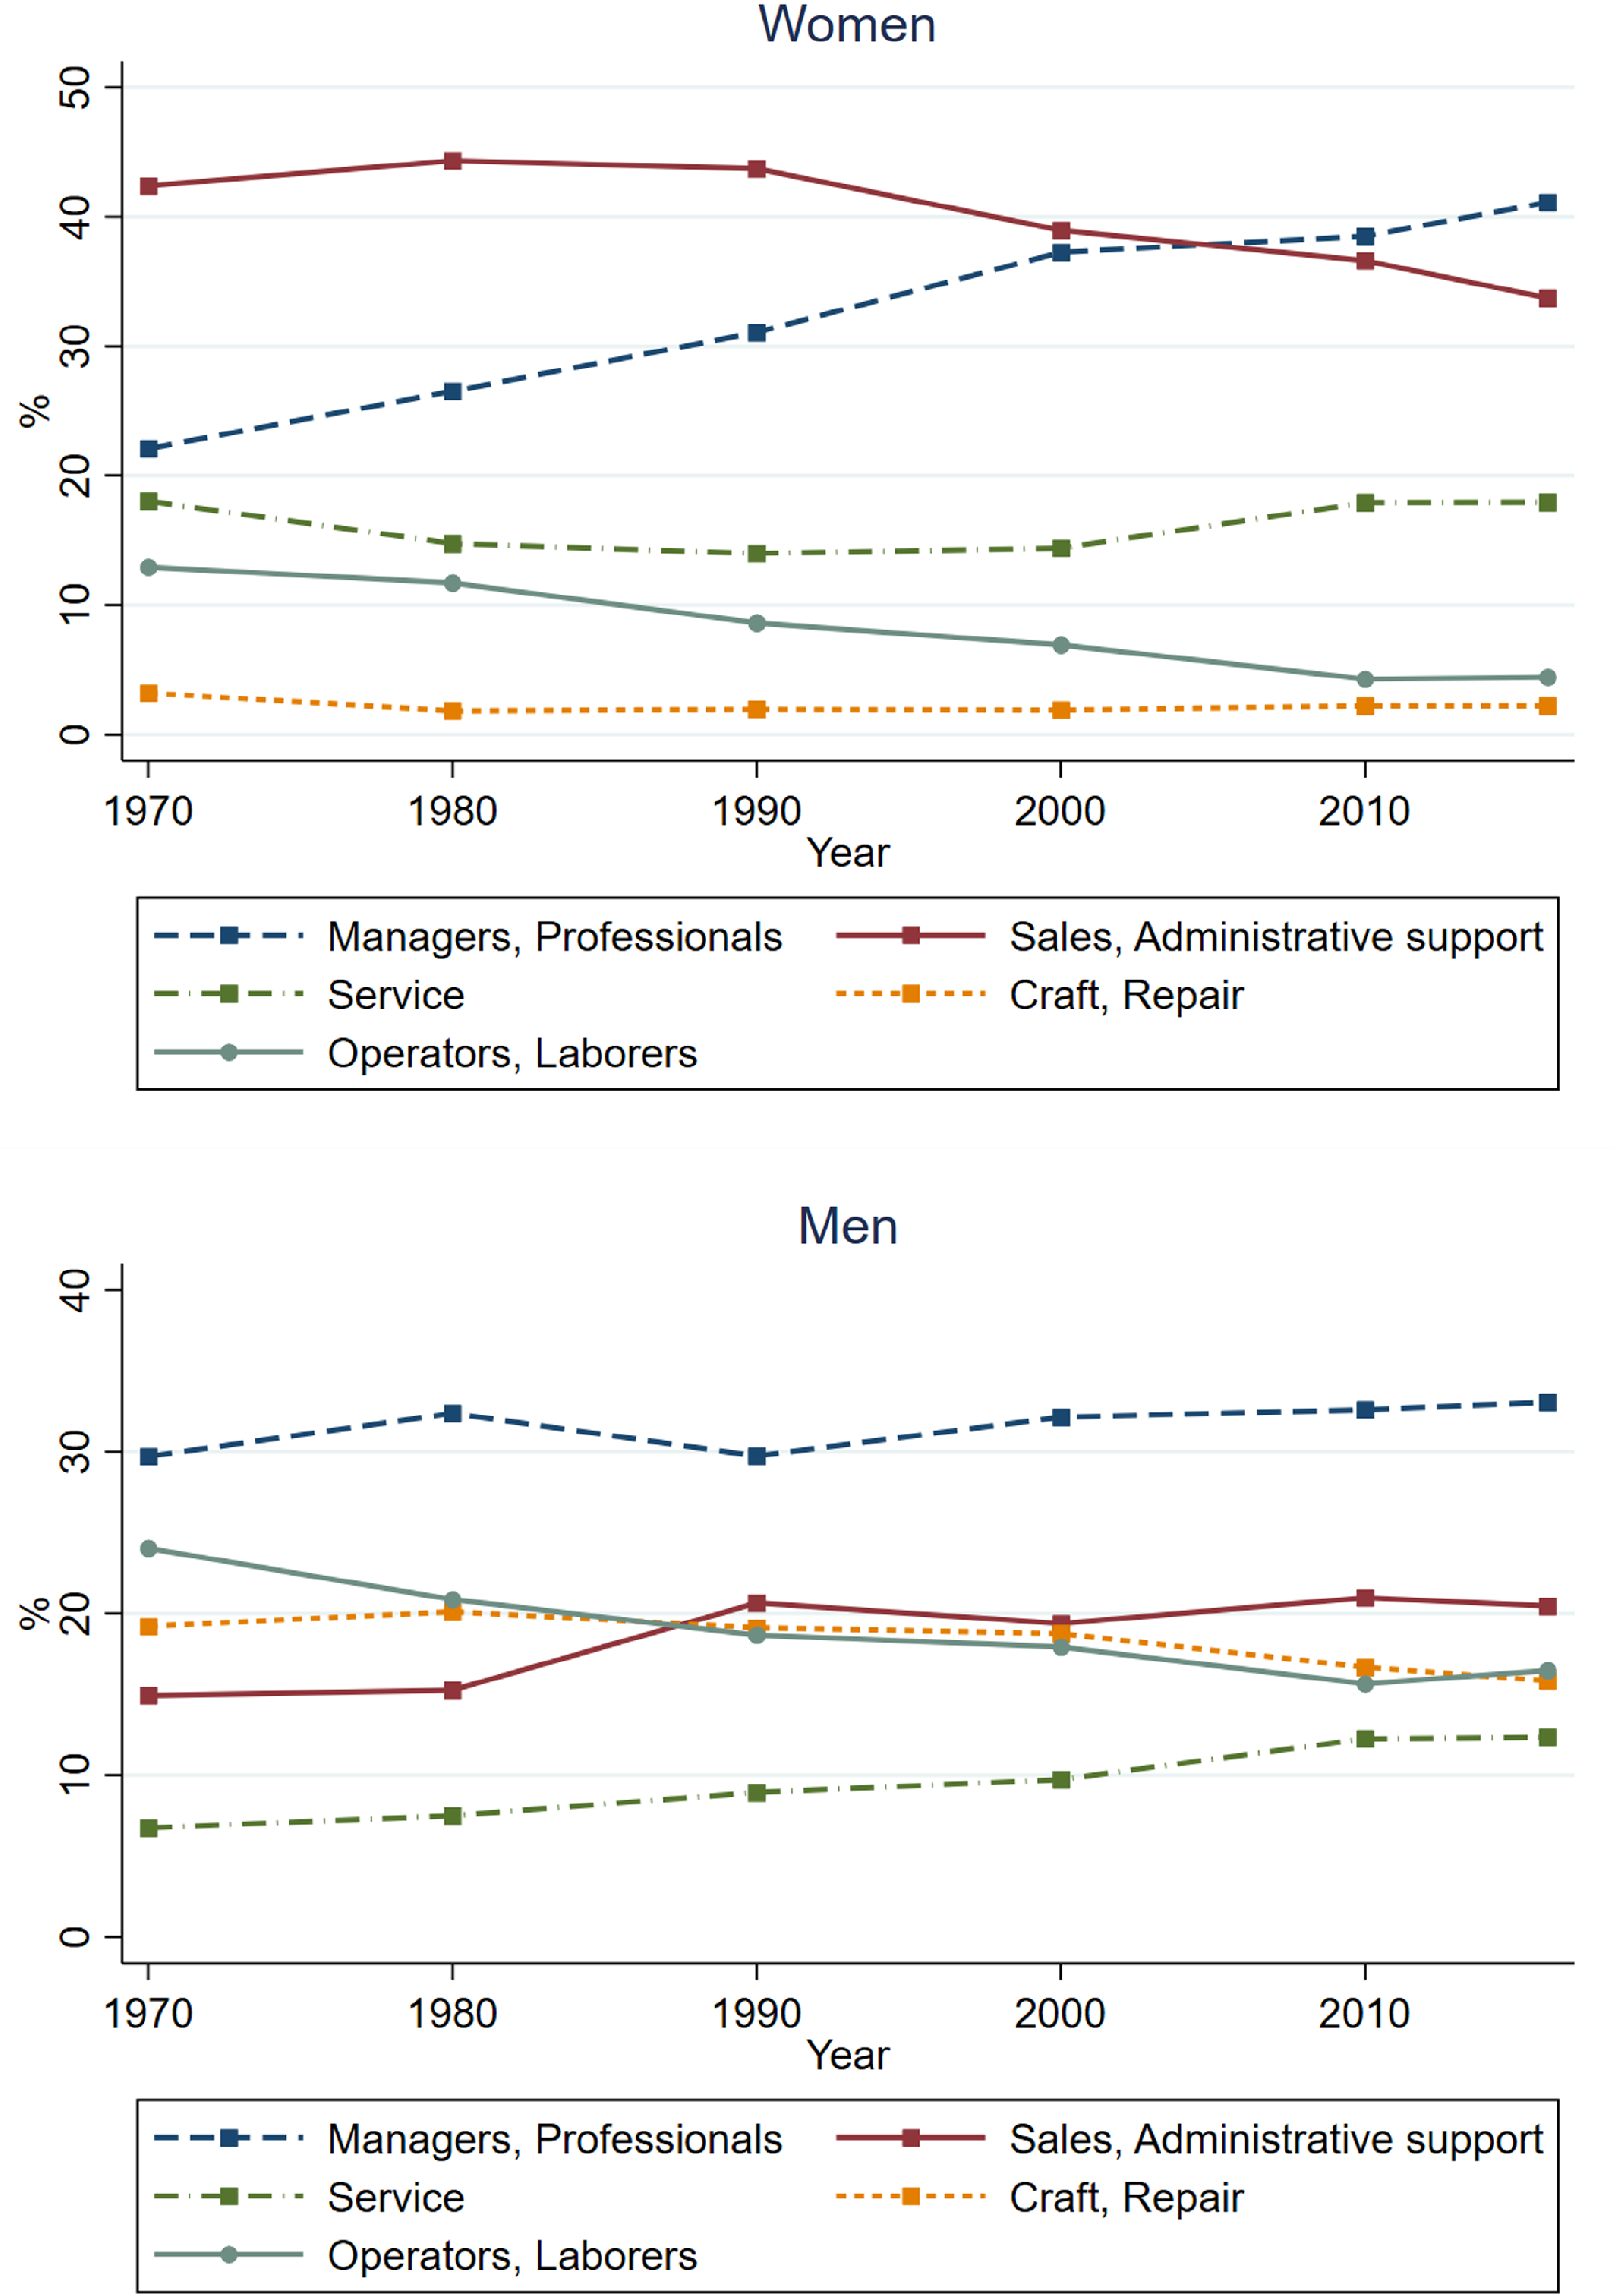
However, the performance of sales and administrative occupations for men has been relatively stable after 1990, as shown in the bottom panel of Figure 3. This suggests that the increase in offshoring since 1990 has had a greater impact on the hours worked by women in this group.
Fact 1. Sales and administrative support occupations, which have the highest offshoring potential, have experienced a decline in the share in women’s hours worked since 1990. At the same time, the share of these occupations in men’s hours worked has remained relatively stable.
The differential impact of offshoring by gender suggests that men’s and women’s main occupations differ in their offshoring potential. Figure 4 shows the ratio of female to male hours worked in each occupation group to test this hypothesis. Sales and administrative support occupations, which have the highest average offshoring potential, consistently have the highest female intensity. They are followed by service occupations, managers and professionals, operators and laborers, and craft and repair occupations. These rankings have not changed since 1970, and more importantly, are exactly the same as the rankings of average offshoring potential among occupation groups. These facts imply that occupations with higher offshoring potential employ more women relative to men.
Ratio of female to male hours worked in each occupation group.
Notes: The figures shown are the total hours worked by women divided by the total hours worked by men in each occupation group and year. The average offshoring potential for each occupation group is; 0.58 (Sales, Administrative support), −0.12 (Service), −0.14 (Managers, Professionals), −0.16 (Operators, Laborers), and −0.82 (Craft, Repair).
Sources: CPS March Supplement, David Dorn’s website.

Fact 2. Occupation groups with higher offshoring potential have a higher female to male hours ratio.
The increase in the female to male hours ratio among managers and professionals can be attributed to the greater improvement in women’s educational attainment.Footnote 8 Cortes et al. (Reference Cortes, Jaimovich and Siu2018) provide an alternative explanation that the demand for female-oriented skills in these occupations has increased.
2.2. Service offshoring
I focus on actual offshoring to corroborate the findings based on offshoring potential in the previous section. Specifically, I highlight the offshoring of services, which has increased since the 1990s, to account for the different movements in the shares of sales and administrative support occupations among each gender’s hours worked.
Traditionally, offshoring has taken place in the form of material offshoring, which occurs when material inputs are outsourced to other countries, mostly in the manufacturing sector. According to Feenstra and Jensen (Reference Feenstra and Jensen2012), material offshoring accounted for 6.6% and 27.0% of intermediate purchases in manufacturing in 1980 and 2006, respectively.
Since the 1990s, a new form of offshoring called service offshoring has emerged and gained prominence. Advances in ICT made some types of services tradable by lowering the technical barriers to transmitting large amounts of information. In addition, China and India began opening their economies for political reasons in the early 1990s, providing the US with cheap offshoring opportunities.Footnote 9 The best-known examples of service offshoring are call centers, tax form preparation, X-ray reading, and software development.
I exploit a widely used proxy for service offshoring from Amiti and Wei (Reference Amiti and Wei2009) due to the lack of data sources that represent the actual degree of service offshoring. The basic idea is that a firm that offshores its service component must import the component back to use it as an input for production. They propose the following methodology, which is analogous to the offshoring measure of Feenstra and Hanson (Reference Feenstra and Hanson1999):
 \begin{equation} SO_{it}=\sum _{j}\frac{IP_{ijt}}{TIP_{it}}\frac{\textit{Import}s_{jt}}{\textit{Consumptio}n_{jt}}, \end{equation}
where
 $i$
and
 $t$
denote industry and year, respectively.
 $j$
denotes each of the four types of service inputs, namely Insurance, Finance, Telecommunication, computer, and information, and Other business services.Footnote
10
 $IP_{ijt}$
is the input purchases of service type
 $j$
by
 $i$
in
 $t$
and
 $TIP_{it}$
is the total non-utility input purchases by
 $i$
in
 $t$
. Consumption is defined as production plus imports minus exports. The measure indicates the share of service input imports and can be considered as a proxy for the foregone demand for domestic service inputs due to offshoring in each year.
I obtain input purchases and production from annual input–output data from the Bureau of Labor Statistics (BLS) and the Bureau of Economic Analysis (BEA).Footnote 11 Although the BEA provides longer time series, the BLS provides more detailed sectors (205 sectors) than the BEA (71 sectors). For this reason, I choose the BLS data as my main source and use the BEA data as an auxiliary measure.
Import and export data are available from the IMF Balance of Payments statistics. Since the IMF does not provide industry-level imports of each service input, I assume that the import share is the same for all industries, as in Amiti and Wei (Reference Amiti and Wei2009).Footnote 12
Figure 5 shows the evolution of service offshoring for all private sectors. From 1997 to 2016, the share of service offshoring in total non-energy input purchases more than doubled, from 0.5% to 1.2%. When offshoring shares are calculated using BEA data with longer time series, service offshoring has increased steadily since the late 1980s. Previous literature finds a similar trend.Footnote 13
Fact 3. Service offshoring has increased since the late 1980s.
To put these numbers in perspective, I perform a simple back-of-the-envelope calculation to obtain the employment effects of service offshoring. First, I calculate employment losses by multiplying the dollar value of service offshoring by the compensation to output ratios and then dividing by compensation per employee in the relevant industries.Footnote 14
The employment loss due to service offshoring based on this calculation increased from around 140,000 in 1997 to 350,000 in 2008 and remained between 350,000 and 400,000 after 2009. The cumulative employment loss due to service offshoring between 1997 and 2016 was about 5.4 million. This loss represents 4.8% of the average total employment in US service-producing industries between 1997 and 2016, which is a non-negligible fraction.
Given that the services sector accounts for a higher share of women’s hours than men’s, the increase in service offshoring is likely to have affected women more adversely. Moreover, within the broad services sector, there is evidence that the service types with a higher share of female hours were imported more.
I run simple fixed effects regressions to see if there is an association between the increase in imports and the female share of hours worked (employment). Each service type is defined as in the BEA’s major categories of US international trade in services. These service types are matched to the industries in the CPS data to compute women’s share of hours worked (employment) based on the Bureau of Economic Analysis (2022).Footnote 15 Since the BEA provides trade in services by major category starting in 1999, the regressions use annual data between 1999 and 2016.
Relationship between the import growth and the female intensity of service types

Notes: In regressions (5) and (6), the share of female hours worked (employment) is instrumented with a one-year lag of the share of female hours (employment). All regressions include service type fixed effects. Standard errors are clustered by each service type. ** and * indicate that the coefficients are statistically significant at the 5% and 10% levels, respectively.
Service offshoring.
Notes: The figures shown are the average shares of service offshoring in total non-energy input purchases in each private industry, weighted by the output of each industry.
Sources: BEA, BLS, IMF Balance of Payments.

Table 1 shows the regression results. As columns (1) and (2) show, both female hours and female employment shares are positively correlated with import growth. Although the additional tests in columns (3) to (6) are not sufficient to establish a causal relationship, the results support the hypothesis that services with higher female intensity are imported more. Columns (3) and (4) include a one-year lag of female intensity in the regressors and columns (5) and (6) instrument female intensity with the lagged variables. These additional results suggest that services with higher female intensity are likely to have experienced higher import growth.
2.3. Offshoring and routine-biased technological change
The mechanism described in the previous sections also seems to work well if we consider automation or RBTC in general instead of service offshoring. This is natural because offshoring and RBTC are similar concepts, especially in terms of their impact on the labor market. In the case of offshoring, some workers lose their jobs due to cheaper foreign labor. In the case of RBTC, computers and IT equipment play the role of displacing workers from their jobs. In fact, a group of researchers including Black and Spitz-Oener (Reference Black and Spitz-Oener2010), Autor and Price (Reference Autor and Price2013), and Cerina et al. (Reference Cerina, Moro and Rendall2021) pointed out that women’s use of routine tasks declined more than men’s.
However, it turns out that offshoring and RBTC are not as closely related as they appear. In addition to an offshorability index, Autor and Dorn (Reference Autor and Dorn2013) also provide the routine task measure of each occupation. This measure is calculated based on the methodology proposed by Autor et al. (Reference Autor, Levy and Murnane2003).Footnote 16 The correlation coefficient between their offshorability index and the routine task measure is −0.02. Given the low correlation between the two measures, it is unlikely that a significant number of occupations with the highest offshorability index, such as “mathematicians and statisticians” and “operations and systems researchers,” were sacrificed by the RBTC.Footnote 17
Furthermore, the close association between offshoring potential and the female to male hours ratio by occupation group (Fact 2) is not strong in the case of RBTC. The average routineness measure computed using Autor and Dorn’s (Reference Autor and Dorn2013) data is the highest for craft and repair occupations (0.91), followed by sales and administrative support (−0.02), operators and laborers (−0.17), managers and professionals (−0.76), and service (−0.84). According to an alternative measure based on Acemoglu and Autor (Reference Acemoglu, Autor, Acemoglu and Autor2011), operators and laborers (0.66) have the highest routineness, followed by craft and repair (0.10), sales and administrative support (0.02), service (−0.27), and managers and professionals (−0.74).Footnote 18 The occupation groups that are most vulnerable to RBTC are craft and repair, and operators and laborers, which have traditionally been male occupations (Figure 4).
Figure 3 also shows that the hours worked share of these occupation groups has declined steadily for both women and men since 1980. The timing of the fall is inconsistent with the flattening of the gender hours ratio. More importantly, the RBTC should have had a more negative impact on men’s hours worked since 1980, which is at odds with the leveling off of the gender hours ratio. For these reasons, this paper proposes service offshoring rather than the RBTC as a candidate for explaining the change in the gender hours ratio.
3. The model
In this section, I present a model with two market sectors and two gender-specific labor inputs. I introduce a continuum of occupations defined by their offshorability to incorporate the elements of offshoring into the model. All the proofs for the propositions and lemmas can be found in Appendix A.
3.1. Setup
Firms. There are two sectors in the economy: goods and services. Firms in each sector produce final goods by combining occupations as follows:
 \begin{equation} Y_{j}=A_{j}\underset{\equiv L_{j}}{\underbrace{\left[\int _{0}^{1}L_{j}\left(k\right)^{\frac{\eta -1}{\eta }}dk\right]^{\frac{\eta }{\eta -1}}}}, \end{equation}
where
 $j=g,s$
denotes either the goods or the services sector;
 $A_{j}$
is the sector-specific productivity, which grows at the rate of
 $\gamma _{j}=\dot{A}_{j}/A_{j} ; L_{j}(k)$
is the labor input of occupation
 $k$
in sector
 $j$
; and
 $L_{j}$
is the labor aggregate in sector
 $j$
. I consider each occupation as a collection of tasks and assume that each occupation is defined and ordered only by a continuous index
 $k$
.
 $k$
indicates the offshorability of each occupation and lies on
 $[0,1]$
.
 $\eta$
is the elasticity of substitution between occupations in the production process.Footnote
19
Occupations can be supplied by either domestic or offshored labor. Offshored labor can perfectly substitute for domestic labor:
 \begin{equation} L_{j}\left(k\right)=L_{j}^{D}\left(k\right)+L_{j}^{\mathrm{*}}\left(k\right), \end{equation}
where
 $L_{j}^{D}(k)$
and
 $L_{j}^{\mathrm{*}}(k)$
are the labor inputs provided by domestic and offshored labor in occupation
 $k$
, sector
 $j$
, respectively.
Domestic labor is the Constant Elasticity of Substitution (CES) aggregate of male and female hours worked:
 \begin{equation} L_{j}^{D}\left(k\right)=\left[\alpha _{j}\left(k\right)L_{fj}\left(k\right)^{\frac{\varepsilon -1}{\varepsilon }}+\left(1-\alpha _{j}\left(k\right)\right)L_{mj}\left(k\right)^{\frac{\varepsilon -1}{\varepsilon }}\right]^{\frac{\varepsilon }{\varepsilon -1}}, \end{equation}
where
 $L_{fj}(k)$
and
 $L_{mj}(k)$
are hours worked by women and men, respectively, in occupation
 $k$
, sector
 $j$
.
 $\varepsilon$
is the elasticity of substitution between male and female hours.
 $\alpha _{j}(k)$
is the weight of women in occupation
 $k$
, sector
 $j$
within each domestic labor aggregate and is on
 $[0,1]$
. To reflect the Fact 2 that more women are hired in occupations with high offshorability,
 $\alpha _{j}^{\mathrm{'}}(k)\gt 0$
is assumed. I allow
 $\alpha _{j}(k)$
to differ across sectors, but as will be shown later, the model implies a higher female to male hours ratio in the service sector.Footnote
20
Free labor mobility is assumed, so that the wage for each gender is the same across occupations and sectors. For domestic labor, there is a gender wage gap between men (
 $w_{m}$
) and women (
 $w_{f}$
).
There is no gender gap for offshored labor and each foreign worker receives
 $w^{\mathrm{*}}$
as wage.
 $w^{\mathrm{*}}$
is exogenously given. The actual hiring cost of firms using offshored labor is
 $\beta _{j}\tau (k)w^{\mathrm{*}}$
.
 $\beta _{j}$
and
 $\tau (k)$
denote the common and occupation-specific components of offshoring costs, respectively.
 $\beta _{j}$
is specific to each sector
 $j$
. If
 $\beta _{j}$
is lower, the sector’s offshoring costs would be cheaper for all occupations, inducing firms to use more offshored labor. Since material offshoring is more common than service offshoring,
 $\beta _{g}\lt \beta _{s}$
generally holds.Footnote
21
The rapid development of ICT since the 1990s is one factor that could reduce
 $\beta _{j}$
by lowering the cost of offshoring. I impose
 $\tau \mathrm{'}(k)\lt 0$
to ensure that an occupation with higher offshorability incurs a lower offshoring costs on firms and thus is more likely to actually be offshored.
Households. Household utility is determined by the joint consumption of goods and services and the leisure of a husband and a wife:
 \begin{equation} u\left(c_{g},c_{s},L_{l}\right)=\ln C+\delta \ln L_{l}, \end{equation}
 \begin{equation} C=\left[\omega c_{g}^{\frac{\rho -1}{\rho }}+\left(1-\omega \right)c_{s}^{\frac{\rho -1}{\rho }}\right]^{\frac{\rho }{\rho -1}}, \end{equation}
 \begin{equation} L_{l}=\left[\alpha _{l}L_{fl}^{\frac{\varepsilon _{l}-1}{\varepsilon _{l}}}+\left(1-\alpha _{l}\right)L_{ml}^{\frac{\varepsilon _{l}-1}{\varepsilon _{l}}}\right]^{\frac{\varepsilon _{l}}{\varepsilon _{l}-1}}, \end{equation}
where
 $C$
is the aggregate consumption of goods and services;
 $\delta$
is the weight of leisure relative to consumption in the utility function;
 $L_{l}$
is the CES combination of male and female leisure within each household;
 $\omega$
is the weight on consumption of goods;
 $\rho$
is the elasticity of substitution between consumption of goods and services;
 $\alpha _{l}$
is the weight of female leisure within the leisure aggregate; and
 $\varepsilon _{l}$
is the elasticity of substitution between male and female leisure. I assume
 $\rho \lt 1$
, suggesting that goods and services are gross complements.
Household income depends on the gender-specific wages and hours worked by a husband and wife, which is equal to the time endowment minus the time for leisure. Households use their income to consume goods and services:
 \begin{equation} p_{g}c_{g}+p_{s}c_{s}=w_{m}\left(T_{m}-L_{ml}\right)+w_{f}\left(T_{f}-L_{fl}\right). \end{equation}
Equilibrium. The competitive equilibrium consists of wages (
 $w_{m},w_{f}$
), prices (
 $p_{g},p_{s}$
), hours worked by domestic workers
 $\{L_{fg}(k),L_{fs}(k),L_{mg}(k),L_{ms}(k)\}_{k\in [0,1]}$
, hours worked by offshored labor
 $\{L_{g}^{\mathrm{*}}(k),L_{s}^{\mathrm{*}}(k)\}_{k\in [0,1]}$
, leisure (
 $L_{fl},L_{ml}$
), consumption (
 $c_{g},c_{s}$
), and output (
 $Y_{g},Y_{s}$
) such that:
-
1. Given wages and prices, firms maximize profits subject to (2)–(4) and households maximize utility (5) subject to (6)–(8);
-
2. Wages and prices clear the goods and labor markets:
 \begin{equation} c_{j}=Y_{j}, \end{equation}
 \begin{equation} T_{m}-L_{ml}=\int _{0}^{1}L_{mg}\left(k\right)dk+\int _{0}^{1}L_{ms}\left(k\right)dk, \end{equation}
 \begin{equation} T_{f}-L_{fl}=\int _{0}^{1}L_{fg}\left(k\right)dk+\int _{0}^{1}L_{fs}\left(k\right)dk. \end{equation}
3.2. Firm’s profit maximization
Since domestic and offshored labor aggregates are perfect substitutes, firms will hire either domestic or offshored labor, taking into account the cost of hiring.
Consider the case where firms hire only domestic labor because it is cheaper than offshored labor. In this domain,
 $L_{j}^{\mathrm{*}}(k)=0$
for all
 $k$
and firms solve the following maximization problem for all
 $k\in \{k\mid L_{j}^{\mathrm{*}}(k)=0\}$
given
 $w_{f}$
and
 $w_{m}$
:
 \begin{equation*} max_{\left\{L_{fj}\left(k\right),L_{mj}\left(k\right)\right\}_{k}}p_{j}A_{j}\left[\int _{k}L_{j}^{D}\left(k\right)^{\frac{\eta -1}{\eta }}dk\right]^{\frac{\eta }{\eta -1}}-w_{f}\int _{k}L_{fj}\left(k\right)dk-w_{m}\int _{k}L_{mj}\left(k\right)dk, \end{equation*}
subject to (4). If the wage of hiring a unit of
 $L_{j}^{D}(k)$
is denoted by
 $w_{j}^{D}(k)$
, the firms’ maximization problem can alternatively be written as:
 \begin{equation*} max_{\left\{L_{j}^{D}\left(k\right)\right\}_{k}}p_{j}A_{j}\left[\int _{k}L_{j}^{D}\left(k\right)^{\frac{\eta -1}{\eta }}dk\right]^{\frac{\eta }{\eta -1}}-\int _{k}w_{j}^{D}\left(k\right)L_{j}^{D}\left(k\right)dk. \end{equation*}
Combining the first order conditions of the two maximization problems gives the expression for
 $w_{j}^{D}(k)$
:
 \begin{equation} w_{j}^{D}\left(k\right)=\left[\alpha _{j}\left(k\right)^{\varepsilon }w_{f}^{1-\varepsilon }+\left(1-\alpha _{j}\left(k\right)\right)^{\varepsilon }w_{m}^{1-\varepsilon }\right]^{\frac{1}{1-\varepsilon }}. \end{equation}
Since the cost of hiring a unit of offshored labor for occupation
 $k$
is
 $\beta _{j}\tau (k)w^{\mathrm{*}}$
, firms compare
 $w_{j}^{D}(k)$
and
 $\beta _{j}\tau (k)w^{\mathrm{*}}$
to decide whether to hire domestic or offshored labor.
The cutoff offshorability
 $K_{j}$
for each sector
 $j$
is defined such that
 $w_{j}^{D}(K_{j})=\beta _{j}\tau (K_{j})w^{\mathrm{*}}$
. Lemma 1 states that the existence of a unique cutoff for each sector can be guaranteed under a number of conditions. These conditions include the existence of offshoring in both sectors and the faster decrease in offshoring costs than in domestic hiring costs as offshorability increases. Then, occupations with offshorability higher than
 $K_{j}$
are offshored and those with offshorability lower than
 $K_{j}$
are supplied by domestic workers.
Lemma 1.
If
 $w_{j}^{D}(0)\lt \beta _{j}\tau (0)w^{\mathrm{*}}$
,
 $w_{j}^{D}(1)\gt \beta _{j}\tau (1)w^{\mathrm{*}}$
, and
 $\partial w_{j}^{D}(k)/\partial k\gt \partial (\beta _{j}\tau (k)w^{\mathrm{*}})/\partial k$
for all
 $j$
and
 $k$
, then there exists a unique cutoff
 $K_{j}$
that satisfies the following conditions:
-
1.
 $w_{j}^{D}(K_{j})=\beta _{j}\tau (K_{j})w^{\mathrm{*}}$
,
-
2.
$L_{j}^{D}(k)\gt 0$
and
$L_{j}^{\mathrm{*}}(k)=0$
for
$0\leq k\leq K_{j}$
, -
3.
$L_{j}^{D}(k)=0$
and
$L_{j}^{\mathrm{*}}(k)\gt 0$
for
$K_{j}\lt k\leq 1$
.


One feature to note is that
 $K_{j}$
increases with
 $\beta _{j}$
. The intuition is straightforward; a lower
 $\beta _{j}$
means that the cost of offshoring in sector
 $j$
is reduced, so the sector hires more offshored labor, which is realized by a lower
 $K_{j}$
in the model.Footnote 22
Lemma 2.
When Lemma 1 holds,
 $\frac{\partial K_{j}}{\partial \beta _{j}}\gt 0.$
Given
 $\{w_{f},w_{m},p_{g},p_{s}\}$
and the cutoff
 $K_{j}$
, the firm’s profit maximization problem is
 \begin{equation*} max_{\left\{L_{fj}\left(k\right),L_{mj}\left(k\right),L_{j}^{\mathrm{*}}\left(k\right)\right\}_{k\in \left[0,1\right]}}p_{j}Y_{j}-\int _{0}^{K_{j}}w_{j}^{D}\left(k\right)L_{j}^{D}\left(k\right)dk-\int _{K_{j}}^{1}\beta _{j}\tau \left(k\right)w^{\mathrm{*}}L_{j}^{\mathrm{*}}\left(k\right)dk, \end{equation*}
subject to (2)–(4). Combining the first order conditions gives:
 \begin{equation} \frac{L_{fj}\left(k\right)}{L_{mj}\left(k\right)}=\varphi _{j}\left(k\right)^{\varepsilon }x^{-\varepsilon }, \end{equation}
where
 $\varphi _{j}(k)\equiv \alpha _{j}(k)/(1-\alpha _{j}(k))$
,
 $x\equiv w_{f}/w_{m}$
,
 $0\leq k\leq K_{j}$
, and
 $j=g,s$
.
 $x$
is the gender wage ratio. The ratio of female to male hours worked in each occupation increases in
 $k$
, indicating that occupations with higher offshorability hire more women.
By solving for the relationship between prices and wages, I derive the profit-maximizing condition of
 $L_{j}$
:
 \begin{equation} p_{j}A_{j}=\underset{\equiv H\left(\beta _{j},x\right)}{\underbrace{\left[w_{f}^{1-\eta }\int _{0}^{K_{j}}\left(\alpha _{j}\left(k\right)^{-\frac{\varepsilon }{\varepsilon -1}}I_{j}\left(k,x\right)^{\frac{1}{\varepsilon -1}}\right)^{1-\eta }dk+\left(\beta _{j}w^{\mathrm{*}}\right)^{1-\eta }\int _{K_{j}}^{1}\tau \left(k\right)^{1-\eta }dk\right]^{\frac{1}{1-\eta }}}}, \end{equation}
where
 $I_{j}(k,x)\equiv w_{f}L_{fj}(k)/(w_{f}L_{fj}(k)+w_{m}L_{mj}(k))=1/(1+\varphi _{j}(k)^{-\varepsilon }x^{\varepsilon -1})$
.
 $I_{j}(k,x)$
denotes the wage bill share of female labor in occupation
 $k$
, sector
 $j$
.
 $p_{j}A_{j}$
is the value of marginal productivity of the labor aggregate,
 $L_{j}$
.
 $H(\beta _{j},x)$
, the right-hand side of (14), is the cost of hiring a unit of
 $L_{j}$
.
The hiring cost
 $H(\beta _{j},x)$
increases in
 $\beta _{j}$
because a lower
 $\beta _{j}$
induces firms to use more offshored labor, which is cheaper, thereby reducing the total hiring cost. This relationship represents the scaling effect of offshoring due to productivity gains that has been extensively discussed in the literature.
3.3. Household’s utility maximization
The household’s utility maximization generates the following conditions for consumption and leisure:
 \begin{equation} \frac{c_{s}}{c_{g}}=\left(\frac{p_{s}}{p_{g}}\frac{\omega }{1-\omega }\right)^{-\rho }, \end{equation}
 \begin{equation} \frac{L_{fl}}{L_{ml}}=\varphi _{l}^{\varepsilon _{l}}x^{-{\varepsilon _{l}}}, \end{equation}
where
 $\varphi _{l}\equiv \alpha _{l}/(1-\alpha _{l})$
.
Using the property of the log utility function and (16), I solve for the leisure of a woman and a man:
 \begin{equation} L_{fl}=\frac{\delta }{1+\delta }\frac{w_{m}T_{m}+w_{f}T_{f}}{w_{f}}I_{l}\left(x\right), \end{equation}
 \begin{equation} L_{ml}=\varphi _{l}^{-\varepsilon _{l}}x^{{\varepsilon _{l}}}\frac{\delta }{1+\delta }\frac{w_{m}T_{m}+w_{f}T_{f}}{w_{f}}I_{l}\left(x\right), \end{equation}
where
 $I_{l}(x)\equiv w_{f}L_{fl}/(w_{f}L_{fl}+w_{m}L_{ml})=1/(1+\varphi _{l}^{-\varepsilon _{l}}x^{{\varepsilon _{l}}-1})$
.
 $I_{l}(x)$
is the implicit wage bill share of women in leisure.
3.4. Hours worked in the equilibrium
Through the goods market clearing condition (9), the profit maximization condition (14), and the utility maximization condition (15), the ratio between labor aggregates in the goods and services sectors in equilibrium can be obtained:
 \begin{equation} \frac{L_{g}}{L_{s}}=\frac{A_{s}}{A_{g}}\frac{c_{g}}{c_{s}}=\left[\underset{\equiv H_{sg}\left(\beta _{s},\beta _{g},x\right)}{\underbrace{\frac{H\left(\beta _{s},x\right)}{H\left(\beta _{g},x\right)}}}\frac{\omega }{1-\omega }\right]^{\rho }\left(\frac{A_{g}}{A_{s}}\right)^{\rho -1}. \end{equation}
 $H_{sg}(\beta _{s},\beta _{g},x)$
is the ratio of hiring costs in services to goods. Since
 $\partial H(\beta _{j},x)/\partial \beta _{j}\gt 0$
,
 $\partial H_{sg}(\beta _{s},\beta _{g},x)/\partial \beta _{s}\gt 0$
and
 $\partial H_{sg}(\beta _{s},\beta _{g},x)/\partial \beta _{g}\lt 0$
. Using the links between labor aggregates and labor inputs in each sector, the ratio of hours worked in the goods and services sectors can be obtained:
 \begin{equation} \frac{L_{fg}\left(k\right)}{L_{fs}\left(k\right)}=H_{sg}\left(\beta _{s},\beta _{g},x\right)^{\rho -\eta }\underset{\equiv R_{sg}\left(A_{g},A_{s}\right)}{\underbrace{\left(\frac{A_{g}}{A_{s}}\right)^{\rho -1}\left(\frac{\omega }{1-\omega }\right)^{\rho }}}\underset{\equiv \alpha _{sg,f}\left(k\right)}{\underbrace{\left[\frac{\alpha _{g}\left(k\right)}{\alpha _{s}\left(k\right)}\right]^{\frac{\varepsilon \left(\eta -1\right)}{\varepsilon -1}}}}\underset{\equiv I_{sg}\left(k,x\right)}{\underbrace{\left[\frac{I_{g}\left(k,x\right)}{I_{s}\left(k,x\right)}\right]^{\frac{\varepsilon -\eta }{\varepsilon -1}}}}, \end{equation}
 \begin{equation} \frac{L_{mg}\left(k\right)}{L_{ms}\left(k\right)}=H_{sg}\left(\beta _{s},\beta _{g},x\right)^{\rho -\eta }\left(\frac{A_{g}}{A_{s}}\right)^{\rho -1}\left(\frac{\omega }{1-\omega }\right)^{\rho }\underset{\equiv \alpha _{sg,m}\left(k\right)}{\underbrace{\left[\frac{\alpha _{g}\left(k\right)}{\alpha _{s}\left(k\right)}\right]^{\frac{\varepsilon \left(\eta -\varepsilon \right)}{\varepsilon -1}}\left[\frac{1-\alpha _{g}\left(k\right)}{1-\alpha _{s}\left(k\right)}\right]^{\varepsilon }}}\left[\frac{I_{g}\left(k,x\right)}{I_{s}\left(k,x\right)}\right]^{\frac{\varepsilon -\eta }{\varepsilon -1}}, \end{equation}
for
 $0\leq k\leq K_{g}$
.
The higher female intensity in the service sector can be derived from the assumptions in the setup and (13). Since
 $\alpha _{j}\mathrm{'}(k)\gt 0$
,
 $\varphi _{j}(k)$
also increases with
 $k$
. According to (13), the female intensity (
 $L_{fj}(k)/L_{mj}(k)$
) in each sector is higher for an occupation with higher offshorability.
 $K_{g}\lt K_{s}$
holds using a previous assumption of
 $\beta _{g}\lt \beta _{s}$
and the fact that
 $K_{j}$
increases in
 $\beta _{j}$
(Lemma 2). Since occupations with offshorability below the cutoff
 $K_{j}$
hire only domestic labor (Lemma 1), the goods and services sectors hire domestic labor in the region of
 $[0,K_{g}]$
and
 $[0,K_{s}]$
, respectively. In other words, firms in the services sector additionally hire domestic occupations in
 $[K_{g},K_{s}]$
compared to the goods sector. Among the range of
 $[0,K_{s}]$
where the service sector employs domestic labor, this additional range of
 $[K_{g},K_{s}]$
has the highest female intensity by (13). If
 $\alpha _{s}(k)\gt \alpha _{g}(k)$
, the female intensity of the goods sector is lower than that of the services sector in
 $[0,K_{g}]$
, unless the distribution of
 $L_{mg}(k)$
is highly skewed to the right with respect to
 $k$
compared to
 $L_{ms}(k)$
.Footnote 23 As a result, the overall female to male hours ratio is higher in the services sector.
In sum, this result derives from the unequal demand for each gender-specific labor input across a continuum of occupations and the different extent of offshoring across sectors. Proposition 1 formally establishes this relationship.
Proposition 1.
If Lemma 1 holds,
 $\beta _{g}\lt \beta _{s}$
,
 $\alpha _{j}^{\mathrm{'}}(k)\gt 0$
,
 $\alpha _{s}(k)\gt \alpha _{g}(k)$
, and
 $\int _{0}^{K_{g}}\varphi _{g}(k)^{\varepsilon }L_{mg}(k)dk /\int _{0}^{K_{g}}L_{mg}(k)dk\leq \int _{0}^{K_{g}}\varphi _{s}(k)^{\varepsilon }L_{ms}(k)dk/\int _{0}^{K_{g}}L_{ms}(k)dk$
, the female to male hours ratio in the goods sector is lower than the ratio in the services sector:
 \begin{equation*} \frac{\int _{0}^{K_{g}}L_{fg}\left(k\right)dk}{\int _{0}^{K_{g}}L_{mg}\left(k\right)dk}\lt \frac{\int _{0}^{K_{s}}L_{fs}\left(k\right)dk}{\int _{0}^{K_{s}}L_{ms}\left(k\right)dk}. \end{equation*}
Finally, plugging the derivations for leisure (17) and (18) into the labor market clearing conditions (10) and (11) yields the following equilibrium conditions:
 \begin{equation} T_{f}-\frac{\delta }{1+\delta }\frac{w_{m}T_{m}+w_{f}T_{f}}{w_{f}}I_{l}\left(x\right)=\int _{0}^{K_{g}}L_{fg}\left(k\right)dk+\int _{0}^{K_{s}}L_{fs}\left(k\right)dk, \end{equation}
 \begin{equation} T_{m}-\varphi _{l}^{-\varepsilon _{l}}x^{{\varepsilon _{l}}}\frac{\delta }{1+\delta }\frac{w_{m}T_{m}+w_{f}T_{f}}{w_{f}}I_{l}\left(x\right)=\int _{0}^{K_{g}}L_{mg}\left(k\right)dk+\int _{0}^{K_{s}}L_{ms}\left(k\right)dk. \end{equation}
3.5. Effects of productivity growth on the gender hours ratio
The female to male hours ratio in the aggregate economy is written as follows:
 \begin{equation} FM=\frac{\int _{0}^{K_{g}}L_{fg}\left(k\right)dk+\int _{0}^{K_{s}}L_{fs}\left(k\right)dk}{\int _{0}^{K_{g}}L_{mg}\left(k\right)dk+\int _{0}^{K_{s}}L_{ms}\left(k\right)dk}. \end{equation}
Using (13), (20), and (21), the female to male hours ratio can be formulated in terms of
 $L_{fs}(k),H_{sg}(\beta _{s},\beta _{g},x), R_{sg}(A_{g},A_{s})$
,
 $\alpha _{sg,f}(k)$
,
 $\alpha _{sg,m}(k)$
, and
 $I_{sg}(k,x)$
:
 \begin{equation} FM=\frac{R_{sg}{H_{sg}}^{\rho -\eta }\int _{0}^{K_{g}}\alpha _{sg,f}\left(k\right)I_{sg}\left(k,x\right)L_{fs}\left(k\right)dk+\int _{0}^{K_{s}}L_{fs}\left(k\right)dk}{\left[R_{sg}{H_{sg}}^{\rho -\eta }\int _{0}^{K_{g}}\alpha _{sg,m}\left(k\right)I_{sg}\left(k,x\right)\varphi _{s}\left(k\right)^{-\varepsilon }L_{fs}\left(k\right)dk+\int _{0}^{K_{s}}\varphi _{s}\left(k\right)^{-\varepsilon }L_{fs}\left(k\right)dk\right]x^{\varepsilon }}. \end{equation}
In examining the effects of productivity growth and offshoring on the gender hours ratio, the higher female to male hours ratio in services (Proposition 1) plays a crucial role. In particular, the following variant of Proposition 1 holds:
 \begin{equation} \int _{0}^{K_{g}}L_{fg}\left(k\right)dk\int _{0}^{K_{s}}L_{ms}\left(k\right)dk-\int _{0}^{K_{s}}L_{fs}\left(k\right)dk\int _{0}^{K_{g}}L_{mg}\left(k\right)dk\lt 0. \end{equation}
The female to male hours ratio continues to rise when labor productivity growth is higher in the goods sector than in the services sector. This is formally stated in Proposition 2. If
 $\gamma _{g}\gt \gamma _{s}$
, then
 $R_{sg}(A_{g},A_{s})=(\omega /(1-\omega ))^{\rho }(A_{g}/A_{s})^{\rho -1}$
decreases over time as
 $A_{g}/A_{s}$
grows at a rate of
 $\gamma _{g}-\gamma _{s}$
and
 $\rho \lt 1$
. By (20) and (21), the decrease in
 $R_{sg}(A_{g},A_{s})$
reduces hours worked in the goods sector relative to the services sector. Intuitively, higher productivity growth in the goods sector leads to a decline in the relative price of goods. Since goods and services are poor substitutes for households, the relative expenditure share of services rises and more labor must be hired in the service sector in equilibrium. The higher female intensity in the service sector suggests that the aggregate female to male hours ratio would rise in this case.
Proposition 2.
If Proposition 1 holds, the aggregate female to male hours ratio increases over time as
 $\gamma _{g}\gt \gamma _{s}$
.
3.6. Effects of offshoring on the gender hours ratio
Next, Proposition 3 claims that a decrease in offshoring costs in the service sector
 $\beta _{s}$
leads to a decrease in the gender hours ratio as long as
 $\beta _{g}\lt \beta _{s}$
after the change. The effect of a change in
 $\beta _{s}$
on
 $FM$
can be decomposed into two components: a direct effect and an indirect effect through a change in
 $K_{s}$
. The direct effect works through a change in
 $H_{sg}(\beta _{s},\beta _{g},x)$
. A decrease in
 $\beta _{s}$
would cause the ratio of hiring costs
 $H_{sg}(\beta _{s},\beta _{g},x)$
to fall. It raises the ratio of hours worked in goods to hours worked in services by (20) and (21). This is because firms in the services sector react to a decrease in labor costs by hiring cheaper offshored labor, since occupations taken by foreign labor can easily replace those taken by domestic labor due to the high substitutability between occupations under the assumption of
 $\eta \gt \rho$
. This force reduces the ratio of female to male hours due to the lower female intensity in the goods sector.
As
 $\beta _{s}$
decreases, so does
 $K_{s}$
(Lemma 2). As
 $K_{s}$
decreases, the service sector employs more offshored labor and sheds domestic labor. However, the occupations that are replaced by offshoring as a result of a fall in
 $K_{s}$
have the highest offshorability among the previously employed domestic occupations, which implies that the female intensity in these occupations is also the highest. Therefore, the decrease in
 $K_{s}$
leads to a decrease in the female to male hours ratio. Putting these two forces together, the female to male hours ratio clearly decreases when
 $\beta _{s}$
falls.
Proposition 3.
If Proposition 1 holds and
 $\eta \gt \rho$
, the aggregate female to male hours ratio falls as
 $\beta _{s}$
decreases and
 $\beta _{g}\lt \beta _{s}$
is satisfied after the change.
On the other hand, the effect of a change in
 $\beta _{g}$
on the gender hours ratio is ambiguous. The sign of the direct effect is negative, but there is uncertainty about the indirect effect. If
 $K_{g}$
is relatively far from
 $K_{s}$
and the female weight
 $\alpha _{j}(k)$
is highly sensitive to the offshorability of each occupation, then there is a possibility that the indirect effect will also become negative and the female to male hours ratio could increase as
 $\beta _{g}$
decreases. These conditions imply that the goods sector employed few women in the first place because the sector only hired domestic labor in less offshorable occupations compared to the services sector. As a result, the impact of a decrease in
 $\beta _{g}$
on female labor is limited, while it has a negative impact on male labor, causing the female to male ratio to increase. However, these conditions are very restrictive, and if any of the above conditions are not met, it is not clear in which direction
 $\beta _{g}$
would affect the gender hours ratio.
3.7. Notes on the gender productivity wedge
Although the model abstracts from the source of the gender wage gap, there is one element that could introduce the best-known source, gender discrimination, into the model. It is
 $\alpha _{j}(k)$
, which is the weight of women in occupation
 $k$
and sector
 $j$
within the production function. As (13) suggests,
 $\alpha _{j}(k)$
is closely related to the gender wage ratio,
 $x$
. Previous literature also supports the use of a wedge in the women’s comparative advantage parameter to represent gender discrimination. For example, Ngai and Petrongolo (Reference Ngai and Petrongolo2017) interpret the wedge to reflect factors that reduce women’s perceived productivity relative to men, while Buera et al. (Reference Buera, Kaboski and Zhao2019) and Rendall (Reference Rendall2024) view gender discrimination as a wedge between women’s and men’s wages. Consistent with these papers, an increase in
 $\alpha _{j}(k)$
over time can be viewed as a reduction in the wedge, which could translate into less gender discrimination.
However, a rise in
 $\alpha _{j}(k)$
could imply other factors relevant to the production function, such as women’s educational attainment. In fact, (13) implies that the interpretation of
 $\alpha _{j}(k)$
depends on the potential source of the gender wage gap, and vice versa. If one believes that the gender wage gap is mainly due to discrimination (characteristics favored in the labor market), one is likely to think that an increase in
 $\alpha _{j}(k)$
represents a decrease in gender discrimination (an improvement in women’s labor market characteristics). Recognizing that
 $\alpha _{j}(k)$
can be interpreted in different ways, I will simply refer to
 $\alpha _{j}(k)$
as the gender productivity wedge in each occupation, without specifying the exact source of the wedge.
To predict the response to
 $FM$
when
 $\alpha _{j}(k)$
is increased for all
 $k$
, I start with the lemma that firms would choose to employ the labor aggregate
 $L_{j}$
to the extent that
 $\alpha _{j}(k)=I_{j}(k,x)$
is satisfied for all
 $k$
. This condition can be derived from the expression for
 $H(\beta _{j},x)$
in (14).
Lemma 3.
 $H(\beta _{j},x)$
is minimized if
 $\alpha _{j}(k)=I_{j}(k,x)$
for all
 $k$
and
 $j$
.
Intuitively,
 $\alpha _{j}(k)$
is the parameter directly relevant to the marginal productivity of female labor, and
 $I_{j}(k,x)$
is the wage bill share of women in occupation
 $k$
. The lemma implies that there is a unique, profit-maximizing level of
 $H(\beta _{j},x)$
and
 $H_{sg}(\beta _{s},\beta _{g},x)=H(\beta _{s},x)/H(\beta _{g},x)$
for a given
 $\alpha _{j}(k)$
.
However, predicting the effect of
 $\alpha _{j}(k)$
on
 $FM$
becomes a more difficult task after this step. First, it is not qualitatively clear whether
 $H_{sg}(\beta _{s},\beta _{g},x)$
would increase or decrease as
 $\alpha _{j}(k)$
increases. In addition,
 $\alpha _{j}(k)$
also appears in
 $\alpha _{sg,f}(k)$
,
 $\alpha _{sg,m}(k)$
, and
 $I_{sg}(k,x)$
in (25) and these objects interact with each other, making the prediction more difficult. Therefore, I will leave this matter to the later section, where I will perform a quantitative analysis.
3.8. Notes on the implications in the open economy
The model includes the foreign economy in principle, but does not specify the detailed elements of the open economy. In fact, the assumption of perfect substitutability between domestic and offshored labor in (3) effectively focuses on offshoring from the US to developing countries and largely abstracts from offshoring to the US by other countries. This is because offshoring to the US is mainly due to the high quality of US material and service inputs, which are generally not perfect substitutes for foreign inputs.
An increase in offshoring to the US by other countries is captured by an increase in US exports. In particular, US exports of services have risen sharply. However, the occupations that are hurt by service offshoring are likely to be different from the occupations that benefit from service offshoring to the US. Services dominated by high-skilled professionals account for a large share of US service exports. These include financial services, charges for the use of intellectual property, and other business services including research and development, and professional and management consulting.Footnote 24 Given that these services are not particularly female-dominated, accounting for an increase in offshoring to the US would not qualitatively change the negative impact of service offshoring on female labor.
There is also the possibility that a rise in offshoring would actually lead to a depreciation of the real exchange rate. The depreciation would allow the US to export more goods and services. However, most exports are in the form of goods and men make up a large share of the manufacturing workforce. These facts mean that the positive impact of the real depreciation on female labor would be limited, even if the trade balance is included in the model.
This section has shown that the proposed model can qualitatively explain the evolution of the gender hours ratio. The gender hours ratio has been on a continuous upward trend since the 1970s due to higher productivity growth in goods (Proposition 2). However, advances in ICT since the 1990s have reduced the cost of offshoring services, slowing the pace of the rise in the gender hours ratio (Proposition 3). The key assumptions that shape this mechanism are the high female intensity in highly offshorable occupations and the relative prevalence of material offshoring compared to service offshoring. These assumptions imply a higher female to male hours ratio in services (Proposition 1).
4. Calibration
In this section, I calibrate the parameters of the model to match the US data in 1970. This is in order to compare the model-generated gender hours ratios with actual ratios in 1990 and 2016 in the next section.
4.1. Benchmarks
Table 2 displays the benchmark data.
 $M_{m}$
and
 $M_{f}$
are the average hours worked by men and women, respectively. In the context of the model,
 $M_{m}=\int _{0}^{K_{g}}L_{mg}(k)dk+\int _{0}^{K_{s}}L_{ms}(k)dk$
and
 $M_{f}=\int _{0}^{K_{g}}L_{fg}(k)dk+\int _{0}^{K_{s}}L_{fs}(k)dk$
.
 $FM$
is the gender hours ratio, namely
 $M_{f}/M_{m}$
.
 $M_{m}$
and
 $M_{f}$
are expressed as shares of the total time endowment of each individual.Footnote
25
They are presented as averages of two years before and after each year to smooth out the potential influence of outliers.
 $x$
is the five-year average of the gender wage ratio shown in Figure 1, obtained from a regression that controls for each individual’s labor market characteristics.
Benchmark

Notes:
 $FM$
is the gender hours ratio.
 $M_{m}$
and
 $M_{f}$
are the five-year averages of hours worked by men and women.
 $x$
is the five-year average of the adjusted gender wage ratios, plotted in Figure 1.
Source: CPS March Supplement
4.2. Additional assumptions for the calibration
As in the previous section, I use Autor and Dorn’s (Reference Autor and Dorn2013) occupational classification and offshorability index. Their offshorability index is re-scaled from 0 to 1.
For the weight of women for each occupation
 $k$
in the production of domestic labor in sector
 $j$
and year
 $t$
,
 $\alpha _{j,t}(k)$
, I choose the simplest specification that satisfies an assumption of the model;
 $\alpha _{j,t}(k)=\alpha _{kj,t}k+\alpha _{cj,t}$
, where
 $\alpha _{kj,t}\gt 0$
for all
 $k$
,
 $j$
, and
 $t$
.
 $t$
refers to
 $0$
,
 $1$
, and
 $2$
for 1970, 1990, and 2016, respectively. The two sectors have a common slope but different intercepts;
 $\alpha _{k,t}=\alpha _{ks,t}=\alpha _{kg,t}$
and
 $\alpha _{cs,t}\neq \alpha _{cg,t}$
. Since
 $0\lt \alpha _{j,t}(k)\lt 1$
for all
 $k$
,
 $j$
, and
 $t$
,
 $0\lt \alpha _{cj,t}\lt 1$
and
 $0\lt \alpha _{k,t}+\alpha _{cj,t}\lt 1$
must hold for all
 $j$
and
 $t$
. It will eventually turn out that
 $\alpha _{cs,t}\gt \alpha _{cg,t}$
in the calibration, reflecting the higher female intensity in the service sector in the data.
For the functional form of
 $\tau (k)$
, the occupation-specific part of offshoring costs, I follow Grossman and Rossi-Hansberg (Reference Grossman and Rossi-Hansberg2008);
 $\tau (k)=k^{-\tau }$
, where
 $\tau \gt 0$
.Footnote 26
The actual distribution of hours worked by women in the service sector by each occupation
 $k$
in 1970,
 $L_{fs,0}(k)$
, is not a continuous function of
 $k$
, contrary to a model assumption.Footnote 27 There are 330 occupations in Autor and Dorn’s (Reference Autor and Dorn2013) classification and not every occupation employs female workers in the service sector. If the discrete distribution of
 $L_{fs,0}(k)$
is retained in the calibration, the implied distributions of
 $L_{mg,0}(k)$
,
 $L_{ms,0}(k)$
and
 $L_{fg,0}(k)$
from the model based on
 $L_{fs,0}(k)$
are unlikely to match their actual distributions in 1970. In the calibration, I make an alternative assumption that
 $L_{fs,0}(k)$
is a hypothetical, continuous probability distribution function that matches the characteristics of the actual distribution in 1970. Under this assumption,
 $L_{fs,t}(k)$
in subsequent years follow the same underlying p.d.f., only with different offshoring cutoffs and scaling factors of the distribution from
 $L_{fs,0}(k)$
. I approximate
 $L_{fs,0}(k)$
with the beta distribution because its domain is in
 $[0,1]$
.
4.3. Parameters from the firm side
This part describes the methods to obtain the parameters from the firm side, namely
 $\eta$
,
 $\varepsilon$
,
 $(\gamma _{g}-\gamma _{s})$
for 1970–1990 and 1990–2016, and
 $\{\alpha _{k,t},\alpha _{cg,t},\alpha _{cs,t}\}$
for each
 $t$
. The estimates for
 $\eta$
and
 $\varepsilon$
are imported from the existing literature, and the rest of the parameters are derived from the model and other data sources.
The value for the elasticity of substitution between occupations
 $\eta =0.854$
comes from Goos et al. (Reference Goos, Manning and Salomons2014). They build a structural model and estimate the parameter using the European data. Ritter (Reference Ritter2014) provides a lower estimate of 0.4 from the 2000–2005 BLS Occupational Employment Statistics. Both papers classify occupations into broad occupation groups, while the calibration in this paper is based on detailed occupations. Since the elasticity of substitution is likely to be higher between finer occupational classifications, I choose the higher estimate of the two.Footnote
28
The elasticity of substitution between male and female labor
 $\varepsilon =2.4$
is taken from Weinberg (Reference Weinberg2000). The values of the same parameter chosen by Acemoglu et al. (Reference Acemoglu, Autor and Lyle2004) and Ngai and Petrongolo (Reference Ngai and Petrongolo2017) are 3 and 2.27, respectively, which are not far from the pick.
The difference between the annual growth rates of
 $A_{g}$
and
 $A_{s}$
can be calculated using the BLS labor productivity data, the gender wage ratio, and the equations of the model.Footnote 29 Ngai and Petrongolo (Reference Ngai and Petrongolo2017) formulate a mechanism in which the increase in services induced by structural transformation is key to rationalizing the increase in women’s hours worked. Indeed, their mechanism can also explain a slowdown in the gender hours ratio if
 $\gamma _{g}-\gamma _{s}$
declined after 1990. The calculated estimates are
 $(\gamma _{g}-\gamma _{s})_{0,1}=1.6\mathrm{\% }$
and
 $(\gamma _{g}-\gamma _{s})_{1,2}=0.9\mathrm{\% }$
per year for 1970–1990 and 1990–2016, respectively, which is consistent with their view. These are the baseline estimates.
Instead of calibrating
 $\alpha _{k,0}$
and
 $\alpha _{cj,0}$
in 1970 and using these estimates to generate predictions for 1990 and 2016, I obtain
 $\alpha _{k,t}$
and
 $\alpha _{cj,t}$
from each year’s data. This is to allow for the possibility of increasing female demand within each sector. If I use the fixed parameter values from 1970, the model would predict a decline in the gender hours ratio as the gender wage ratio rises, as suggested by (13). Since I assume that the slope coefficient in
 $\alpha _{j,t}(k)$
is identical across sectors, I generalize (13) and use the hours worked by women and men in both sectors to obtain the common slopes. More specifically, I run simple regressions of
 $\alpha _{t}(k)$
on
 $k$
, where
 $\varphi _{t}\left(k\right)=\left(L_{f,t}\left(k\right)/L_{m,t}\left(k\right)\right)^{\frac{1}{\varepsilon }}x_{t}$
and
 $\alpha _{t}(k)=\varphi _{t}(k)/(\varphi _{t}(k)+1)$
. The resulting estimates for the common slope coefficients for each year are
 $\alpha _{k,0}=0.233$
,
 $\alpha _{k,1}=0.284$
, and
 $\alpha _{k,2}=0.239$
.Footnote 30 For the intercepts, I use the relationship between female and male hours worked (13) and match men’s total hours worked in each sector and year.Footnote
31
 $\alpha _{cj,t}$
is the value that satisfies the following condition when
 $\alpha _{k,t}$
’s and
 $x_{t}$
are given:
 \begin{equation} L_{mj,t}=\sum _{k=0}^{1}L_{mj,t}\left(k\right)=\sum _{k=0}^{1}L_{fj,t}\left(k\right)\left(\frac{\alpha _{k,t}k+\alpha _{cj,t}}{1-\alpha _{k,t}k-\alpha _{cj,t}}\right)^{-\varepsilon }x_{t}^{\varepsilon }. \end{equation}
The resulting estimates are
 $\alpha _{cg,0}=0.118$
,
 $\alpha _{cs,0}=0.221$
,
 $\alpha _{cg,1}=0.145$
,
 $\alpha _{cs,1}=0.281$
,
 $\alpha _{cg,2}=0.174$
, and
 $\alpha _{cs,2}=0.331$
.
4.4. Parameters from the household side
The elasticity of substitution between goods and services consumption
 $\rho =0.002$
is imported from the estimate of Herrendorf et al. (Reference Herrendorf, Rogerson and Valentinyi2013).
To get the rest of the parameters from the household side (
 $\{T_{m,t},T_{f,t}\}$
for each
 $t$
,
 $\varepsilon _{l}$
,
 $\alpha _{l}$
, and
 $\delta$
), we need leisure data for each year and gender. I get this data using actual hours worked for each year and gender from the CPS and total time endowment based on Valerie Ramey’s data. The time endowment is treated as the total time allocated to work and leisure, excluding home production. Since the model abstracts from home production, this adjustment is necessary to prevent women’s leisure from exceeding men’s leisure too much. Total time endowments for each gender and year are calculated by subtracting the hours for home production provided by Ramey and Francis (Reference Ramey and Francis2009) from the total time allocation of 88.5 hours per week.
As suggested by (16), the elasticity of substitution between male and female leisure
 $\varepsilon _{l}$
is the elasticity of the gender leisure ratio (
 $L_{fl}/L_{ml}$
) with respect to the gender wage ratio. A simple regression of log
 $L_{fl}/L_{ml}$
on log
 $x$
from 1970 and 2016 yields the slope coefficient
 $\varepsilon _{l}=0.210$
. Then, using the 1970 data and
 $\varepsilon _{l}$
, I obtain the value for women’s weight in the labor aggregate
 $\alpha _{l}=0.329$
from (16). Given these parameter values, the relative weight of the leisure aggregate in the utility function
 $\delta =1.404$
can be obtained from (17).
4.5. Offshoring-related parameters
Calibrating the offshoring-related parameters (
 $\tau$
, {
 $K_{g,t},K_{s,t},\theta _{g,t}\equiv \beta _{g,t}w_{t}^{\mathrm{*}},\theta _{s,t}\equiv \beta _{s,t}w_{t}^{\mathrm{*}},R_{sg,t}$
} for each
 $t$
) begins with estimating the offshoring cutoffs in each year. Previous work by Ranjan (Reference Ranjan2013) and Zhang (Reference Zhang2018) used proxies for offshoring to obtain the offshoring cutoffs. As in the model presented in Section 3, they assumed perfect substitutability between domestic and offshored labor. This implies that occupations with offshorability higher than the cutoff are filled by foreign labor and should not appear in the domestic data. In reality, however, these occupations do not disappear from the data.Footnote
32
The aggregate data used by Ranjan (Reference Ranjan2013) and Zhang (Reference Zhang2018) include these occupations, which are inconsistent with their model assumptions.
To overcome this problem, I construct hypothetical distributions of women’s hours worked in each sector and year along the offshorability of each occupation. These are constructed from the actual distributions of hours worked in the base year. The hypothetical distribution in each year and sector mimics the average female offshoring potential of the actual distribution and has the same shape as the one in the base year with a different offshoring cutoff.Footnote 33 1983 is chosen as the base year because it is the earliest year with a consistent occupational classification.Footnote 34
For the calibration, I make the simplifying assumptions that
 $K_{g,0}=K_{s,0}=1$
and
 $K_{s,1}=1$
. These imply that there was no offshoring of goods and services in 1970 and that offshoring of services began only after 1990. They reflect the fact that the burgeoning development of ICT allowed service offshoring to increase from around 1990. Then,
 $K_{g,1}$
,
 $K_{g,2}$
, and
 $K_{s,2}$
are calibrated using the hypothetical distributions of 1990 and 2016. They are jointly calibrated to match the average offshoring potential for women and the rate of estimated female employment losses in services relative to goods in each year. The targets are expressed as follows:
 \begin{equation} \overline{Off_{f,t}}=\frac{\sum _{k=0}^{K_{g,t}}kL_{fg,t}^{H}\left(k\right)+\sum _{k=0}^{K_{s,t}}kL_{fs,t}^{H}\left(k\right)}{\sum _{k=0}^{K_{g,t}}L_{fg,t}^{H}\left(k\right)+\sum _{k=0}^{K_{s,t}}L_{fs,t}^{H}\left(k\right)}, \end{equation}
 \begin{equation} \chi _{f,t}=\frac{\sum _{k=K_{s,t}}^{1}L_{fs,t}^{H}\left(k\right)}{\sum _{k=K_{g,t}}^{1}L_{fg,t}^{H}\left(k\right)}, \end{equation}
where
 $L_{fj,t}^{H}(k)$
refers to female hours worked in sector
 $j$
and occupation
 $k$
from the hypothetical distribution in each year;
 $\overline{Off_{f,t}}$
and
 $\chi _{f,t}$
represent the average offshoring potential for women and the ratio of estimated female employment losses in services to goods in each year, respectively.Footnote 35 The calibration yields
 $K_{g,1}=0.836$
,
 $K_{g,2}=0.568$
, and
 $K_{s,2}=0.836$
.
For the parameter of the offshoring cost function, I simply assign
 $\tau =1$
, but the results do not change much when other values are considered.
Given
 $K_{g,t}$
,
 $K_{s,t}$
,
 $x_{t}$
, and the other parameters, the values for
 $\theta _{g,t}$
and
 $\theta _{s,t}$
can be computed from the relationship between the hiring costs of domestic and offshored labor
 $w_{j}^{D}(K_{j})=\theta _{j}\tau (K_{j})$
. The resulting values are
 $\theta _{g,0}=1.621$
,
 $\theta _{s,0}=1.595$
,
 $\theta _{g,1}=1.437$
,
 $\theta _{s,1}=1.577$
,
 $\theta _{g,2}=0.936$
, and
 $\theta _{s,2}=1.424$
.
4.6. Distributional parameters
Finally, the two distribution parameters of
 $L_{fs,0}(k)$
and
 $R_{sg,0}$
are jointly estimated to match the 1970 data. Only the benchmark distribution of
 $L_{fs,0}(k)$
needs to be specified because
 $L_{ms,0}(k)$
,
 $L_{fg,0}(k)$
, and
 $L_{mg,0}(k)$
can be expressed in terms of
 $L_{fs,0}(k)$
and the other parameters using (13), (20), and (21).
Two parameters of the beta distribution are calibrated to match the total hours worked by women and men in 1970. In this way, these parameters would also fit the ratio of female to male hours in 1970. The values are
 $\psi =1.421$
and
 $\xi =0.952$
.Footnote 36
 $R_{sg,0}=0.259$
can be obtained by using the total hours worked by women in the goods sector in 1970 and the relationship between
 $L_{fg,0}(k)$
and
 $L_{fs,0}(k)$
in (20).
 $R_{sg,1}=0.188$
and
 $R_{sg,2}=0.150$
are determined by
 $R_{sg,0}$
,
 $\gamma _{g}-\gamma _{s}$
, and
 $\rho$
, according to the definition
 $R_{sg}(A_{g},A_{s})\equiv (\omega /(1-\omega ))^{\rho }(A_{g}/A_{s})^{\rho -1}$
.
Table 3 summarizes the calibrated parameters.
Summary of calibrated parameters
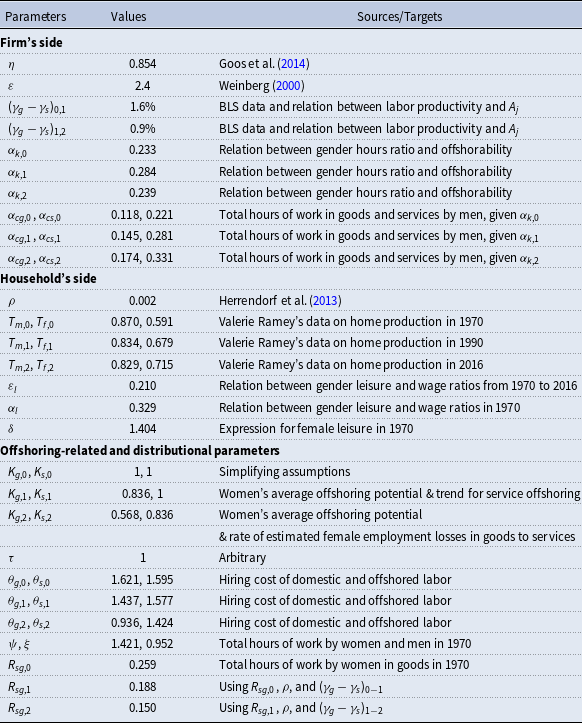
Note:
 $(\gamma _{g}-\gamma _{s})_{0,1}$
and
 $(\gamma _{g}-\gamma _{s})_{1,2}$
represent the difference in annual growth rates from 1970 to 1990 and from 1990 to 2016, respectively.
5. Quantitative analysis
Using the calibrated parameters, I first predict the gender hours ratio for 1990. I then consider three different counterfactuals along with the baseline to generate estimates for 2016. These counterfactuals reflect three forces that are potentially responsible for the slowdown in the gender hours ratio since 1990: the emergence of service offshoring, the weakening of structural transformation toward the service sector, and the slower pace of improvement in gender productivity wedge. The baseline includes all of these elements and each counterfactual represents a constraint on one of them. Using the projections of the baseline and counterfactuals in 2016, I calculate the change in the gender hours ratio from the 1990 projection. The contribution of each counterfactual is measured by how much the change in the gender hours ratio in the baseline is less than the change in each counterfactual.
The first counterfactual considers the possibility that the trend in service offshoring between 1970 and 1990 has been the same since 1990. Since I make a simplifying assumption in the calibration that there was no service offshoring in 1970 and 1990, this scenario assumes that no service offshoring occurred until 2016.
 $K_{s,1}=K_{s,2}=1$
is imposed to enforce this counterfactual, since I treat the offshoring cutoff as a proxy for the degree of offshoring. This counterfactual is designed to test Proposition 3, which states that the gender hours ratio declines as service offshoring rises due to a fall in the cost of offshoring in the service sector.
The second scenario assumes that the intensity of structural transformation into the service sector remained the same after 1990. Proposition 2 predicts that the faster productivity growth in the goods sector induces an increase in the female to male hours ratio, and it also implies that the ratio declines as the gap in productivity growth between sectors closes.Footnote 37 This counterfactual attempts to assess the contribution of this mechanism, and is realized by equating the difference in annual productivity growth between the goods and services sectors from 1990 to 2016 to the difference from 1970 to 1990. Since
 $\gamma _{g}-\gamma _{s}$
fell from 1.6% between 1970 and 1990 to 0.9% between 1990 and 2016, I postulate
 $(\gamma _{g}-\gamma _{s})_{0,1}=(\gamma _{g}-\gamma _{s})_{1,2}=1.6\mathrm{\% }$
.
The third counterfactual assumes that the pace of improvement in gender productivity wedge since 1990 has been the same as in the previous period. I focus on the weight of women in the domestic labor aggregate
 $\alpha _{j,t}(k)$
and the gender wage ratio
 $x$
to quantify the degree of gender productivity wedge as discussed in Section 3.7. To implement the counterfactual, the gender wage ratio is assumed to have evolved at the same pace since 1990, and
 $\alpha _{k,2}^{H}$
and
 $\alpha _{cj,2}^{H}$
are derived under this hypothetical gender wage ratio.Footnote 38 The estimated values are
 $\alpha _{k,2}^{H}=0.249$
,
 $\alpha _{cs,2}^{H}=0.354$
and
 $\alpha _{cg,2}^{H}=0.191$
, which are higher than the baseline parameter values of 0.239, 0.331, and 0.174. Therefore, women’s comparative advantage becomes more responsive to the offshorability of each occupation and is increased for all occupations and sectors in this counterfactual.
The parameter values for the baseline and counterfactual are presented in Table 4.
Parameter values for the baseline and counterfactuals
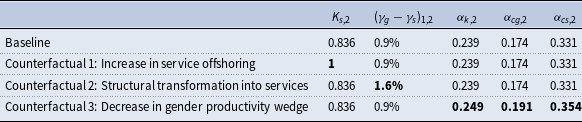
Note: The other parameters have the same values as in Table 3.
Table 5 presents the quantitative results. The baseline predicts an increase in the gender hours ratio of 76.3% from 1970 to 1990 and 17.2% from 1990 to 2016. These are close to the 68.2% and 15.5% increases in the data. The predicted increases in the gender wage ratio are 13.7% and 5.5% over the same periods. Overall, the baseline model is successful in replicating the flattening of gender hours and wage ratios since 1990.
Quantitative results
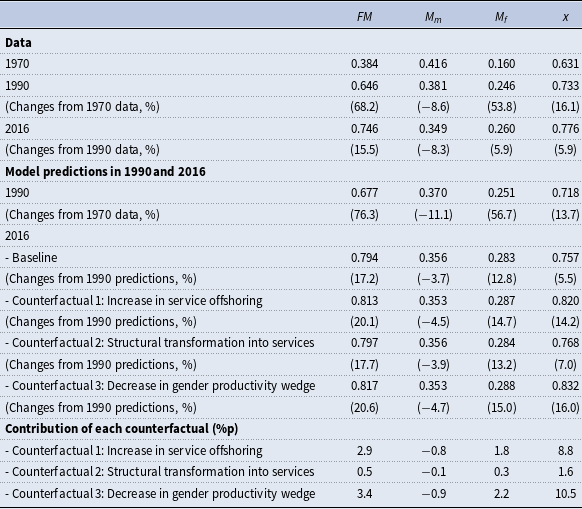
Notes: Counterfactual 1 assumes that service offshoring did not occur until 2016, that is,
 $K_{s,1}=K_{s,2}=1$
. Counterfactual 2 assumes that the difference in annual productivity growth between goods and services has been identical since 1990, that is,
 $(\gamma _{g}-\gamma _{s})_{0,1}=(\gamma _{g}-\gamma _{s})_{1,2}=1.6\mathrm{\% }$
. Counterfactual 3 assumes that the rate of decline in gender productivity wedge has been the same since 1990. This is achieved by assuming that the gender wage ratio has evolved at the same pace since 1990 and deriving
 $\alpha _{k,2}^{H}$
and
 $\alpha _{cj,2}^{H}$
under this hypothetical gender wage ratio. The contribution is calculated by subtracting the change in the baseline from the change in each counterfactual.
Assuming that service offshoring did not exist in 2016 as it did in 1990, the gender hours ratio is projected to increase by 20.1% between 1990 and 2016. Compared to the baseline, the emergence of service offshoring has reduced the increase in the gender hours ratio by 2.9 percentage points. The gender wage ratio is projected to increase by 14.2%, which is 8.8 percentage points higher than in the baseline. In this counterfactual, women work more and men work less than in the baseline, implying that the emergence of service offshoring in the baseline has indeed negatively affected women’s hours worked. The result confirms the main hypothesis that the rise of service offshoring is behind the flattening of the gender hours ratio since the 1990s.
In counterfactual 2, which assumes the same pace of structural transformation toward the service sector, the predicted increase in the gender hours ratio from 1990 to 2016 is 17.7%. This means that the slowdown in between-sector forces after 1990 is responsible for a 0.5 percentage points fall in the change in the gender hours ratio between 1990 and 2016. The gender wage ratio rises by 7.0% in this scenario, a difference of 1.6 percentage points from the baseline. This result confirms Proposition 2, although the magnitude of the contribution is modest compared to the counterfactual 1.
Comparing these two counterfactuals suggests that the service offshoring mechanism presented in this paper is quantitatively more important in explaining the flattening of the gender hours ratio. The slower pace of structural transformation toward services, which is the mechanism proposed by Ngai and Petrongolo (Reference Ngai and Petrongolo2017) and represented by counterfactual 2, played a role in the slowdown in the gender hours ratio. However, this counterfactual does not perform as well as counterfactual 1 in accounting for the slowdown in the gender hours ratio in the data.
If the trend in gender productivity wedge, as indicated by the gender wage ratio and the comparative advantage of women, had continued at the same pace after 1990, the gender hours ratio would have increased by 20.6% since 1990. This means that the plateau in the pace of decline in gender productivity wedge has contributed to a 3.4 percentage points reduction in the change in the gender hours ratio. The gender wage ratio would have increased by 16.0%, which is 10.5 percentage points higher than the baseline. The faster decline in gender productivity wedge increases the comparative advantage of female labor, raising the perceived labor productivity of women. This leads to an increase in the demand for female labor and thus an increase in the gender hours ratio and the gender wage ratio.
This result also confirms the quantitative importance of the rise of service offshoring in explaining the flattening of the gender hours ratio since 1990. The contribution of counterfactual 1 in explaining the flattening is comparable to that of counterfactual 3. Moreover, given that the change in the gender productivity wedge reflected in
 $\alpha (k)$
represents a mix of factors including gender discrimination and improvements in women’s labor market characteristics, it is highly likely that the contribution of the service offshoring channel is actually larger than that of any of the factors represented by the gender productivity wedge.
Table 5 shows that all counterfactuals have not only a higher gender hours ratio, but also a higher gender wage ratio than the baseline. This means that these forces, in addition to the gender hours ratio, contribute to the slowdown in the gender wage ratio. An explanation can be found in (13), which shows the tension between the gender hours ratio and the gender wage ratio. The slowdown in the gender wage ratio acts as a factor that increases the gender hours ratio by (13), preventing the gender hours ratio from falling further. In a sense, the slowdown in the gender wage ratio absorbs some of the flattening of the gender hours ratio.Footnote 39
It would also be interesting to compare the contribution of service and material offshoring to the evolution of the gender hours ratio. For this comparison, I consider two scenarios in which service and material offshoring remained at 1990 levels by imposing either
 $K_{s,1}=K_{s,2}=1$
or
 $K_{g,1}=K_{g,2}=0.836$
. Note that the first case corresponds to the counterfactual 1 of no service offshoring in Table 5.
The model predicts that as the cost of service offshoring declines, the gender hours ratio falls. However, the effect of a change in the cost of material offshoring on the hours ratio is theoretically unclear in the model. The results in Table 6 show that the change in the gender hours ratio from 1990 to 2016 would be 2.4 percentage points lower than the change in the baseline if material offshoring remained at its 1990 level. In this counterfactual of lower material offshoring, men’s hours are higher than in the baseline, while women’s hours are lower. This means that the increase in material offshoring, facilitated by a decline in the cost of material offshoring, had a negative effect on men’s hours while increasing women’s hours, resulting in an increase in the gender hours ratio since 1990. These results are consistent with the earlier hypothesis that an increase in material offshoring can induce a rise in the gender hours ratio.
Comparison of service and material offshoring
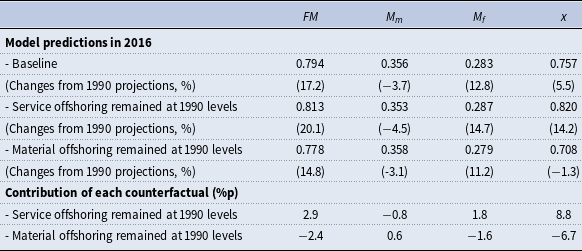
Notes: The scenario that service offshoring remained at 1990 levels assumes
 $K_{s,1}=K_{s,2}=1$
and corresponds to the counterfactual 1 (no service offshoring) in Table 5. The scenario in which material offshoring remained at 1990 levels assumes that
 $K_{g,1}=K_{g,2}=0.836$
. The changes from 1990 projections are calculated using the 1990 projections in Table 5. The contribution is calculated by subtracting the change in the baseline in Table 5 from the change in each scenario.
6. Conclusion
The main objective of this paper is to understand the plateau in the rising gender hours ratio since the 1990s. The trends in the gender hours and wage ratios imply a slower growth in the relative demand for female labor since the 1990s. I identify the ICT-driven emergence of service offshoring as the relevant demand factor. The mechanism is that the expansion of service offshoring has hit women harder than men, thereby restraining further growth in the gender hours ratio.
This paper complements the existing literature in several ways. By focusing on hours worked and the demand side, I consider both the extensive and the intensive margins of the labor market and reconcile the dynamics of both gender hours and wage ratios. In addition, my framework can endogenously generate the key proposition of a higher female to male hours ratio in the service sector, in contrast to the literature that explicitly assumes this. The paper also introduces an additional layer of the labor market effects of offshoring in terms of gender, enriching the literature that has mostly focused on aggregate effects.
I document the empirical evidence consistent with this mechanism. These include the different trajectories of sales and administrative occupations by gender, the higher female intensity of highly offshorable occupations, and the increase in service offshoring since the 1990s. The model with two sectors, two genders, and a continuum of occupations predicts an increasing gender hours ratio as labor productivity grows faster in the goods sector. As the cost of offshoring falls in the services sector, the gender hours ratio falls due to women’s comparative advantage in services in the model. Quantitatively, the increase in service offshoring plays a significant role in the flattening of the gender hours ratio since 1990, especially when compared to the slowdown in structural transformation toward the services sector.
Supplementary material
To view supplementary material for this article, please visit https://doi.org/10.1017/S1365100524000658
Acknowledgements
I would like to thank L. Rachel Ngai, Alessandra Bonfiglioli, Marc Teignier, Guy Michaels, Francesco Caselli, Wouter Den Haan, Ethan Ilzetzki, Alan Manning, Ben Moll, Steve Pischke, Shengxing Zhang, Mary Amiti, and two anonymous referees for their insightful comments. I am also grateful for the valuable comments provided by seminar participants at the BOK ERI-BOJ IMES Workshop, the Korean Economic Association Annual Meeting, the China Meeting of the Econometric Society, and Pathways to Gender Equality in Central Banks. Any remaining errors are the responsibility of the author. The views expressed in this paper are those of the author and do not necessarily reflect the views of Bank of Korea.
Competing interests
The author declares none.
Appendix: Proofs for lemmas and propositions
Lemma 1.
If
 $w_{j}^{D}(0)\lt \beta _{j}\tau (0)w^{\mathrm{*}}$
,
 $w_{j}^{D}(1)\gt \beta _{j}\tau (1)w^{\mathrm{*}}$
, and
 $\partial w_{j}^{D}(k)/\partial k\gt \partial (\beta _{j}\tau (k)w^{\mathrm{*}})/\partial k$
for all
 $k$
, then there exists a unique cutoff
 $K_{j}$
that satisfies the following conditions:
-
1.
$w_{j}^{D}(K_{j})=\beta _{j}\tau (K_{j})w^{\mathrm{*}}$
, -
2.
$L_{j}^{D}(k)\gt 0$
and
$L_{j}^{\mathrm{*}}(k)=0$
for
$0\leq k\leq K_{j}$
, -
3.
$L_{j}^{D}(k)=0$
and
$L_{j}^{\mathrm{*}}(k)\gt 0$
for
$K_{j}\lt k\leq 1$
.


Proof. Define
 $h_{j}(k)=w_{j}^{D}(k)-\beta _{j}\tau (k)w^{\mathrm{*}}$
. Then
 $h_{j}(k)$
is a continuous function of
 $k$
and
 $min(h_{j}(0),h_{j}(1))=h_{j}(0)\lt 0\lt h_{j}(1)=max(h_{j}(0),h_{j}(1))$
. By the intermediate value theorem, there exist
 $K_{j}\in [0,1]$
such that
 $h_{j}(K_{j})=0$
.
 $\partial h_{j}(k)/\partial k=\partial w_{j}^{D}(k)/\partial k-\partial (\beta _{j}\tau (k)w^{\mathrm{*}})/\partial k\gt 0$
for all
 $k$
, so
 $h_{j}(k)$
is a monotonically increasing function on [0, 1]. This guarantees the existence of a unique
 $K_{j}$
.
For
 $0\leq k\leq K_{j}$
,
 $h_{j}(k)\leq 0$
, that is,
 $w_{j}^{D}(k)\leq \beta _{j}\tau (k)w^{\mathrm{*}}$
. Therefore, firms hire only the cheaper labor input, that is, domestic labor. For
 $K_{j}\lt k\leq 1$
,
 $h_{j}(k)\gt 0$
, that is,
 $w_{j}^{D}(k)\gt \beta _{j}\tau (k)w^{\mathrm{*}}$
, implying that firms choose to employ the offshored labor in this region.
Lemma 2.
When Lemma 1 holds,
 $\frac{\partial K_{j}}{\partial \beta _{j}}\gt 0.$
Proof. Since
 \begin{equation*} \beta _{j}=\frac{w_{j}^{D}\left(K_{j}\right)}{w^{\mathrm{*}}\tau \left(K_{j}\right)}, \end{equation*}
 \begin{equation*} \frac{\partial \beta _{j}}{\partial K_{j}}=\frac{\left[\frac{\partial w_{j}^{D}\left(K_{j}\right)}{\partial K_{j}}\tau \left(K_{j}\right)-w_{j}^{D}\left(K_{j}\right)\frac{\partial \tau \left(K_{j}\right)}{\partial K_{j}}\right]}{w^{\mathrm{*}}\left[\tau \left(K_{j}\right)\right]^{2}}. \end{equation*}
Using the expression for
 $\beta _{j}$
,
 \begin{equation*} \frac{\partial \beta _{j}}{\partial K_{j}}=\frac{\tau \left(K_{j}\right)\left[\frac{\partial w_{j}^{D}\left(K_{j}\right)}{\partial K_{j}}-\beta _{j}w^{\mathrm{*}}\frac{\partial \tau \left(K_{j}\right)}{\partial K_{j}}\right]}{w^{\mathrm{*}}\left[\tau \left(K_{j}\right)\right]^{2}}. \end{equation*}
Since the numerator is positive by the assumption in Lemma 1,
 \begin{equation*} \frac{\partial \beta _{j}}{\partial K_{j}}\gt 0, \end{equation*}
which confirms
 \begin{equation*} \frac{\partial K_{j}}{\partial \beta _{j}}\gt 0. \end{equation*}
Proposition 1. If Lemma 1 holds,
 $\beta _{g}\lt \beta _{s}$
,
 $\alpha _{j}^{\mathrm{'}}(k)\gt 0$
,
 $\alpha _{s}(k)\gt \alpha _{g}(k)$
, and
 $\int _{0}^{K_{g}}\varphi _{g}(k)^{\varepsilon }L_{mg}(k)dk /\int _{0}^{K_{g}}L_{mg}(k)dk\leq \int _{0}^{K_{g}}\varphi _{s}(k)^{\varepsilon }L_{ms}(k)dk/\int _{0}^{K_{g}}L_{ms}(k)dk$
, the female to male hours ratio in the goods sector is lower than the ratio in the services sector:
 \begin{equation*} \frac{\int _{0}^{K_{g}}L_{fg}\left(k\right)dk}{\int _{0}^{K_{g}}L_{mg}\left(k\right)dk}\lt \frac{\int _{0}^{K_{s}}L_{fs}\left(k\right)dk}{\int _{0}^{K_{s}}L_{ms}\left(k\right)dk}. \end{equation*}
Proof. By Lemma 2,
 $K_{g}\lt K_{s}$
if
 $\beta _{g}\lt \beta _{s}$
. Also, by assumption,
 \begin{equation*} \frac{\int _{0}^{K_{g}}\varphi _{g}\left(k\right)^{\varepsilon }x^{-\varepsilon }L_{mg}\left(k\right)dk}{\int _{0}^{K_{g}}L_{mg}\left(k\right)dk}\leq \frac{\int _{0}^{K_{g}}\varphi _{s}\left(k\right)^{\varepsilon }x^{-\varepsilon }L_{ms}\left(k\right)dk}{\int _{0}^{K_{g}}L_{ms}\left(k\right)dk}. \end{equation*}
Using (13),
 \begin{equation*} \frac{\int _{0}^{K_{g}}L_{fg}\left(k\right)dk}{\int _{0}^{K_{g}}L_{mg}\left(k\right)dk}\leq \frac{\int _{0}^{K_{g}}L_{fs}\left(k\right)dk}{\int _{0}^{K_{g}}L_{ms}\left(k\right)dk}. \end{equation*}
Next, I will prove
 \begin{equation*} \frac{\int _{0}^{K_{g}}L_{fs}\left(k\right)dk}{\int _{0}^{K_{g}}L_{ms}\left(k\right)dk}\lt \frac{\int _{0}^{K_{s}}L_{fs}\left(k\right)dk}{\int _{0}^{K_{s}}L_{ms}\left(k\right)dk}. \end{equation*}
This is equivalent to
 \begin{equation*} \frac{\int _{0}^{K_{g}}L_{fs}\left(k\right)dk}{\int _{0}^{K_{g}}L_{ms}\left(k\right)dk}\lt \frac{\int _{K_{g}}^{K_{s}}L_{fs}\left(k\right)dk}{\int _{K_{g}}^{K_{s}}L_{ms}\left(k\right)dk}. \end{equation*}
Using (13),
 \begin{equation*} \frac{\int _{0}^{K_{g}}L_{fs}\left(k\right)dk}{\int _{0}^{K_{g}}L_{ms}\left(k\right)dk}=\int _{0}^{K_{g}}\varphi _{s}\left(k\right)^{\varepsilon }x^{-\varepsilon }\frac{L_{ms}\left(k\right)}{\int _{0}^{K_{g}}L_{ms}\left(k\right)dk}dk. \end{equation*}
This is a weighted average of
 $\varphi _{s}(k)^{\varepsilon }x^{-\varepsilon }$
and lies between the minimum and maximum of
 $\varphi _{s}(k)^{\varepsilon }x^{-\varepsilon }$
at
 $[0,K_{g}]$
. Since
 $\varphi _{s}\mathrm{'}(k)\gt 0$
,
 \begin{equation*} \varphi _{s}\left(0\right)^{\varepsilon }x^{-\varepsilon }\lt \frac{\int _{0}^{K_{g}}L_{fs}\left(k\right)dk}{\int _{0}^{K_{g}}L_{ms}\left(k\right)dk}\lt \varphi _{s}\left(K_{g}\right)^{\varepsilon }x^{-\varepsilon }. \end{equation*}
Similarly,
 \begin{equation*} \varphi _{s}\left(K_{g}\right)^{\varepsilon }x^{-\varepsilon }\lt \frac{\int _{K_{g}}^{K_{s}}L_{fs}\left(k\right)dk}{\int _{K_{g}}^{K_{s}}L_{ms}\left(k\right)dk}=\int _{K_{g}}^{K_{s}}\varphi _{s}\left(k\right)^{\varepsilon }x^{-\varepsilon }\frac{L_{ms}\left(k\right)}{\int _{K_{g}}^{K_{s}}L_{ms}\left(k\right)dk}dk\lt \varphi _{s}\left(K_{s}\right)^{\varepsilon }x^{-\varepsilon }. \end{equation*}
Therefore,
 \begin{equation*} \frac{\int _{0}^{K_{g}}L_{fs}\left(k\right)dk}{\int _{0}^{K_{g}}L_{ms}\left(k\right)dk}\lt \varphi _{s}\left(K_{g}\right)^{\varepsilon }x^{-\varepsilon }\lt \frac{\int _{K_{g}}^{K_{s}}L_{fs}\left(k\right)dk}{\int _{K_{g}}^{K_{s}}L_{ms}\left(k\right)dk}, \end{equation*}
and
 \begin{equation*} \frac{\int _{0}^{K_{g}}L_{fg}\left(k\right)dk}{\int _{0}^{K_{g}}L_{mg}\left(k\right)dk}\leq \frac{\int _{0}^{K_{g}}L_{fs}\left(k\right)dk}{\int _{0}^{K_{g}}L_{ms}\left(k\right)dk}\lt \frac{\int _{0}^{K_{s}}L_{fs}\left(k\right)dk}{\int _{0}^{K_{s}}L_{ms}\left(k\right)dk}. \end{equation*}
Proposition 2.
If Proposition 1 holds, the aggregate female to male hours ratio rises over time as
 $\gamma _{g}\gt \gamma _{s}$
.
Proof. If I differentiate
 $FM$
with respect to
 $R_{sg}$
and rearrange terms,
 \begin{equation*} \frac{\partial FM}{\partial R_{sg}}=\frac{1}{R_{sg}}\frac{\int _{0}^{K_{g}}L_{fg}\left(k\right)dk\int _{0}^{K_{s}}L_{ms}\left(k\right)dk-\int _{0}^{K_{s}}L_{fs}\left(k\right)dk\int _{0}^{K_{g}}L_{mg}\left(k\right)dk}{\left[R_{sg}H_{sg}^{\rho -\eta }\int _{0}^{K_{g}}\alpha _{sg,m}\left(k\right)I_{sg}\left(k,x\right)\varphi _{s}\left(k\right)^{-\varepsilon }L_{fs}\left(k\right)dk+\int _{0}^{K_{s}}\varphi _{s}\left(k\right)^{-\varepsilon }L_{fs}\left(k\right)dk\right]^{2}x^{2\varepsilon }}\lt 0, \end{equation*}
by Proposition 1. Since
 $R_{sg}=(A_{g}/A_{s})^{\rho -1}(\omega /(1-\omega ))^{\rho }$
decreases as
 $\gamma _{g}\gt \gamma _{s}$
,
 $FM$
increase when labor productivity growth is higher in goods.
Proposition 3.
If Proposition 1 holds and
 $\eta \gt \rho$
, the aggregate female to male hours ratio falls as
 $\beta _{s}$
goes down and
 $\beta _{g}\lt \beta _{s}$
is still satisfied after the change.
Proof.
 \begin{equation*} \frac{dFM}{d\beta _{s}}=\frac{\partial FM}{\partial \beta _{s}}+\frac{\partial FM}{\partial K_{s}}\frac{\partial K_{s}}{\partial \beta _{s}}. \end{equation*}
If I differentiate
 $FM$
with respect to
 $\beta _{s}$
and rearrange terms,
 \begin{equation*} \begin{split}&\frac{\partial FM}{\partial \beta _{s}}=\frac{\partial H_{sg}}{\partial \beta _{s}}\frac{\rho -\eta }{H_{sg}}\\&\quad \times\frac{\int _{0}^{K_{g}}L_{fg}\left(k\right)dk\int _{0}^{K_{s}}L_{ms}\left(k\right)dk-\int _{0}^{K_{s}}L_{fs}\left(k\right)dk\int _{0}^{K_{g}}L_{mg}\left(k\right)dk}{\left[R_{sg}H_{sg}^{\rho -\eta }\int _{0}^{K_{g}}\alpha _{sg,m}\left(k\right)I_{sg}\left(k,x\right)\varphi _{s}\left(k\right)^{-\varepsilon }L_{fs}\left(k\right)dk+\int _{0}^{K_{s}}\varphi _{s}\left(k\right)^{-\varepsilon }L_{fs}\left(k\right)dk\right]^{2}x^{2\varepsilon }}\gt 0, \end{split}\end{equation*}
by Proposition 1. The derivative of
 $FM$
with respect to
 $K_{s}$
can be written as
 \begin{equation*} \frac{\partial FM}{\partial K_{s}}=\frac{L_{fs}\left(K_{s}\right)\left[\int _{0}^{K_{g}}\left(\varphi _{g}\left(k\right)^{-\varepsilon }-\varphi _{s}\left(K_{s}\right)^{-\varepsilon }\right)L_{fg}\left(k\right)dk+\int _{0}^{K_{s}}\left(\varphi _{s}\left(k\right)^{-\varepsilon }-\varphi _{s}\left(K_{s}\right)^{-\varepsilon }\right)L_{fs}\left(k\right)dk\right]}{\left[R_{sg}H_{sg}^{\rho -\eta }\int _{0}^{K_{g}}\alpha _{sg,m}\left(k\right)I_{sg}\left(k,x\right)\varphi _{s}\left(k\right)^{-\varepsilon }L_{fs}\left(k\right)dk+\int _{0}^{K_{s}}\varphi _{s}\left(k\right)^{-\varepsilon }L_{fs}\left(k\right)dk\right]^{2}x^{\varepsilon }}. \end{equation*}
Since
 $\varphi _{j}\mathrm{'}(k)\gt 0$
,
 $\varphi _{s}(k)^{-\varepsilon }\gt \varphi _{s}(K_{s})^{-\varepsilon }$
for
 $0\leq k\lt K_{s}$
.
 $\varphi _{g}(k)^{-\varepsilon }\gt \varphi _{s}(K_{s})^{-\varepsilon }$
holds for
 $0\leq k\lt K_{g}$
because
 $\varphi _{g}(k)\lt \varphi _{s}(k)$
for all
 $k$
and
 $K_{g}\lt K_{s}$
. This implies that
 $\partial FM/\partial K_{s}\gt 0$
. Also, from Lemma 2,
 $\partial K_{s}/\partial \beta _{s}\gt 0$
. Therefore,
 \begin{equation*} \frac{dFM}{d\beta _{s}}\gt 0. \end{equation*}
Lemma 3.
 $H(\beta _{j},x)$
is minimized when
 $\alpha _{j}(k)=I_{j}(k,x)$
for all
 $k$
and
 $j$
.
Proof. Define
 $D_{j}\left(k,x\right)=\alpha _{j}\left(k\right)^{-\frac{\varepsilon }{\varepsilon -1}}I_{j}\left(k,x\right)^{\frac{1}{\varepsilon -1}}$
where
 $I_{j}(k,x)\equiv w_{f}L_{fj}(k)/(w_{f}L_{fj}(k)+w_{m}L_{mj}(k))=1/(1+\varphi _{j}(k)^{-\varepsilon }x^{\varepsilon -1})$
. Then
 \begin{equation*} \frac{\partial D_{j}\left(k,x\right)}{\partial \alpha _{j}\left(k\right)}=\frac{\varepsilon }{\varepsilon -1}\alpha _{j}\left(k\right)^{\frac{1-2\varepsilon }{\varepsilon -1}}I_{j}\left(k,x\right)^{\frac{1}{\varepsilon -1}}\left[-I_{j}\left(k,x\right)+\alpha _{j}\left(k\right)\right]. \end{equation*}
Since
 $\varepsilon \gt 1$
in general, this means that
 $\partial D_{j}(k,x)/\partial \alpha _{j}(k)\gt 0$
when
 $\alpha _{j}(k)\gt I_{j}(k,x)$
and
 $\partial D_{j}(k,x)/\partial \alpha _{j}(k)\leq 0$
when
 $\alpha _{j}(k)\leq I_{j}(k,x)$
. Therefore,
 $D_{j}(k,x)$
is minimized when
 $\alpha _{j}(k)=I_{j}(k,x)$
.
The right-hand side of (14) was defined as
 $H(\beta _{j},x)$
as follows:
 \begin{equation*} H\left(\beta _{j},x\right)\equiv \left[w_{f}^{1-\eta }\int _{0}^{K_{j}}\left(\underset{=D_{j}\left(k,x\right)}{\underbrace{\alpha _{j}\left(k\right)^{-\frac{\varepsilon }{\varepsilon -1}}I_{j}\left(k,x\right)^{\frac{1}{\varepsilon -1}}}}\right)^{1-\eta }dk+\left(\beta _{j}w^{\mathrm{*}}\right)^{1-\eta }\int _{K_{j}}^{1}\tau \left(k\right)^{1-\eta }dk\right]^{\frac{1}{1-\eta }}. \end{equation*}
Then
 \begin{equation*} \frac{\partial H\left(\beta _{j},x\right)}{\partial \alpha _{j}\left(k\right)}=H\left(\beta _{j},x\right)^{\eta }w_{f}^{1-\eta }\int _{0}^{K_{j}}D_{j}\left(k,x\right)^{-\eta }\frac{\partial D_{j}\left(k,x\right)}{\partial \alpha _{j}\left(k\right)}dk. \end{equation*}
Thus,
 $H(\beta _{j},x)$
is also minimized when
 $\alpha _{j}(k)=I_{j}(k,x)$
.






