INTRODUCTION
It is estimated that at the current pace of carbon dioxide (CO2) increase, even with measures to minimize CO2 emissions, the atmospheric concentration of CO2 will reach 550–700 ppm by 2050 and 650–1200 ppm by 2100 (Higgins et al. Reference Higgins, Kurbatov, Spaulding, Brook, Introne, Chimiak, Yan, Mayewski and Bender2015). Due to the increase of atmospheric greenhouse gases (GHGs) the mean global temperature is predicted to rise by 2·5 °C or more by 2050 and up to 6·4 °C by the end of this century (IPCC 2007).
Agricultural practices are changing across the globe to meet food demand, sustain soil health and for climate change mitigation. Conservation agriculture (CA) has been highlighted as a key route to Sustainable Intensification (Pretty & Bharucha Reference Pretty and Bharucha2014). Globally, CA is being practiced on about 125 million ha. The major CA-practicing countries are the USA (26·5 million ha), Brazil (25·5 million ha), Argentina (25·5 million ha), Canada (13·5 million ha) and Australia (17·0 million ha). In India, CA practices are not widely accepted, although over the past few years adoption of zero tillage and CA has expanded to cover about 1·5 million ha (Jat et al. Reference Jat, Wani and Sahrawat2012). Conservation agriculture includes minimum soil disturbance, permanent soil cover and diversified crop rotations aiming to decrease and/or revert the effects of conventional farming practices such as soil organic matter decline, soil erosion, soil physical degradation and fuel use (Thierfelder et al. Reference Thierfelder, Mwila and Rusinamhodzi2013). Currently, conservation tillage is being practiced on more than 5 million ha in the Indo-Gangetic plains of South Asia and the area under CA is expanding to a greater extent in India and other south Asian countries (Rahman Reference Rahman2003). This change in land use practices are likely to alter soil properties, for instance improving water infiltration, reducing erosion and compaction, increasing surface soil organic matter and carbon (C) content, and improving soil aggregates (Hobbs et al. Reference Hobbs, Sayre and Gupta2008).
More than 0·60 of methane (CH4) produced in the anaerobic zones of wetlands is reoxidized in the aerobic zones (rhizosphere and oxidized soil–water interface) (Le Mer & Roger Reference Le Mer and Roger2001). Soil methanotrophs consume 15–45 million t CH4/year (Dutaur & Verchot Reference Dutaur and Verchot2007). Thus, methanotrophs play a major role in removal of atmospheric CH4. Several physicochemical properties influence CH4 consumption in the soil, including soil diffusivity, water potential and levels of oxygen, ammonium, nitrate and copper (Mancinelli Reference Mancinelli1995). It is hypothesized that changes in soil properties will influence major biogeochemical processes and ecosystem services such as CH4 consumption. It is unclear how CH4 consumption is carried out in different soil aggregates. Therefore, information that links soil aggregates and CH4 consumption in response to global climate change is essential.
Identification of the active sites of CH4 consumption in different soil compartments is important for designing soil management strategies to regulate global climate change. Soil consists of small aggregates varying in size, known as microaggregates and macroaggregates. Macroaggregates (>0·25 mm diameter) form around plant roots, fungal hyphae and coarse organic fragments. Macroaggregates are less structurally stable than microaggregates (<0·25 mm diameter), which result from clay and silt particles binding to extracellular polysaccharides of microbial origin (Al-Kaisi et al. Reference Al-Kaisi, Douelle and Kwaw-Mensah2014). Water, minerals and gases circulate through macroaggregates through soil pores (Katuwal et al. Reference Katuwal, Arthur, Tuller, Moldrup and de Jonge2015). Soil aggregates also vary with microbial loads. Information about the distribution and magnitude of microbial activity within soil aggregates could lead to the identification of hotspots of greenhouse gas production and consumption in agricultural fields. The current research aims to unravel the detailed mechanistic process of atmospheric CH4 consumption under future climate conditions and to explore two key points: (1) define the small-scale heterogeneity of CH4 consumption; (2) determine the impact of climate drivers (CO2 and temperature) on CH4 consumption in the different soil aggregates.
MATERIALS AND METHODS
Study site
Soil samples were collected from the agricultural field of the national network project on organic farming initiated in 2004 (Mohanty et al. Reference Mohanty, Kollah, Chaudhary, Singh and Singh2015) at the Indian Institute of Soil Science, Bhopal, Madhya Pradesh, India (23°18′N/77°24′E, 485 m a.s.l.). Fields were planted continuously with soybean (Glycine max L.) and wheat (Triticum aestivum L.) during the summer and winter seasons, respectively. Wheat variety HI 8498 and soybean variety JS 335 were grown at a spacing of 22·5 × 5 and 45 × 5 cm2, with seeding rates of 100 and 80 kg/ha, respectively. A composite soil sample representing a no inputs control soybean field and collected during the vegetative growth phase (45 days after sowing) was used for this experiment. The location has a humid sub-tropical climate, with a hot summer and a humid monsoon season. It experiences south-western monsoon rains between July and September. Mean annual temperature is about 25 °C, with the maximum temperature reaching nearly 45 °C during mid-summer (May–June) and the minimum of about 5 °C in January. The average precipitation is 1200 mm and humidity is 65%.
Soil physicochemical properties
The soil is a heavy clayey vertisol (typic Haplustert) (Pal et al. Reference Pal, Bhattacharyya, Chandran, Ray, Satyavathi, Durge, Raja and Maurya2009) and the experimental site was characterized with 5·7 g/kg organic carbon (OC), 225 mg/kg available nitrogen (N), 2·6 mg/kg available phosphorus (P) and 230 mg/kg available potassium (K). The electrical conductivity was 0·43 dS/m and the pH 7·5 (1:2·5 of soil and water in w:v). The mean weight diameter of soil aggregates was 0·53 mm, and total, micro- and macro-porosity values were 51·7, 32·1 and 19·6%, respectively. The water holding capacity, bulk density and saturated hydraulic conductivity of the soil were 62% (w/w), 1·45 mg/m3 and 7·3 × 10−6 m/s, respectively. The textural composition of soil was: sand 15·2%, silt 30·3% and clay 54·5%.
Soil sampling, aggregate separation and characterization
The top 10 cm of bulk soil was sampled from agricultural plots using soil corers (inner diameter: 5 cm). After collection, soils were brought to the laboratory for further processing. Moisture holding capacity (MHC) was analysed gravimetrically and found to be in the range of 50–60%. Freshly collected soil samples were passed through a series of sieves to collect different soil aggregate sizes (Sainju Reference Sainju2006). Soil samples were passed through stainless steel sieves of 2, 1 and 0·25 mm mesh size by shaking carefully to minimize aggregate disintegration. The different size fractions of soil aggregates were collected and used in the experiment. The fractions passing through the 2 mm sieve and collected on the 1 mm sieve were designated as macroaggregates (1–2 mm), similarly other fractions were designated as mesoaggregates (0·25–1 mm) and microaggregates (<0·25 mm). Total OC and available N of the soil aggregates were analysed following standard wet chemical methods as described in (Allen Reference Allen1989).
Experimental setup and soil incubations
The experiment used a factorial design to determine the impact of climate drivers on CH4 consumption in different aggregates. Three factors were: (1) aggregate size, (2) CO2 concentration (ambient or 400, 800 and 1200 ppm or μm/m) and (3) temperature (25, 35 and 45 °C). Each factorial combination (three aggregate sizes × three CO2 mixing ratios × three temperatures) was replicated three times, for a total of 81 experimental units. Briefly, 10-g portions of soil aggregates were placed in 130-ml pre-sterilized serum vials and mixed with sterile distilled water to maintain 60% MHC. Vials were incubated at three different temperatures of 25, 35 and 45 °C in separate biological oxygen demand incubators (Metrex scientific instruments Pvt Ltd, New Delhi, India). Carbon dioxide evolution was monitored by a gas chromatograph for 3–4 days until CO2 evolution stabilized. Headspace of the vials was maintained with CO2 concentration of ambient, 400 ± 10, 800 ± 20 and 1200 ± 20 µm/m (ppm) by replacing the appropriate amount of air in the headspace with an equivalent quantity of 0·2% CO2 in air. Headspace CO2 concentration was monitored every alternate day and maintained at the specified concentration for a period of 1 month.
Methane consumption rate estimation
In upland soil ecosystems, CH4 concentration in different soil compartments may vary from 1000 to 20000 ppm (Metz et al. Reference Metz, Davidson, Bosch, Dave and Meyer2007). High CH4 concentration has been observed in soil and sediments in flooded soils of agricultural fields and other natural ecosystems (Bharati et al. Reference Bharati, Mohanty, Singh, Rao and Adhya2000; Mohanty et al. Reference Mohanty, Bharati, Deepa, Rao and Adhya2000). Hence, a 1000 ppm headspace CH4 concentration was used in the present study by injecting the headspace of the vials with 1 ml of pure CH4. Methane consumption under such CH4 concentration has been studied previously (Mohanty et al. Reference Mohanty, Kollah, Sharma, Singh, Singh and Rao2014). At regular intervals (~1 day), 0·1 ml of headspace gas was analysed for CH4. After each sampling, the headspace was replaced with an equivalent amount of high purity helium (He) to maintain atmospheric pressure; He was used because of its inert chemical nature. The rate constant of CH4 consumption (k) was determined from the slope of log-transformed values of CH4 v. time during the rapid decline phase (Mohanty et al. Reference Mohanty, Bodelier and Conrad2007).
Methane and carbon dioxide measurement
The CH4 or CO2 mixing ratios in the headspaces of serum bottles were analysed using a gas chromatograph (GC; Chromatography and Instruments Company, Vadodara, India) equipped with a flame ionization detector and a Porapak Q column (2-m length, diameter 3·175 mm, 80/100 mesh, stainless steel column). The injector, column and detector were maintained at 120, 60 and 300 °C, respectively. Carbon dioxide was measured after conversion to CH4 via a methanizer at 330 °C. Under these conditions, the retention time of CH4 was 1·3 min and CO2 was 2·5 min. The GC was calibrated before and after each set of measurements using different mixtures of CH4 in N2 (Sigma Gases, New Delhi, India) and/or CO2 in N2 (Inox Air, Bhopal, India) as primary standards (CH4/CO2 100 ppm).
Microbiological analyses
Microbial population was enumerated after 10 days of incubation. Population of culturable aerobic heterotrophic bacteria, CH4 oxidizers and ammonia oxidizers were estimated by enrichment methods using synthetic media. The population of culturable aerobic bacteria in the soil samples was estimated by the standard dilution plate technique using tryptone yeast extract medium (Rand et al. Reference Rand, Greenberg and Taras1976) and expressed as colony-forming units (CFU)/g dry soil. Methane oxidizers were enumerated using basal salt medium (Graham et al. Reference Graham, Korich, LeBlanc, Sinclair and Arnold1992). This cultivation technique detects methanotrophs having soluble methane monooxygenase (smoA) and also strains having both smoA and particulate CH4 monooxygenase (Mohanty et al. Reference Mohanty, Kollah, Chaudhary, Singh and Singh2015). Triplicate plates for each dilution were incubated in vacuum desiccators under an atmosphere of 1% (v/v) CH4 in air, at 32 ± 2 °C. The headspace atmosphere was replenished with CH4 on every fourth day for 30 day. The colonies that developed a coloured complex in presence of naphthalene and O-dianisidine (tetrazotized) were assumed to be CH4 oxidizers. Ammonia-oxidizing bacteria were enumerated by the most probable number (MPN) method (Verhagen & Laanbroek Reference Verhagen and Laanbroek1991). Sub-samples of 0·1 ml broth were withdrawn from MPN tubes after the end of the incubation period. Ammonia consumption was confirmed by measurement of nitrate and nitrite concentrations by the addition of diphenylamine reagent (0·2 g in 100 ml of concentrated sulphuric acid). Abundance of nitrifiers was calculated with reference to MPN tables (Rowe et al. Reference Rowe, Todd and Waide1977).
Statistical analyses
Data obtained are presented as arithmetic mean of three replicated observations. Tukeys honestly significant difference (HSD) test was performed to define the significant difference among treatments. Analysis of variance (ANOVA) was performed to determine the effect of elevated CO2 (eCo2), temperature and soil aggregates on the rate of CH4 consumption and microbial population changes. Principal component analysis (PCA) is presented as a two-dimensional scree plot and ordination biplot. The scree plot ranks the components based on the rate of change in the magnitude of the eigenvalues, while the biplot exhibits relative significance of the vectors (factors) and variables. Principal component analysis was computed using the prin.comp command of the attached ANOVA data. Pearson correlation coefficients were estimated to define significant correlations among variables using the cor.test (x,y) command. All analyses were performed using agricolae and vegan package of R statistical software (R version 2.15.1).
RESULTS
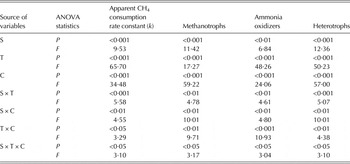
Climate factors (eCO2, temperature) and the size of soil aggregates influenced the CH4 consumption rate constant (k) and microbial abundance (Table 1). Elevated CO2 and temperature exerted significant effect on k and culturable microbial abundance (P < 0·001). Soil aggregate size and temperature (S × T) exhibited the highest effect on k (P < 0·05) and lowest on the culturable aerobic heterotrophic bacteria (P < 0·05). Soil aggregate size and CO2 (S × C) significantly influenced k (P < 0·05). Similarly, temperature and CO2 (T × C) influenced k (P = 0·073). Climatic factors and soil aggregates (T × C × S) influenced k (P = 0·074).
Analysis of variance (ANOVA) of the factors and variables to determine interaction effects of carbon dioxide (CO2) concentration, temperature, soil aggregate size on apparent methane (CH4) consumption rate k, culturable methanotrophs, ammonia oxidizers and total aerobic heterotrophs in soil

S, soil aggregates; C, CO2 concentration; T, temperature.
Gross methane consumption
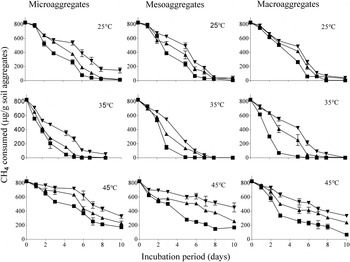
The temporal scale of CH4 consumption varied among soil aggregates under ambient and altered climatic conditions. Methane consumption was completed within 10 days under ambient conditions. However, both eCO2 and temperature inhibited CH4 consumption, irrespective of aggregate size. Microaggregates had slower CH4 consumption than other aggregates. Time-scale plots of microaggregates showed an initial lag phase followed by log phase of CH4 consumption (Fig. 1). Contrastingly, mesoaggregates had faster CH4 consumption than other aggregates. Elevated CO2 and temperature inhibited CH4 consumption and resulted in residual headspace CH4. Temporal CH4 consumption in macroaggregates was within the values of microaggregates and mesoaggregates.
Effect of eCO2 and temperature on CH4 consumption in microaggregates (<0·25 mm), mesoaggregates (0·25–1·0 mm) and macroaggregates (1–2 mm) of a vertisol. Soil aggregates were incubated under different CO2 concentration of 400 µm/m or ppm (square), 800 µm/m or ppm (triangle) and 1200 µm/m or ppm (inverse triangle) and temperature (25, 35 and 45 °C). Headspace CH4 concentration is estimated over an incubation period of 10 days. Values are average of three replicate observations with error bars as standard deviations.

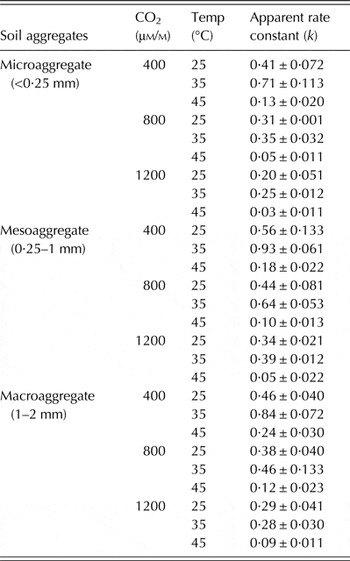
Consumption of CH4 was estimated as apparent rate constant k (μg CH4 consumed/g soil/day) and varied across the soil aggregates (Table 2). Microaggregates exhibited a lower CH4 consumption rate constant than macroaggregates, while CH4 consumption rate constant was high in the mesoaggregate fractions irrespective of treatment. Both mesoaggregates and macroaggregates were sensitive to eCO2 and temperature (45 °C and 1200 µm/m). However, mesoaggregates were more affected by climate factors than macroaggregates. The climate factor temperature influenced k. Impact of temperature on CH4 consumption followed the trend 35 °C < 25 °C < 45 °C. Like other factors, eCO2 also affected k. A rise in CO2 to 800 ppm inhibited k by 21–44% over ambient CO2. A further rise of CO2 to 1200 ppm inhibited k by 66%.
Effect of elevated carbon dioxide (CO2) and temperature on methane (CH4) consumption rate k (/g soil/day) in different soil aggregate size fractions of a vertisol
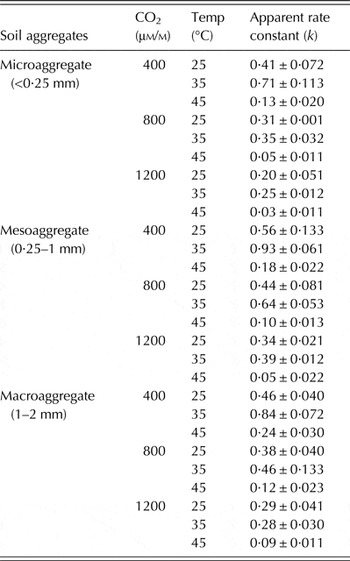
Values are average ± standard deviations of three replicate observations.
P < 0·05, d.f. error = 54, s.e.d. 0·014.
Impact of global drivers on soil microbial enumeration
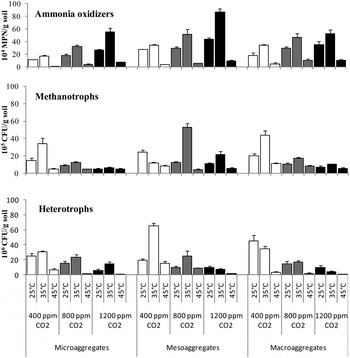
The effect of climatic factors and soil aggregate size on culturable bacteria was evaluated by ANOVA (Table 1). Soil aggregate size (S), temperature (T), or CO2 (C) significantly influenced the culturable microorganisms (P < 0·01). Interaction among the factors (S × T, S × C, T × C and S × T × C) also significantly (P < 0·05) influenced culturable microorganisms. Mesoaggregates had higher culturable microorganisms than other aggregates (Fig. 2). Elevated CO2 reduced culturable methanotrophs but stimulated ammonia oxidizers. Like methanotrophs, aerobic heterotrophs were inhibited by eCO2. Abundance of methanotrophs, ammonia oxidizers and heterotrophs were highest at 35 °C and lowest at 45 °C.
Influence of eCO2 and temperature on the abundance of total culturable aerobic heterophic bacteria, methane oxidizing bacteria and ammonia oxidizing bacteria in different soil aggregates of a vertisol. Soil aggregates were incubated under different CO2 concentration of 400 µm/m (ppm), 800 µm/m (ppm) and 1200 µm/m (ppm) and temperature (25, 35 and 45 °C). Values are average of three replicate observations with error bars as standard deviations.

Organic carbon and nitrogen in soil aggregates
Organic C content in macroaggregates, mesoaggregates and microaggregates was 6·2, 5·7 and 4·0 g/kg soil, respectively. Similarly, the available N in macroaggregates, mesoaggregates and microaggregates fractions was 288·50, 250·88 and 225·20 mg/kg soil, respectively.
Correlation and principal component analysis interpretation
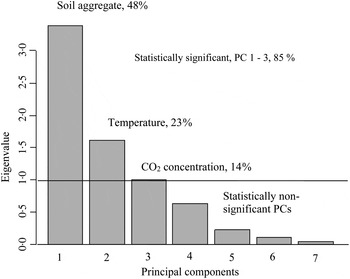
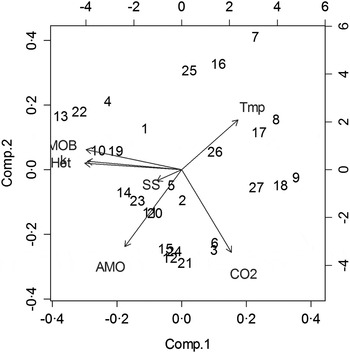
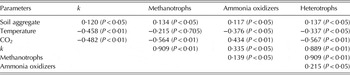
Pearson correlation analysis examined relationships among the different variables and parameters (Table 3). The culturable ammonia oxidizers correlated positively with CO2 (P < 0·001, α = 0·01). Aggregate size correlated positively with k, while temperature and CO2 correlated negatively (α = 0·05–0·01) with k. Principal component analysis revealed that there were significant associations among the variables. Based on the eigenvalues scree plot of PCA, factors were ranked from the levelling-off point(s) (Cattell Reference Cattell1966). The most important principal component was the soil aggregate size, accounting for approximately 48% of total variance. The 2nd and 3rd components were temperature and CO2 accounting for approximately 23 and 14% of the variance, respectively (Fig. 3). Other components contributed non-significantly with a total of about 15% variance. The ordination biplot (Fig. 4) categorized the soil aggregate size as the most important regulating factor for CH4 consumption. Methane consumption and abundance of culturable methanotrophs, ammonia oxidizers and heterotrophs were influenced by the factors in the order: aggregate size > temperature > CO2. The vector of temperature and CO2 was placed opposite k and microbial abundance. This suggested a negative impact of climate factors on CH4 consumption and soil microorganisms. Vectors of k, ammonia oxidizers, heterotrophs and methanotrophs were placed close together. This relation suggested that CH4 consumption was mediated by these three microbial groups.
A scree plot showing the relative eigenvalues and variation (%) for the principle components (PC) generated for the measured variables. The figure demonstrates the higher contributions of the first two factors to variability in the observations. PC1, PC2 and PC3 were statistically significant and attributed 85% variation. Component 1: soil aggregates, PC2: temperature, PC3: CO2 concentration, PC4: apparent CH4 consumption rate k, PC5: methanotrophs, PC6: ammonia oxidizers and PC7: heterotrophs.

Ordination biplot of principal component analysis (PCA) with components 1 and 2. Vectors of variables (lines) and factors were climate drivers, soil aggregates and CH4 consumption parameters. Principal components (PC) 1 represent 3·727 eigenvalue (48% variation) and PC2 represent 1·609 eigenvalue (23%). The factors were SS, Soil aggregates; Tmp, Temperature; CO2, concentration of CO2. The variables were k, CH4 consumption rate constant; MOB, Abundance of culturable methanotrophs; Het, Abundance of culturable heterotrophs; AMO, Abundance of culturable ammonia oxidizers. In PCA, arrows with narrow angles are strongly correlated, arrows that are perpendicular show no correlation and arrows in opposite directions indicate negative correlation. Numbers within the plot represent different treatments. For example, 1: microaggregate-400 µm/m (ppm) CO2–25 °C; 2: microaggregate-400 µm/m (ppm) CO2–35 °C and likewise 27: macroaggregates-1200 µm/m (ppm) CO2–45 °C (see Table 2).

Pearson's product–moment correlation among variables and parameters with alternative hypothesis of true correlation is not equal to 0

k, Apparent rate constant of CH4 oxidation; – represents –ve correlation and none for +ve correlation.
DISCUSSION
The current experiment evaluated the influence of climate factors (eCO2 and temperature) and size of soil aggregates on the CH4 consumption in a tropical vertisol. Based on size, soil aggregates are referred to as microaggregates, mesoaggregates and macroaggregates, although many researchers designate mesoaggregates as macroaggregates. Methane consumption rate constant varied with soil aggregate size: macroaggregates had higher CH4 consumption than microaggregates. Generally, macroaggregates are composed of microaggregates, minerals and particulate organic matter (Fernández-Ugalde et al. Reference Fernández-Ugalde, Virto, Barré, Apesteguía, Enrique, Imaz and Bescansa2014). These microaggregates account for 0·30–0·50 of the total weight of the macroaggregates (Six et al. Reference Six, Elliott and Paustian2000). The relative weight of microaggregates within the macroaggregates increases with aggregate size. The C content of microaggregates is greater than the inter-space C content of macroaggregates (Bimüller et al. Reference Bimüller, Kreyling, Kölbl, von Lützow and Kögel-Knabner2016). Thus, macroaggregates have more internal space for gaseous exchange and nutrient retention than microaggregates. Probably, these features of macroaggregates favoured CH4 consumption more than the microaggregates.
The climate factors affected CH4 consumption potential of all soil aggregates, but the impact was greatest in mesoaggregates. The impact of climate factors on CH4 consumption was evaluated by ANOVA, which suggests that soil aggregate size caused higher variations in CH4 consumption than the climate factors. Methane consumption rate constant was in the order mesoaggregates > macroaggregates > microaggregates. To understand this complex relation, it was essential to know how the soil aggregates varied in chemical and biological composition. Organic C in mesoaggregates and macroaggregates were 6·2, and 5·7 g/kg respectively, while the microaggregates had only 4·0 g OC/kg. Similarly, available N was higher in macroaggregates (250–288 mg/g soil) than microaggregates (225 mg/g soil). Previous studies also indicate higher particulate C, N and microbial biomass in macroaggregates than microaggregates (Plaza-Bonilla et al. Reference Plaza-Bonilla, Cantero-Martínez, Bareche, Arrúe and Álvaro-Fuentes2014). The microbial groups involved in C and N cycling and other nutrient cycles are much more abundant in macroaggregates than microaggregates (Schmidt & Waldron Reference Schmidt, Waldron, Hamilton, Doll and Robertson2015).
Methane consumption correlated significantly with the number of culturable methanotrophs and ammonia oxidizers (P < 0·001). Methane consumption was consistent with the assumption of progressive growth of CH4-consuming bacteria: a larger population resulting in faster CH4 consumption. Interestingly, CH4 consumption correlated positively and significantly with heterotrophs. These two microbial groups probably co-exist in the aggregates and are inter-dependent. Methanotrophs form a methane-driven food web on which heterotrophic microorganisms can feed. An abundance of heterotrophs stimulates the methanotrophic population (Ho et al. Reference Ho, De Roy, Thas, De Neve, Hoefman, Vandamme, Heylen and Boon2014), because heterotrophs provide metabolites essential for the methanotrophs such as cobalamin (Stock et al. Reference Stock, Hoefman, Kerckhof, Boon, De Vos, De Baets, Heylen and Waegeman2013). Cobalamin enhances biosynthesis of methane monooxygenase (sMMO) in methanotrophs (Bowman & Sayler Reference Bowman and Sayler1994). Likewise, methanotrophs provide C sources to heterotrophs through exudation. For example, in Alaskan arctic lakes, consumption of 0·025 mm CH4/g sediment incorporated approximately 15·8–32·8% of the CH4-derived C into soil microorganisms. This CH4-derived C was equated to up to 5·7% of total primary production estimates for Alaskan arctic lakes (He et al. Reference He, Wooller, Pohlman, Tiedje and Leigh2015).
Methane consumption in aggregates is also regulated by other quantifiable parameters such as total pore space and ratio of micro-pores to macro-pores (Del Grosso et al. Reference Del Grosso, Ojima, Parton, Mosier, Peterson and Schimel2002). Macro-pores within the macroaggregates allow rapid transport of air, making soil more aerobic and stimulating aerobic CH4-oxidizing bacteria. In contrast, microaggregates have lower microbial populations. This is probably due to: (1) recalcitrant organic compounds and (2) biotic exclusion (Campo et al. Reference Campo, Nierop, Cammeraat, Andreu and Rubio2011). Recalcitrant organic compounds are comprised of covalently bonded humic polymers. These organic compounds are stabilized chemically through associations with silt and clay (Alvarino et al. Reference Alvarino, Komesli, Suarez, Lema and Omil2016). Thus, recalcitrant OCs sequestered within the microaggregates are protected from microbial use, limiting microbial activity (Yang et al. Reference Yang, Wullschleger, Liang, Graham and Gu2016). Biotic exclusion is a mechanism by which organic matter is preserved in soils. This results from the architectural packing system emerging during microaggregate formation (Mueller et al. Reference Mueller, Hobbie, Chorover, Reich, Eisenhauer, Castellano, Chadwick, Dobies, Hale, Jagodziński, Kałucka, Kieliszewska-Rokicka, Modrzyński, Rożen, Skorupski, Sobczyk, Stasińska, Trocha, Weiner, Wierzbicka and Oleksyn2015). This encloses, or encapsulates, colloid-sized particles of organic matter with minerals, creating pores that are filled with organic matter. The minerals serve as a physical barrier, protecting organic matter from degradation in pores too small to permit access to the organic matter by microbes, enzymes or oxidants (Schmidt et al. Reference Schmidt, Torn, Abiven, Dittmar, Guggenberger, Janssens, Kleber, Kögel-Knabner, Lehmann, Manning, Nannipieri, Rasse, Weiner and Trumbore2011).
The effect of temperature on CH4 consumption was not unimodal; instead the rate was optimal at the intermediate temperature tested (35 °C). Methane consumption has previously been found to be optimal at 25–35 °C in many ecosystems such as neutral landfill cover soil (Boeckx & Van Cleemput Reference Boeckx and Van Cleemput1996), peat samples (Dunfield et al. Reference Dunfield, Knowles, Dumont and Moore1993) and arctic Alaskan lakes (Lofton et al. Reference Lofton, Whalen and Hershey2014). In temperate forest and rice field soils, maximum CH4 consumption was observed at 25–35 °C, but no activity was seen at >40 °C (Mohanty et al. Reference Mohanty, Bodelier and Conrad2007), which suggests that 35 °C was the optimum temperature for CH4 consumption in a vertisol. Thus, climate warming is expected to stimulate methanotrophic activity in vertisol until the atmospheric temperature is near 35 °C. Temperature caused higher variation to CH4 consumption than CO2. However, the effect of temperature on CH4 consumption was affected by a rise in CO2 concentration. It is likely that eCO2 impacts methanotroph abundance negatively.
Elevated CO2 inhibited CH4 consumption in all soil aggregate size fractions. Similar results have been found in a forest soil (Guan et al. Reference Guan, Zhang, Shi, Li, Han and Xu2012). Methane-consuming microbes are obligate aerobes and high CO2 inhibits CH4 consumption (Aronson et al. Reference Aronson, Allison and Helliker2013). Elevated CO2 can reduce mineral N availability through increased microbial N uptake and through effects on microbial N transformation rates (Billings et al. Reference Billings, Schaeffer and Evans2003). Nitrogen limitation probably inhibited methanotrophic activity under eCO2. Elevated CO2 also stimulates autotrophs, which produce larger amounts of organic compounds that enter the soil (Rogers et al. Reference Rogers, Runion and Krupa1994). These compounds could fuel methanogenesis through higher substrate availability and lower redox potential caused by higher respiration rates. Some of these organic compounds also inhibit methanotrophs directly: inhibitory effects have been demonstrated for ethylene (Jäckel et al. Reference Jäckel, Schnell and Conrad2004), some organic acids (Wieczorek et al. Reference Wieczorek, Drake and Kolb2011) and terpenes (Amaral et al. Reference Amaral, Ekins, Richards and Knowles1998). Low CH4 consumption has been observed under eCO2 from plots of Lolium perenne maintained under high N input. Elevated CO2 (600 ppm) decreased k by fourfold compared to a control plot (Ineson et al. Reference Ineson, Coward and Hartwig1998). In the Giessen free-air CO2 enrichment (GiFACE) experiment, 5 years of CO2 enrichment led to decreased CH4 consumption rates in a meadow soil. Real-time PCR and fluorescent in situ hybridization analysis revealed that abundance of methanotrophic bacteria decreased significantly under eCO2 (Kolb et al. Reference Kolb, Carbrera, Kammann, Kämpfer, Conrad and Jäckel2005a , Reference Kolb, Knief, Dunfield and Conrad b ). Similarly, in a multi-factorial combination experiment (ambient and elevated levels of precipitation, temperature, CO2 and N deposition), reduced CH4 consumption was observed due to eCO2 in the Jasper Ridge Global Change Experiment (JRGCE) located in central California (Blankinship et al. Reference Blankinship, Brown, Dijkstra and Hungate2010).
Elevated CO2 inhibited culturable aerobic heterotrophs and CH4 oxidizers, and stimulated culturable ammonia oxidizers. Abundance of ammonia-oxidizing bacteria was estimated because CH4 oxidizers and many ammonia oxidizers have a number of common characteristics for CH4 consumption (Horz et al. Reference Horz, Yimga and Liesack2001; Mohanty et al. Reference Mohanty, Kollah, Sharma, Singh, Singh and Rao2014). These two groups also interact and limit methanotrophy in some ecological circumstances (Daebeler et al. Reference Daebeler, Bodelier, Yan, Hefting, Jia and Laanbroek2014). The key enzymes, CH4 monooxygenase in methanotrophs and ammonia monooxygenase in ammonia oxidizers, are evolutionarily linked (Holmes et al. Reference Holmes, Costello, Lidstrom and Murrell1995). Therefore, some ammonia-oxidizing bacteria oxidize CH4, and some CH4 oxidizers also oxidize ammonium (NH4 +) (Conrad Reference Conrad2007). Temperature inhibited ammonia oxidizers, while eCO2 stimulated ammonia oxidizers, because ammonia oxidizers are autotrophs and they utilize CO2 as a C source. In the present study, abundance of various microbial groups was estimated by culture-dependent method. Although changes in culturable microbial populations contributed significantly towards an explanation of the variation in CH4 consumption in different soil aggregates in relation to microbial abundance, the results should be treated with caution because <0·01 of the total microorganisms are culturable in some ecosystems. Hence, culture-based enrichment techniques may not capture the real diversity of the target populations (Amann et al. Reference Amann, Ludwig and Schleifer1994). However, the observations made using culturable techniques in the present study are in accordance with those made through molecular-based techniques in previous studies (Kolb et al. Reference Kolb, Carbrera, Kammann, Kämpfer, Conrad and Jäckel2005a , Reference Kolb, Knief, Dunfield and Conrad b ). Further research on microbial abundance targeting species-specific genes may provide better information to link microbial population dynamics and CH4 consumption in soil aggregates under future climate changes.
CONCLUSION
Much uncertainty lies in understanding the complex interactive effects of multiple simultaneous global environmental changes on soil-mediated greenhouse gas cycling processes. This information is a prerequisite to predicting fluxes of GHGs in soils in projected future climates. The current experiment was conducted to examine the effect of eCO2 and temperature on methanotrophic activity in different soil aggregate size fractions of a tropical clayey vertisol. For better prediction of climate change, studies also should be carried out with elevated CH4. Results highlighted that macroaggregates (0·25–1 mm) were the most active sites for CH4 consumption while microaggregates were the least. Elevated CO2 and temperature inhibited CH4 consumption in different soil aggregate size classes by decreasing microbial abundance. It was concluded that in future, if the atmospheric concentration of CO2 and temperature increases as predicted by the Intergovernmental Panel on Climate Change (IPCC), CH4 consumption will be affected significantly in the tropical vertisol. However, in situ experiments are warranted to better understand the complex interaction of climate drivers on CH4 consumption in different soil aggregate fractions.
The authors acknowledge Indian Institute of Soil Science (IISS), Bhopal for financial support to conduct the experiment. The authors also declare no conflict of interest of any type.