


The emerging high-entropy alloys (HEAs) have received increasing attention in recent years. Unlike the traditional alloys, which are typically based on one or two principal elements, HEAs contain multiple elements at equal or near-equal molar ratios.[Reference Zhang, Zuo, Tang, Gao, Dahmen, Liaw and Lu1–Reference Guo, Dmowski, Noh, Rack, Liaw and Egami8] The unusual composition can lead to the formation of an extensive solid solution in a face-centered-cubic (FCC) or a body-centered-cubic (BCC) structure as the only or matrix phase and accordingly unique properties.[Reference Dubois9, Reference Saito, Furuta, Hwang, Kuramoto, Nishino, Suzuki, Chen, Yamada, Ito, Seno, Nonaka, Ikehata, Nagasako, Iwamoto, Ikuhara and Sakuma10] For example, Senkov et al.[Reference Senkov, Wilks, Scott and Miracle11] found that the heat-softening resistance of the VNbMoTaW HEA with a BCC structure can remain significant up to 1500 K, whereas for Inconel 718, a superalloy, it starts to diminish at about 873 K and plummets with further heating. Kuznetsov et al.[Reference Kuznetsov, Shaysultanov, Stepanov, Salishchev and Senkov12] reported that the AlCoCrFeNiCu HEA after forging showed a tensile elongation as high as 864% at 1273 K. Chuang et al.[Reference Chuang, Tsai, Wang, Lin and Yeh13] demonstrated that the wear resistance of Co1.5CrFeNi1.5Ti and Al0.2Co1.5CrFeNi1.5Ti HEAs (in molar fraction) is at least twice that of commercial wear-resistant steels with similar hardness. The enhancement is believed to stem from the HEAs' excellent anti-oxidation ability and resistance to thermal softening. Zhang et al.[Reference Zhang, Zuo, Cheng and Liaw14] reported HEAs with high saturation magnetization, electrical resistivity, and malleability. Hemphill et al.[Reference Hemphill, Yuan, Wang, Yeh, Tsai, Chuang and Liaw15] found great fatigue resistance of HEAs. The fatigue-endurance limit can compare favorably with conventional materials, such as steels, and nickel, aluminum, titanium alloys, and advanced bulk metallic glasses (BMGs). These interesting properties of HEAs set them apart from conventional alloys, unveiling a largely unexplored regime in the area of materials science and engineering.
However, random mixing of ≥5–6 elements at equimolar ratios may not always result in the formation of solid-solution phases. In fact, segregation and decomposition into multiple simple phases is the norm, and in that case, the outcome is no more than a mixture of traditional alloys.[Reference Zhou, Zhang, Wang and Chen16, Reference Ranganathan17] Therefore, the kind of HEAs that we are seeking for should assume uncommon atomic-level or microscopic structures, which have the potential to endow properties that are beyond the “rule of mixture”.[Reference Greer18] As we know, for traditional alloys, Hume-Rothery[Reference Hume-Rothery19] generalized several rules on substitutional solid solutions in alloy systems, including: (1) the difference in the atomic sizes between the solute and solvent atoms must be <15%, (2) the crystal structures of the solute and solvent must match, (3) there are the same valence states between the solvent and solute, and (4) the solute and solvent should have similar electronegativity. However, for HEAs, is the above Hume-Rothery rule appropriate or does it need to be revised? To achieve this goal, some guidelines for the HEA design are particularly important and needed. Unfortunately, such a guideline is very difficult to establish due to the “high-entropy effect”, which means high degrees of freedom, randomness, and uncertainty. In particular, there lacks the experimental phase-diagram information for HEA systems mainly due to the presence of more than five elements, which could make the phase diagrams of HEA systems prohibitively complex.
Taking an alternative approach, Zhang et al.[Reference Zhang, Zhou, Lin, Chen and Liaw20] proposed a two-dimensional map to predict the phase formation in HEAs, with its two axes being the enthalpy of mixing (ΔH mix) and the atomic-size difference (δ), respectively:
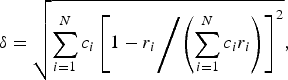 $$\delta=\sqrt {\sum\limits_{i=1}^N {c_i \left[{{{1 - r_i } \Bigg/ {\left({\sum\limits_{i=1}^N {c_i r_i } } \right)}}} \right]^2 } }\comma$$
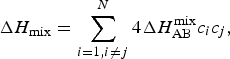 $$\Delta H_{{\rm mix}}=\sum\limits_{i=1\comma i \ne j}^N {4\Delta H_{{\rm A}{\rm B}}^{{\rm mix}} c_i c_j }\comma$$
where N is the total number of components in a system, r i the atomic radius of the ith component, c i the composition of the ith component (in a molar ratio), and ΔH ABmix the enthalpy of mixing between A and B elements. By analyzing a series of experimental data, Zhang et al. found that, when ΔH mix falls in the range of −15 to 5 kJ/mol and δ between 1 and 5%, the HEAs tend to form random solid solutions upon solidification, in which the multiple constituent elements appear to distribute randomly on a simple crystalline lattice, i.e., BCC or FCC types.
Extending the previous models, in this paper we propose some new guidelines for predicting phase formation in HEAs. The usefulness and advantage of the guidelines will be demonstrated through the comprehensive analysis of known HEAs as well as design of new HEAs.
For a solution phase, its Gibbs-free energy of mixing (ΔG mix) can be determined by:
 $$\Delta G_{{\rm mix}}=\Delta H_{{\rm mix}} - {\rm T}\Delta S_{{\rm mix}}\comma$$
where ΔH mix is the enthalpy of mixing, ΔS mix is the entropy of mixing, and T is the absolute temperature. ΔH mix reflects the interatomic interaction and, thus, can be positive or negative. However, ΔS mix contains multiple contributions from different entropy sources. The two major entropy sources are the configurational entropy, ΔS mixconf, and vibrational entropy, ΔS mixphon. Obviously, the combination of a low absolute of ΔH mix and high ΔS mix results in the low free energy, and, thus, stabilize the solution phase as reported in Ref. Reference Zhang, Zhou, Lin, Chen and Liaw20. The ideal configurational entropy of mixing, ΔS mixconf, for a solution phase can be calculated according to Boltzmann's hypothesis by using a regular solution approach:
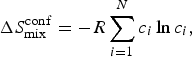 $$\Delta S_{{\rm mix}}^{{\rm conf}}=- R\sum\limits_{i=1}^N {c_i \ln c_i }\comma$$
where R [=8.314 J/(mol K)] is the gas constant. ΔS mixconf reaches its maximum, R ln N, for equal-atomic molar-ratio alloys (namely, the composition is 1/N in a molar fraction for each component). While ΔS mixconf is always positive, ΔS mixphon is more complex and can be positive or negative,[Reference Fultz21] and it can even overweigh the ΔS mixconf for example in V-6.25 atomic percent (at.%) Pt.[Reference Delaire, Swan-Wood and Fultz22] It is difficult to estimate the value of the vibrational entropy of disordered solution phases, and it depends on the molar volumes, structures, and constituent elements. In this study, we consider the configurational entropy in the regular liquid state for simplicity. The tendency of the entropy to a maximum as an isolated system is relaxed to the equilibrium (the second law of thermodynamics) has been known since the mid-19th century. The maximization of the entropy production during non-equilibrium processes [the so-called maximum entropy production principle (MEPP)] appeared in the 20th century.[Reference Martyushev and Seleznev23]
Since both ΔH mix and ΔS mix contribute to the Gibbs-free energy, it is sensible to compare their relative weight using the ratio, i.e., TΔS mix/|ΔH mix|. The ratio is a function of temperature, so the entropy effect overweights the enthalpy effect, as the temperature increases. Figure 1(a) schematically shows the relative entropy effects [Ω(T) = TΔS mix/|ΔH mix|] as a function of temperature for HEAs (marked by HEA in the figure) and low/medium entropy alloys (marked by L/MEA). The slope of the lines is ΔS mix/|ΔH mix|. Thus, the line for the HEA has a larger slope than that of the L/MEA.
Relative entropy effects [Ω(T)] as a function of temperature for HEAs (marked by HEA) and low/medium-entropy alloys (marked by L/MEA) (a), Ω [Ω = Ω(T m)] as a function of ΔT (ΔT = T m–T c) (b), and phase formation regions in a Ω and alloying number N space. The corresponding critical solution temperature (T cH and T cL) are labeled by arrows in (a). Formation of solid solutions is favored when Ω(T m) > 1 or T m > T cH.

Furthermore, the ratio is particularly important at the melting point, T m (i.e., T mΔS mix/|ΔH mix|). At the temperature slightly below T m (i.e., the undercooling required to overcome a nucleation barrier), the primary crystalline phase will nucleate and grow. It could be either the disordered solid-solution phase with a high entropy of mixing but with a low enthalpy of mixing, or the ordered intermetallic compound phase with a low entropy but with a high enthalpy. We, thus, define Ω[Reference Zhang, Yang and Liaw5, Reference Yang and Zhang24] as:
 $$\Omega={{{\rm T}_{\rm m} \Delta S_{{\rm mix}} } / {\left\vert {\Delta H_{{\rm mix}} } \right\vert }}\comma$$
where T m is the average melting point, or the melting point averaged over all involved elements. The implication of Eq. (5) is straightforward: when Ω > 1, the entropy effect at T m is greater than the enthalpy effect. Thus, the high-entropy solid-solution phase tends to form, especially at high quenching rates. The higher the Ω, the stronger the high-entropy effect, and the more likely the random solid solutions gain enough stability to survive at low temperatures.
The above analysis agrees well with the critical solution temperature (T c) defined by Cunliffe et al.,[Reference Cunliffe, Plummer, Figueroa and Todd25] which has an expression as:
 $${\rm T}_{\rm c}={{\left\vert {\Delta H_{{\rm mix}} } \right\vert } / {\Delta S_{{\rm mix}} }}.$$
Substituting T c into Eq. (5), a simplified Ω can be written as:
 $$\Omega={\rm T}_{\rm m} /{\rm T}_{\rm c} .$$
Here T m > T c means Ω > 1, i.e., the critical solution temperature is below the melting temperature, so that the solution can be retained after solidification. Conversely, T m < T c suggests that the critical solution temperature will be reached first during cooling, and the chemical-ordering effect will start to take control in the liquid phase, leading to ordered compounds upon crystallization. If we define the T-dependent Ω as
 $$\Omega \lpar {\rm T}\rpar ={{{\rm T}\Delta S_{{\rm mix}} } / {\left\vert {\Delta H_{{\rm mix}} } \right\vert }}={\rm T}/{\rm T}_{\rm c}$$
and plot the Ω(T) as a function of temperature for HEAs and typical traditional alloys, the relationship between T m and T c can be clearly seen in Fig. 1(a). The corresponding critical solution temperatures (T cH and T cL) are labeled by the arrows. Formation of solid solutions is favored when Ω(T m) > 1 or T m > T cH. Specifically, assuming that T cH and T cL are the critical solution temperatures for HEAs and traditional alloys, respectively, for HEAs, we will see T cH < T m, whereas for traditional alloys, we have T cL > T m.
Figure 1(b) shows Ω [Ω = Ω(T m)] as a function of ΔT (ΔT = T m − Tc). We can see that Ω increases with ΔT and reaches a maximum at 1750 K, and the larger values of ΔT and Ω will make the solid solution easier to form, as presented in the closed square in Fig. 1(b).
Figure 1(c) shows the DSS, BMG, and intermetallic phase formation regions in a Ω and the number of alloy elements N space. We can see Ω is intending to have larger values with increasing of N. The formation region of disordered solid solution (DSS) phases is intending to have larger values of Ω and N. While for the formation of BMGs, both the Ω values and N are lower. The values of Ω and N for the intermetallic phases are located in between the values of the DSS and BMGs phases.
Note that the absolute values of ΔH mix are used to define Ω. However, the positive and negative values of Ω corresponds to the tendency of segregation and ordering during the phase-formation process, respectively. In Fig. 2, we have summarized the calculated Ω* and Ω for the known HEAs. Here Ω is the absolute value of Ω*, Ω = |Ω*|. The corresponding data (see Table S1 in the supplementary materials) are presented in a plot, Ω* ~ δ, Fig. 2(a), because the atomic-size difference, δ, considers another (topological) perspective/dimension in the HEA formation, and complements the thermodynamic parameter, Ω. Indeed, in the two-dimensional Ω* ~ δ (thermodynamic-topological) map, different phases are nicely separated. For example, solid solutions are mostly concentrated in the region of Ω = |Ω*| ≥ 1.1 and δ ≤ 6.6%. BMGs and intermetallics, in contrast, are characterized by smaller Ω and larger δ values. Since both Ω and δ values can be readily calculated with the above Eqs. (1), (2), (4) and (5), one can, thus, make predictions on the phase formation in HEAs using the map in Fig. 2(a). Figure 2(b) shows the Ω as a function of ΔH mix. We can see that a solid solution forms at ΔH mix close to zero, and at the same time, Ω reaches a maximum. Figure 2(c) shows schematically phase formation regions with different cooling rate R. We can see the Ω values for the DSS phase are the highest, for the BMGs are lowest, while the values of intermetallic phases are in between of them. With increasing the cooling rate, the formation regions for both DSS and BMGs will intend to expand, and for the intemetallic phases will be reduced.
Phase-formation map (Ω* ~ δ plot, Ω = |Ω*|) for multi-component alloys (a), Ω as a function of ΔH mix (b), and the phase formation regions with cooling rates R. Formation of solid solutions (S) is favored when Ω, the absolute value of Ω*, is high, and δ, the atomic-size mismatch, is low. Intermetallics (I) and bulk metallic glasses (B) have smaller Ω and larger δ. Each point corresponds to an alloy composition (data are from Table S1 in the supplementary information).
The high-entropy solid solution, although chemically disordered, can assume various simple topological structures. BCC and FCC structures are the two major types observed in HEAs. The important question is, then, how to predict the structure of the solid solution. We have shown that the relative entropy effect Ω, can be used to predict the formation of solid solutions. However, Ω is not expected to reflect the differences between BCC and FCC solid solutions. Rather than taking the ratio into account, in Fig. 3 we compare the absolute ΔH mix of various HEAs at different compositions (the corresponding data are also from Table S1), again in a two-dimensional map with δ as the other parameter. Interestingly, the figure reveals that FCC solid solutions tend to have larger ΔH mix and smaller δ values, and BCC solid solutions exhibit smaller ΔH mix and larger δ values. When δ exceeds 6.6%, solid solutions give way to intermetallic compounds, consistent with Fig. 2(a). It should be noted that for intermediate ΔH mix and δ, one may have a mixture of BCC and FCC solid solutions.
Crystal structures and their correlation with the enthalpy of mixing (ΔH mix) and the atomic-size difference (δ) in various HEAs. Each point corresponds to an alloy composition (data from Table S1 in the supplementary information). As illustrated in this map, compositions favoring FCC, FCC/BCC, and BCC solid solutions, and intermetallics tend to fall in different regions. For a given composition, one can, thus, make predictions on the solidified structure by calculating ΔH mix and δ.
To validate our model for predicting phase formation in these HEAs, in Table S1, we also listed the crystal structure, valence-electron concentration (VEC), enthalpy of mixing (ΔH mix), entropy of mixing (ΔS mix), critical solution temperature (T c), the average melting point (T m), the relative entropy effect (Ω), and the atomic-size difference (δ) of the present AlxCrCuFeNi2 alloys. From the table, several points can be observed. Firstly, with decreasing VEC, the crystal structure of alloys changes from FCC to BCC, which is generally consistent with the proposed VEC criterion.[Reference Hume-Rothery19] However, the critical VEC for the FCC-to-BCC transition may not be a universal value. The value of VEC <6.8 as suggested in Ref. Reference Hume-Rothery19 is not appropriate in our case; this trend can also be observed from other HEA solid-solution compositions in Table S1. Secondly, Ω is >1 for all alloys, and they are indeed all solid solutions, except the one with the lowest Ω (Ω = 1.56, close to 1), which contains a small fraction of B2-ordered precipitates. This trend is consistent with the criterion that we have shown in Fig. 2(a). In addition, FCC phases in these alloys are found to have higher ΔH mix and lower δ, whereas BCC phases show lower ΔH mix and higher δ. Clearly, this observation lends further support to the mentioned analysis on the correlation between crystal structures of HEAs and ΔH mix and δ as shown in Fig. 3.
Additional criteria have also been proposed to predict the composition-dependent structure of HEAs. For example, Guo et al.[Reference Guo, Ng, Lu and Liu26] calculated the VEC in various HEAs, and concluded that at VEC <6.8, BCC solid solutions are preferred, whereas at VEC >8, FCC solid solutions are more stable. Wang et al. and Zhang et al.[Reference Wang, Zhang and Chen27, Reference Zhang, Zhou, Hui, Wang and Chen28] suggested that the structure changing from an FCC to BCC structure with compositions can be attributed to the atomic-level strain energy.[Reference Egami and Waseda29] Specifically, the FCC structure has the highest packing efficiency for identical hard spheres, and for a metallic solid-solution FCC phase, the constitute elements often have similar atomic sizes. Since Al has a relatively larger atomic size compared to many 3d-transition metal elements (e.g., Cr, Fe, Co, Ni, and Cu), its addition may result in significant atomic-level strains in the FCC lattice. With increasing Al contents, the accumulated atomic-level strains may eventually destabilize the FCC structure, triggering the FCC-to-BCC transition.[Reference Ma, Zhang, Gao, Liaw and Zhang30–Reference Tang, Gao, Diao, Yang, Liu, Zuo, Zhang, Lu, Cheng, Zhang, Dahmen, Liaw and Egami31] With a lower packing efficiency in the BCC phase, the strain energy is largely released.
In conclusion, we have proposed to use the combined thermodynamic and topological parameters (specifically the Ω ~ δ and ΔH mix ~ δ maps) to predict the phase formation of HEA systems. These parameters are found to be indicative of the solidified phases, such as solid solutions (a BCC or FCC structure or a mixture), intermetallics, and metallic glasses. Previous data on known HEAs and our new data of AlxCrCuFeNi2 alloys (see Table S1) all yield consistent results, validating this method. To recap, the relative weight of the entropy over the enthalpy can be evaluated using Ω = T mΔS mix/|ΔH mix|. When Ω≫1, the entropy effect overwhelms the enthalpy effect, and, thus, the formation of solid solutions is likely, especially if the atomic-size difference is small. This trend can be achieved by mixing multiple elements at equimolar ratios, as what has been done in HEAs. The correlations observed in this study are expected to help us understand and predict phase formation in complex alloys, which may eventually lead to the alloy (HEA) design for desired phases, structures, and, thus, properties.
Supplementary materials
For supplementary material for this article, please visit http://dx.doi.org/10.1557/mrc.2014.11
Acknowledgments
The authors would like to acknowledge the financial support by the National Natural Science Foundation of China (NNSFC, No. 50971019, 51010001, and 51001009), 111 Project (B07003), and Program for Changjiang Scholars and Innovative Research Team in University. PKL very much appreciates the financial support from the US National Science Foundation (DMR-0909037, CMMI-0900271, and CMMI-1100080), the Department of Energy (DOE), Office of Nuclear Energy's Nuclear Energy University Programs (NEUP) 00119262, and the DOE, Office of Fossil Energy, National Energy Technology Laboratory (DE-FE-0008855 and DE-FE-0011194) with C. Huber, C. V. Cooper, D. Finotello, A. Ardell, E. Taleff, V. Cedro, R. O. Jensen, L. Tan, and S. Lesica as contract monitors. YQC is supported by the Scientific User Facilities Division, Office of Basic Energy Sciences, US Department of Energy. MCG acknowledges the support of the Innovative Processing and Technologies Program of the National Energy Technology Laboratory's (NETL) Strategic Center for Coal under the RES contract DE-FE-0004000.



