I. INTRODUCTION
Single atomic layer two-dimensional films with thicknesses of typically less than 1 nm are commonly known as atomically thin films. Such a class of materials includes (but is not limited to) graphene, graphene oxide, hexagonal-boron nitride (h-BN), molybdenum disulfide (MoS2), and niobium diselenide (NbSe2). Ever since Geim and Novoselov Reference Geim and Novoselov1 won the Nobel prize in physics for their identification and characterization of monolayer graphene (∼0.333 nm thick), studies on this class of materials have boomed. Their potential industrial applications to composite materials, Reference Stankovich, Dikin, Dommett, Kohlhaas, Zimney, Stach, Piner, Nguyen and Ruoff2–Reference Eda and Chhowalla4 lubricants, Reference Sandoz-Rosado, Tertuliano and Terrell5,Reference Kim, Lee, Lee, Lee, Jang, Ahn, Kim and Lee6 electronics, Reference Sungjin, Jinho, Ji Won and Ruoff7–Reference Lopez-Sanchez, Lembke, Kayci, Radenovic and Kis9 batteries, Reference Li, Chen, Ren, Li and Cheng10–Reference Meng, Yang and Sun12 optics, Reference Ci, Song, Jin, Jariwala, Wu, Li, Srivastava, Wang, Storr, Balicas, Liu and Ajayan13,Reference Loh, Bao, Eda and Chhowalla14 as well as many more emerging fields have attracted much attention in the last decade. In addition to the well-documented electronic benefits of graphene, its mechanical behavior has become of particular interest recently with respect to the above-mentioned applications. For example, graphene has been demonstrated to be one of the stiffest and strongest materials found in nature, Reference Lee, Wei, Kysar and Hone15 which makes it a great candidate for reinforcement in composite materials. Here, we review recent experimental results on the mechanical behavior (e.g., elastic modulus, strength, friction, and fracture) of the most studied atomically thin films which include graphene, graphene oxide, and h-BN.
II. MATERIAL SYNTHESIS
Graphene can be produced through the following four methods:
A. Mechanical exfoliation
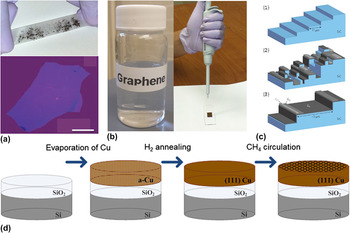
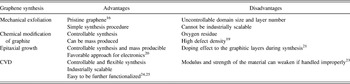
Mechanically exfoliating graphite using scotch tape to produce graphene films was the first approach demonstrated to obtain pristine graphene [Fig. 1(a)]. Reference Novoselov, Geim, Morozov, Jiang, Zhang, Dubonos, Grigorieva and Firsov16 Empirical parameters such as scotch tape adhesion characteristics and exfoliation time have been demonstrated to be important for producing monolayer or few-layers graphene. The advantages of this method are that the graphene films achieved are monocrystalline, and no complicated experimental setup is needed. However, the number of layers and the size of crystal domains are not easily controllable; in addition, the application of this method is limited due to its difficulty of application in mass production.
Four types of graphene synthesis techniques: (a) mechanical exfoliation of graphite. Top: graphene flakes on scotch tape; bottom: 3-nm-thick graphene under an optical microscope; scale bar: 20 µm. Reprinted with permission from Ref. Reference Novoselov, Geim, Morozov, Jiang, Zhang, Dubonos, Grigorieva and Firsov16, Copyright 2004 Science. (b) Chemical modification of graphite. Solution-based graphene can be drop-casted on to the target substrate. (c) Epitaxial growth on SiC. (1) SiC starting surface with a staircase of flat terraces and atomic steps. (2) Schematic morphology of vacuum graphitized SiC. (3) Morphology obtained in high-pressure argon. The surface termination is predominantly monolayer graphene. Reprinted with permission from Ref. Reference Sutter17, Copyright 2009 Nature Publishing Group. (d) Process flow of CVD of graphene on evaporated Cu (111) film. Reprinted with permission from Ref. Reference Tao, Lee, Holt, Chou, McDonnell, Ferrer, Babenco, Wallace, Banerjee, Ruoff and Akinwande18, Copyright 2012 American Chemical Society.

B. Chemical modification of graphite
Oxidizing graphite to form graphite oxide or starting with expandable graphite or graphite intercalation compounds to generate colloidal suspensions of graphite sheets, and then chemically or thermally reducing to graphene are several chemical methods of producing graphene [Fig. 1(b)]. Reference Park and Ruoff19 Using such chemical methods, mass production and controllable synthesis of graphene become possible; however, graphene produced by this approach has a major disadvantage in that the resulting graphene films often contain a significant amount of residual oxygen and high defect density. Reference Park and Ruoff19
C. Epitaxial growth
Graphitic layers can be epitaxially grown on crystal substrates such as SiC Reference Geim20 or metals Reference Sutter17 to produce graphene [Fig. 1(c)]. In the case of metals, the underlying metal layer can then be etched away to produce graphene that is transferable to other substrates. Graphitic layers can also be grown on SiC that automatically provides an insulating substrate, which is a favorable approach for electronic devices. Reference Geim20 One major limitation with this method is the doping effect between the substrate and the graphitic layers during the growing process. Reference Zhou, Gweon, Fedorov, First, de Heer, Lee, Guinea, Castro Neto and Lanzara21
D. Chemical vapor deposition
The chemical vapor deposition (CVD) growth approach is generally considered the most promising technique to produce industrially scalable graphene because of its flexibility [Fig. 1(d)]. Reference Park, Meyer, Roth and Skákalová22 One disadvantage is that CVD-grown graphene is typically polycrystalline which can impact its electronic and mechanical behavior. The presence of grain boundaries (GBs) in CVD graphene was initially thought to reduce the mechanical properties of graphene, but a recent study by Lee et al. Reference Lee, Cooper, An, Lee, van der Zande, Petrone, Hammerberg, Lee, Crawford, Oliver, Kysar and Hone23 has shown that it has nearly equivalent modulus and strength compared with that of single crystalline graphene. Furthermore, the CVD approach can be used to produce functionalized graphene such as substitutionally doped graphene Reference Wei, Liu, Wang, Zhang, Huang and Yu24 and C-graphene. Reference Cai, Piner, Stadermann, Park, Shaibat, Ishii, Yang, Velamakanni, Sung, Stoller, An, Chen and Ruoff25 A summary showing the advantages and disadvantages of each method is shown in Table I.
Comparison of four major graphene synthesis methods.

Graphene oxide is typically synthesised by the oxidization of graphite. GO films can then be dispersed on substrate from solution in solvents such as water and ethanol with the enhancement of sonication. Three reported synthesis approaches include Brodie, Staudenmaier, or Hummers methods. Reference Zhu, Murali, Cai, Li, Suk, Potts and Ruoff26 The main difference among these methods is in the oxidizing acid used, which leads to different levels of oxidization.
Hexagonal boron nitride (h-BN) thin films can be synthesized following a similar protocol described earlier for producing graphene. Mechanical exfoliation, as illustrated above for graphene, can be used to obtain high quality but small-sized h-BN flakes. Reference Novoselov, Jiang, Schedin, Booth, Khotkevich, Morozov and Geim27 “Liquid phase exfoliation” Reference Coleman, Lotya, O’Neill, Bergin, King, Khan, Young, Gaucher, De, Smith, Shvets, Arora, Stanton, Kim, Lee, Kim, Duesberg, Hallam, Boland, Wang, Donegan, Grunlan, Moriarty, Shmeliov, Nicholls, Perkins, Grieveson, Theuwissen, McComb, Nellist and Nicolosi28 is a method that can obtain scalable h-BN flakes. Bulk BN crystals can be exfoliated in solvents such as isopropyl alcohol (IPA) with the assistance of sonication and centrifugation, and then dispersed onto a target substrate. CVD can produce industrially scalable h-BN thin films. However, unlike graphene synthesis, all of the above-mentioned methods have yet to be shown to produce high-quality monolayer h-BN, although scalable few layers h-BN can be achieved by liquid phase exfoliation and CVD. One of the reasons lies in the nature of B-N bonding (having ionic characteristics that differ from C-C covalent bonding) which results in so called “lip-lip” interactions between individual layers. Reference Golberg, Bando, Huang, Terao, Mitome, Tang and Zhi29 Recently, using ammonia borane as a precursor was demonstrated Reference Gao, Ren, Ma, Liu, Zhang, Liu, Ma, Ma and Cheng30 for ambient pressure CVD growth of h-boron Pt foils with controlled layers.
III. ELASTIC MODULUS AND STRENGTH
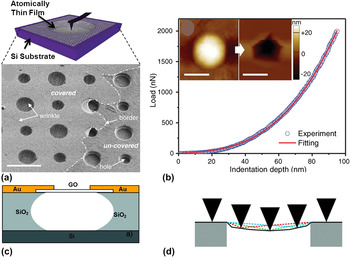
Elastic modulus and strength, as two important mechanical properties of materials, of atomically thin films have drawn intensive attention. Challenges in characterizing mechanical properties of atomically thin films include well-defined sample geometries, stress concentration at boundaries, measuring low forces, and developing mechanics models for determining stress. To overcome this limitation, Lee et al. Reference Lee, Wei, Kysar and Hone15 performed atomic force microscopy (AFM) measurements on suspended thin films on Si wafers with circular holes (diameter ∼2 µm) to determine elastic modulus and strength [Fig. 2(a) ]. The method is similar to previously developed methods for investigating the mechanical behavior of thin metal films, where a nanoindenter was used instead of an AFM for force and deflection measurements. Reference Espinosa, Prorok and Peng33 The AFM deflection technique eliminates both the boundary condition problem and the substrate effect, which enables nanoindentation to be an ideal way to measuring modulus and strength for this class of materials. In addition, graphitic ultrathin films are found to adhere to Si strongly; therefore, no observable slippage occurs during indentation or scanning, presumably due to van der Waals attractions between the film and the substrate. Reference Lee, Wei, Kysar and Hone15 This technique has been applied to characterize various 2D ultrathin films (graphene, graphene oxide, and boron nitride).
(a) Graphene membrane suspended over the Si substrate with circular holes. Reprinted with permission from Ref. Reference Lee, Cooper, An, Lee, van der Zande, Petrone, Hammerberg, Lee, Crawford, Oliver, Kysar and Hone23, Copyright 2013 Science. (b) Force–displacement curve of CVD graphene film in AFM nanoindentation. Inset: the AFM topology images of the suspended graphene film before and after fracture. Reprinted with permission from Ref. Reference Lee, Cooper, An, Lee, van der Zande, Petrone, Hammerberg, Lee, Crawford, Oliver, Kysar and Hone23, Copyright 2013 Science. (c) Graphene oxide film suspended over trenches. Reprinted with permission from Ref. Reference Gómez-Navarro, Burghard and Kern31, Copyright 2008 American Chemical Society. (d) Graphene oxide film suspended over holey carbon substrate. Reprinted with permission from Ref. Reference Suk, Piner, An and Ruoff32, Copyright 2010 American Chemical Society.

Graphene was the first atomically thin film that was characterized using the above mentioned technique. Lee et al. Reference Lee, Wei, Kysar and Hone15 mechanically exfoliated graphite onto a micromachined Si substrate to form monolayer suspended pristine graphene with well-defined circular boundary conditions [Fig. 2(a)]. Indentation tests were performed at the center of the suspended membrane for elastic modulus and strength measurements. A nonlinear elastic response was governed by the third order stress strain relationship:
 $${\rm{\sigma }} = E{\rm{\varepsilon }} + D{\rm{\varepsilon }}^2 \quad ,$$
where σ is the symmetric 2nd Piola–Kirchhoff stress, ε is the uniaxial Lagrangian strain, E is the Young's modulus, and D is the 3rd order elastic modulus. Based on statistical analysis, E was determined to be 1.0 ± 0.1 TPa and D was −2.0 ± 0.4 TPa assuming an effective graphene thickness of 0.335 nm. As mentioned above, graphene produced by mechanical exfoliation is proven to be single crystalline with a low defect density, based on which the measured strength can be viewed as the intrinsic strength of monolayer graphene. Assuming the indenter has a spherical shape and ignoring the nonlinear elasticity, the maximum stress under this configuration can be modeled as
 $${\rm{\sigma }}_m^{2D} = ({{FE^{2D} } \over {4{\rm{\pi }}R}})^{{1 \over 2}} \quad ,$$
where
 ${\rm{\sigma }}_m^{2D}$
is the maximum stress at the center of the film, F is the maximum force, and R is the radius of the indenter. Combining nonlinear elasticity, the calculated intrinsic strength was 130 ± 10 GPa at 25% strain. This work is the first comprehensive measurement of elastic properties of monolayer graphene, which set the benchmark for mechanical characterization of ultrathin films.
Mechanically exfoliated graphene has limited applications due to manufacturing limitations. However, graphene produced by the CVD method is a promising approach to produce industrially scalable materials. Earlier measurements of CVD graphene showed that due to the existence of grain boundaries (GBs), the elastic stiffness degrades to ∼165 GPa. Reference Huang, Ruiz-Vargas, van der Zande, Whitney, Levendorf, Kevek, Garg, Alden, Hustedt, Zhu, Park, McEuen and Muller34,Reference Ruiz-Vargas, Zhuang, Huang, van der Zande, Garg, McEuen, Muller, Hennig and Park35 Lee et al. Reference Lee, Cooper, An, Lee, van der Zande, Petrone, Hammerberg, Lee, Crawford, Oliver, Kysar and Hone23 recently provided a possible explanation as to why the previous practices can degrade the elastic stiffness and proposed improvement to keep graphene intact during fabrication. They claimed that the problem was the creation of ripples during the graphene transfer process. It is known that CVD grown graphene is typically synthesized on metals (e.g., copper). During the dry transfer process, Poly (methyl methacrylate) (PMMA) is coated on top of graphene as a handle layer and then the copper substrate is etched away. After stamping graphene onto the target substrate, the PMMA layer is also removed. Lee et al. found the etching solvents and the removing step created the ripples. When the copper etchant is changed to ammonium persulfate [(NH4)2S2O8] instead of ferric chloride (FeCl3) and the air-baking step during PMMA removal is eliminated, ripples are largely reduced. Following the same testing protocol as for pristine graphene, Lee et al. showed that the elastic moduli for both large graphene (LG) and small graphene (SG) are approximately 1 TPa [Fig. 2(b)]. They concluded that there are no statistical differences between the two types. Under the same testing configuration, the breaking strength of SG, LG, and pristine graphene was measured as well. The results demonstrate that LG and pristine graphene have an equivalent strength of 118 GPa, and SG has slightly lower strength of 98.5 Gpa, which was attributed to randomly distributed defects and GBs.
The first measurements of the mechanical properties of graphene oxide films were conducted on GO reduced graphene by Gómez-Navarro et al. Reference Gómez-Navarro, Burghard and Kern31 Such materials do not exhibit a pristine graphene structure and have been shown to still contain many O groups following reduction giving them a hybrid graphene–GO structure. Reference Girit, Meyer, Erni, Rossell, Kisielowski, Yang, Park, Crommie, Cohen, Louie and Zettl36 Gómez-Navarro et al. adopted a testing configuration of suspending reduced GO over a Si/SiO2trench [Fig. 2(c)]. Indentation tests were performed at the center of the film. Elastic modulus of the film was extracted according to
 $$E = {{32\left( {l/t} \right)^3 K_{{\rm{eff}}} } \over {\rm{\omega }}} - 17Tl^2 /32{\rm{\omega }}t^3 \quad ,$$
where E is the elastic modulus, K eff is the stiffness which can be obtained through the force distance curve from indentation, t, ω, and l are the thickness, width, and length of the suspended film, T is the pretension in the film. This model is based on the double-clamped beam theory. For small indentation depth (pure bending regime) and point load at the center, force constants depend both on the properties and geometry of the material, which is different than Lee's model [Eq. (1)]. The results showed that the elastic modulus was 0.25 ± 0.15 TPa.
Suk et al. Reference Suk, Piner, An and Ruoff32 directly measured the elastic modulus of monolayer graphene oxide by a similar experimental setup as Lee et al. Reference Lee, Wei, Kysar and Hone15 Instead of using a Si-based substrate to suspend the film, they used a carbon film-based TEM grid with circular holes, which, while providing well-defined boundary conditions and good adhesion between the film and the substrate, has a limitation in that the supporting membrane is very compliant in the normal direction. Rather than doing indentation on the film, they used a technique of solely scanning the film surface using contact mode AFM [Fig. 2(d)]. By applying different loads while scanning the surface, deflection of the film varies. Coupling with finite element analysis, the reduced modulus of monolayer graphene oxide was measured to be 207.6 ± 23.4 GPa. Assuming bending stiffness to be zero, the Young's modulus was also determined to be 156.5 ± 23.9 GPa. These results are in agreement with those reported by Gómez-Navarro et al. Reference Gómez-Navarro, Burghard and Kern31 The advantages of this method are that it avoids large load and sample damage; the problem of indentation induced jumping or snapping of AFM tips Reference Joyce and Houston37 is minimized; and pretension in the film can also be considered and calculated. Most importantly, the strength of the film cannot be measured on a soft substrate. To our knowledge, the strength of monolayer graphene oxide has not yet been reported, although it is a critical parameter considering the use of graphene oxide in macroscopic materials. Reference Dikin, Stankovich, Zimney, Piner, Dommett, Evmenenko, Nguyen and Ruoff38
Boron nitride few-layer films produced by CVD were mechanically tested by Song et al. Reference Song, Ci, Lu, Sorokin, Jin, Ni, Kvashnin, Kvashnin, Lou, Yakobson and Ajayan39 h-BN films (1- to 2-nm thick, 3–5 layers) were tautly covered on a Si wafer with 1 µm holes, forming a similar experimental setup to the one reported by Lee et al. Reference Lee, Wei, Kysar and Hone15 Indentation tests were performed to extract the Young's modulus and strength of the films. The theoretical model used for analyzing experimental data was also the same as that used by Lee et al. Reference Lee, Wei, Kysar and Hone15 The reported results were 223 ± 16 GPa and 8.8 ± 1.2 GPa for elastic stiffness and breaking strength, which are comparable to pristine graphene (∼1 TPa and 130 GPa). They also concluded that with the increase in layers, both Young's modulus and strength of the film increase. Elastic modulus and strength for monolayer and pristine h-BN thus far have not been reported.
Elastic modulus of other 2D atomically thin films were also measured based on the “suspension” technique. For instance, Castellanos-Gomez et al. Reference Castellanos-Gomez, Poot, Steele, van der Zant, Agrait and Rubio-Bollinger40 measured elastic modulus of few-layer MoS2 (∼5 layers) to be 0.33 ± 0.07 GPa (strength was not reported). From the above-reported elastic modulus of these 2D ultrathin films, one can see that this is an extremely strong class of materials. Unfortunately, the strength of graphene oxide has not yet been reported. Fabrication techniques of this class of materials vary, creating defect density differences among even the same type of material. Elastic modulus and strength produced/transferred by different approaches may vary correspondingly. Systematic studies of elastic properties of films synthesized by different methods, especially for GO, h-BN, and MoS2, still need to be performed.
IV. FRICTIONAL PROPERTIES
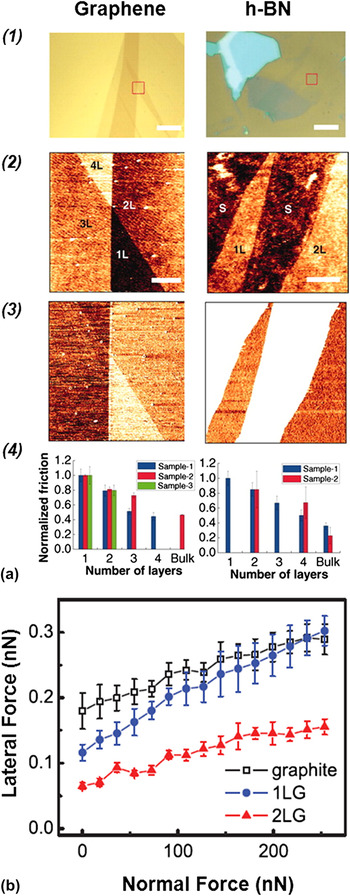
The frictional properties of graphene produced by epitaxial growth on a SiC substrate were characterized by Filleter et al. Reference Filleter, McChesney, Bostwick, Rotenberg, Emtsev, Seyller, Horn and Bennewitz41 The results showed that friction on single-layer graphene is higher than that of bilayer graphene. Similar results were reported by Lee et al. Reference Lee, Li, Kalb, Liu, Berger, Carpick and Hone42 demonstrating that the friction of the graphene film has an inverse proportional relationship with layer thickness. Single-layer graphene shows the highest friction, whereas samples with a thickness of approximately four layers exhibit the lowest friction and approach levels of bulk graphite [Fig. 3(a), left]. However, for bulk graphite samples, there was some discrepancy between these studies. Filleter et al. observed that friction on graphite is higher than single-layer graphene due to higher adhesion, which can be seen from the normal versus lateral force curve comparison between 1LG, 2LG, and graphite [Fig. 3(b)]. Bilayer graphene and graphite have the same slope suggesting a similar friction coefficient, but with the same normal load, graphite shows a higher offset lateral force indicating higher adhesion between graphene and the tip. Lee et al. suggested that graphite has higher bending stiffness compared with few layer graphene so that the lateral motion on graphite (more than 5 layers) is easier than on few-layer graphene. For single and several-layer graphene, Lee et al. also showed that substrate (loosely adhere or suspended), scan size, and scan rate differences would not affect the trend. However, if the graphene film adheres strongly to the underlying substrate, the trend would be suppressed. In other words, friction on few-layer graphene is almost identical to graphite if they are well adhered to the substrate. This insight provides potential opportunities to control tribological effects during applications. Lee et al. and Filleter et al. together comprehensively interpreted the frictional properties of mechanically exfoliated and epitaxially grown graphene. However, frictional properties of graphene produced by other methods such as CVD and chemically reduced graphene are yet to be studied.
(a) Optical and AFM images of atomically thin sheets of graphene and h-BN on silicon dioxide: (1) bright-field optical microscope images of thin sample flakes. The red dotted squares represent subsequent AFM scan areas. Scale bars, 10 µm. (2 and 3) Topographic and friction (forward scan) images measured simultaneously by AFM from the indicated areas. 1L, 2L, 3L, etc. indicate sheets with thicknesses of one, two, three, etc. atomic layers. BL (“bulk-like”) denotes an area with a very thick flake, and S represents an area with bare SiO2 substrate. Scale bars, 1 µm. (4) Friction on areas with different layer thicknesses. For each sample, friction is normalized to the value obtained for the thinnest layer. Error bars represent the standard deviation of the friction signals of each area. In each chart, the same color represents data from the same sample. Reprinted with permission from Ref. Reference Lee, Li, Kalb, Liu, Berger, Carpick and Hone42, Copyright 2010 Science. (b) Normal versus lateral force measurement on single layer (1LG), bilayer (2LG), and graphite. Reprinted with permission from Ref. Reference Filleter, McChesney, Bostwick, Rotenberg, Emtsev, Seyller, Horn and Bennewitz41, Copyright 2009 Physical Review Letters.

h-BN fabricated by mechanical exfoliation was the only type of h-BN material whose frictional property has been studied. The relationship between friction and layer thickness for h-BN has a similar trend to graphene, proposed by Lee et al. Reference Lee, Li, Kalb, Liu, Berger, Carpick and Hone42 As the number of layers increases, the friction reduces accordingly if the film is loosely adhered to or suspended on the underlying substrate [Fig. 3(a), right]. Because of the difficulty of producing single- or few-layer h-BN films, the amount of experimental data was limited for drawing conclusions. Additionally, whether h-BN films produced by other methods result in differences in frictional properties is not known yet.
Graphene oxide of single or few layers has not been systematically studied in terms of frictional properties, although Ou et al. Reference Ou, Wang, Liu, Mu, Ren, Wang and Yang43 reported that reduced graphene oxide sheets can be used to reduce wear life under small loads. Tribological behavior of few-layer graphene oxide was only preliminarily reported qualitatively. Reference Wei, Wang, Kim, Kim, Hu, Yakes, Laracuente, Dai, Marder, Berger, King, de Heer, Sheehan and Riedo44 Furthermore, Wei et al. Reference Wei, Wang, Kim, Kim, Hu, Yakes, Laracuente, Dai, Marder, Berger, King, de Heer, Sheehan and Riedo44 found that thermal reduction can lower the friction of graphene oxide by replacing it with graphene. Graphene oxide has a wide range of applications; hence, its frictional properties deserve further studies, in particular due to the capabilities to functionalize its surfaces.
V. FRACTURE BEHAVIOR
Fracture behavior is another fundamental material property, which is critical in understanding the failure of materials. Even a single crack can cause the entire failure of a material. For 2D ultrathin films, stress concentrations can lead to crack formation and growth. Graphene is the only atomically thin film that has been characterized in terms of fracture behavior. The fracture behavior of graphene oxide, h-BN, and MoS2 has not been reported to date.
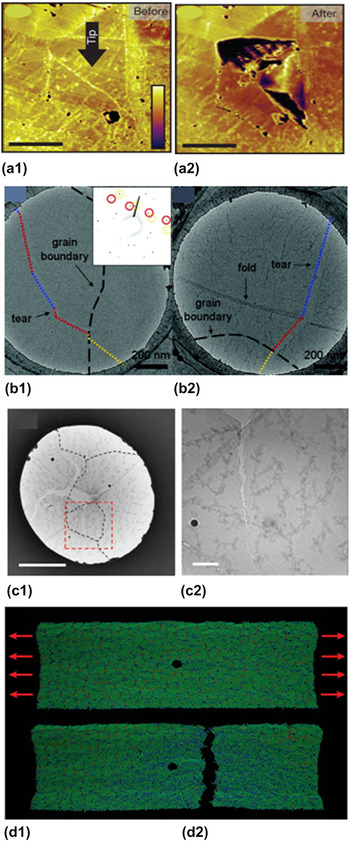
Fracture behavior was experimentally characterized on CVD-produced graphene due to its polycrystalline nature. Huang et al. Reference Huang, Ruiz-Vargas, van der Zande, Whitney, Levendorf, Kevek, Garg, Alden, Hustedt, Zhu, Park, McEuen and Muller34 utilized a dark-field transmission electron microscope to obtain high-resolution images of grains and GBs of graphene [Fig. 4(a)]. By doing so, they mapped the location and the tilt orientation of grains and further found that different grains are stitched together mainly by pentagon–heptagon pairs. Indentation was performed to test the strength of the membrane, following the protocol of suspension of a film over a holey substrate. Reference Lee, Wei, Kysar and Hone15 The key findings are that the breaking load is approximately 1.7 orders of magnitude lower than pristine graphene, and cracks propagate along GBs. A similar finding was observed by Kim et al. Reference Kim, Artyukhov, Regan, Liu, Crommie, Yakobson and Zettl45 that electron excitation-initiated cracks prefer to propagate either along armchair or zigzag directions, indicating that GBs are weaker regions [Fig. 4(b)]. However, Lee et al. Reference Lee, Cooper, An, Lee, van der Zande, Petrone, Hammerberg, Lee, Crawford, Oliver, Kysar and Hone23 recently performed indentation directly on GBs, showing that an intergranular crack was formed under the tip. This confirmed GBs are somewhat weaker than graphene, but cracks later propagate into adjoining grains, and the torn edges of the transgranular cracks have an irregular sawtooth shape [Fig. 4(c)]. Also, their measured strength of GBs is much higher than previous studies because of their better sample transfer techniques.
(a) AFM phase images of a graphene grain before and after an indentation measurement. (a1) Indentation takes place at the center of this grain as shown by the arrow. (a2) The region is torn along GBs after indentation. Reprinted with permission from Ref. Reference Huang, Ruiz-Vargas, van der Zande, Whitney, Levendorf, Kevek, Garg, Alden, Hustedt, Zhu, Park, McEuen and Muller34, Copyright 2011 Nature Publishing Group. (b) Graphene tears crossing GBs. (b1) TEM image of graphene tear crossing, not following, a GB in graphene. The GBs are identified by the high absorbent concentration along the GB together with electron diffraction. The inset of the diffraction pattern around the GB showing two sets of hexagonal patterns from two adjacent tilt grains, where the hexagonal pattern marked with red and dashed yellow circles corresponds to the grain in the left and right sides, respectively. The blue dotted lines represent tear lines in the zigzag direction. The red and yellow dotted lines represent tear lines in the armchair direction. (b2) Another TEM image of a graphene tear crossing a GB and fold in graphene. The blue dotted line represents a line in the zigzag direction. The red and yellow dotted lines represent the armchair direction. Reprinted with permission from Ref. Reference Kim, Artyukhov, Regan, Liu, Crommie, Yakobson and Zettl45, Copyright 2012 American Chemical Society. (c) (c1) BF-TEM image after indentation. The black dashed lines indicate GBs. (c2) Enlarged BFTEM image of the red dashed area of (c1). Reprinted with permission from Ref. Reference Lee, Cooper, An, Lee, van der Zande, Petrone, Hammerberg, Lee, Crawford, Oliver, Kysar and Hone23, Copyright 2013 Science. (d) Simulation of crack propagation on polycrystalline graphene with existing flaws. Reprinted with permission from Ref. Reference Zhang, Li, Kadkhodaei and Gao46, Copyright 2012 American Chemical Society.

Analyzing the above three studies, Reference Lee, Cooper, An, Lee, van der Zande, Petrone, Hammerberg, Lee, Crawford, Oliver, Kysar and Hone23,Reference Huang, Ruiz-Vargas, van der Zande, Whitney, Levendorf, Kevek, Garg, Alden, Hustedt, Zhu, Park, McEuen and Muller34,Reference Kim, Artyukhov, Regan, Liu, Crommie, Yakobson and Zettl45 one can notice that as the sample preparation and transfer techniques become more mature, the weakening effect on strength caused by the presence of GBs becomes less pronounced. However, due to the disagreement of experimental observance of crack propagation, further studies are needed to explore the physics behind how and why cracks form and propagate in this class of ultrathin materials. Toward this end, through molecular dynamic simulations, Zhang et al. Reference Zhang, Li, Kadkhodaei and Gao46 showed that polycrystalline graphene exhibits “flaw tolerance.” As illustrated in Fig. 4(d), the fracture behavior of polycrystalline graphene can become insensitive to a preexisting flaw (hole or notch) below a critical length scale, suggesting that there is no stress concentration near the flaw site. Experimental verification of such an effect is yet to be conducted to confirm the failure and fracture mechanisms of graphene.
VI. SUMMARY
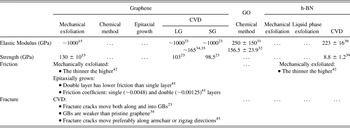
Graphene has been the most extensively studied of the atomically thin film class of materials that have been reviewed here. As summarized in Table II, a wide range of mechanical properties (elastic modulus, strength, friction, and fracture) of graphene has been reported, though property comparisons among graphene produced by different techniques are not complete.
Summary of state-of-the-art results.

Graphene oxide's strength, friction, and fracture behavior still await further investigation. This is due in part to the challenges involved in fabricating large, flat, and uniform samples similar to those that can be produced by exfoliating graphene. Fracture behavior of h-BN is not known, and comparisons of the other three mechanical properties of h-BN produced by different methods also are yet to be studied. Deeper exploration including additional small-scale mechanical characterization of atomically thin films is needed. This will require advances in instrumentation. For example, the dislocation and fracture behavior of films is an important fundamental mechanical property of materials, which if well understood, can be used to predict failure mechanisms. To date, its study in such small systems has been limited by insufficient methodologies and tools.
To achieve this goal, fast and high-resolution microscopy techniques coupled with specially designed devices that can handle the materials of this scale are required. Dynamic TEM Reference Kim, LaGrange, Reed, Taheri, Armstrong, King, Browning and Campbell47 is an emerging technique which can already provide temporal resolution of structural changes observed by TEM in materials on the order of approximately nanoseconds. Further advances will be required to temporally resolve dislocation propagation. Microelectromechanical system (MEMS) devices can also be designed and applied to perform a number of mechanical tests on atomically thin films in situ electron microscopes; however, the reported MEMS devices for studying 1D nanostructures Reference Yong, Xinyu, Changhai, Yan Liang, Lixin and Yu48,Reference Li, Zhang, To, You and Sun49 such as nanotubes and nanowires Reference Espinosa, Bernal and Filleter50 have yet to be extended to 2D films.
Further understanding of the mechanical properties of atomically thin films can greatly impact their applications. For example, industrially scalable atomically thin film-based materials are promising to be applied to transportation and electronic applications due to their superior mechanical and electrical properties. Reference Stankovich, Dikin, Dommett, Kohlhaas, Zimney, Stach, Piner, Nguyen and Ruoff2 Large-scale production methods of atomically thin films such as CVD growth and chemical exfoliation have the potential to create next generation industrially relevant materials, such as composites and stretchable transparent electrodes/electronic devices based on graphene and h-BN. Reference Kim, Zhao, Jang, Lee, Kim, Ahn, Kim, Choi and Hong11,Reference Lee, Shin, Lee, Lee, Kim, Choi and Kim51
A number of emerging applications of this class of materials depend critically on the fundamental understanding of their properties to tailor their properties to match specific needs. For instance, tribological properties are important to characterize for lubrication and wear applications in MEMS and steel mechanical components. Reference Filleter, McChesney, Bostwick, Rotenberg, Emtsev, Seyller, Horn and Bennewitz41,Reference Lee, Li, Kalb, Liu, Berger, Carpick and Hone42,Reference Nikolova, LaGrange, Reed, Stern, Browning, Campbell, Kieffer, Siwick and Rosei52 In battery technologies, thin films are used to enhance the performance of anodes and cathodes (e.g., Li ion batteries), based on the inclusion of atomically controlled film layers. Reference Meng, Yang and Sun12 Mechanical characterization will play a particularly important role in solid-state batteries that incorporate multiple thin films and interfaces of different material compositions. As more intensive research efforts are spent on making functionalized atomically thin films, extensive mechanical property characterization will become even more important, in particular due to the size effects that emerge for such confined systems as compared to their bulk counterparts.