Introduction
Establishing consistencies in mental illnesses is necessary for a better general understanding, diagnosis and treatment. The early efforts to systemize mental illness were based on common causes, or the similarity of prognoses, but these efforts were soon replaced by descriptions in terms of observable symptoms (Kihlstrom, Reference Kihlstrom, Beutler and Malik2002). Throughout the different editions and revisions of the DSM, characteristic sets of symptoms have remained the basis to categorize disorders and differentiate between them. In case of the DSM, the selection of relevant symptoms and the step from symptom sets to the classification of mental illnesses are based on expert consensus. However, even if a diagnosis is defined in terms of a required number out of a set of specific symptoms, such a definition does not imply that the underlying disorder is necessarily categorical. It is possible that the liability to develop a disorder is normally distributed, with higher values leading to an increasingly severe symptomatology (Falconer, Reference Falconer1981). Alternatively, it is possible that there are affected and unaffected groups in the population that are categorically distinct.
There is a longstanding discussion about whether the DSM categorizations, although useful for clinical assessments, reflect the true nature of disorders, or whether they constitute a simplification in the sense that disorders are in fact dimensional. Meehl (Reference Meehl1995) argued that this question should be turned into an empirical inquiry, and that observed data (e.g. symptoms or questionnaire items) should be used to investigate whether ‘the pattern of observed relationships [is] corroborative of a latent taxon or of latent dimensions or a mix of the two’. To this end, Meehl and colleagues developed a set of data-analytical procedures called ‘coherent cut kinetics’, commonly known as taxometrics. More recently, two alternative statistical methods, model-based clustering and latent variable mixture modeling (LVMM), although primarily developed in other areas of science, have also been applied to psychiatric data to investigate this question (e.g. Lenzenweger et al. Reference Lenzenweger, McLachlan and Rubin2007; Lubke et al. Reference Lubke, Muthen, Moilanen, McGough, Loo, Swanson, Yang, Taanila, Hurtig, Järvelin and Smalley2007, Reference Lubke, Hudziak, Derks, van Bijsterveldt and Boomsma2009; Bernstein et al. Reference Bernstein, Stickle, Zvolensky, Taylor, Abramowitz and Stewart2010).
The three methods have in common that the psychiatric disorder is measured with a set of symptom endorsements or questionnaire items. Taxometric procedures, model-based clustering and LVMM are different statistical approaches, and are based on assumptions that require different types of a priori knowledge about the collected data. As discussed in more detail later, taxometric procedures use covariances and therefore assume linear relationships between the items. Model-based clustering requires the user to choose a specific distribution for the items, and when fitting latent variable mixture models the user has to specify factor models as well as choose a distribution. As the performance of a method generally depends on whether its assumptions are adequate for the data, the choice of a method for a specific analysis should be guided not so much by what is common in a particular area of research but by whether the user is comfortable making the assumptions about the data that are required by the chosen method.
There is a large body of studies that apply these methods to empirical data to decide whether a disorder is dimensional or categorical and, in the case of the latter, often seek to describe the distinct categories (see, for example, Haslam et al. Reference Haslam, Holland and Kuppens2011 for a review of applications of taxometric methods; Trull & Durrett, Reference Trull and Durrett2005 for a review of various methods applied to personality disorders). The aim of the current paper was not to review these different applications to empirical data, nor to provide a thorough review of each of the three approaches separately, but to describe the complexities of the task at hand and to clarify the communalities of, and differences between, the three approaches.
Using responses on questionnaires to decide whether a disorder is dimensional or categorical is by no means trivial. The decision depends heavily on the characteristics of the questionnaire items, on the characteristics of the sample and on meeting the assumptions of the method. Because of the dependence on the data, any inference of dimensionality or taxonicity from observed data requires validation, and generalizations beyond the scope of a particular analysis are not necessarily straightforward.
In this review we aimed to clarify the impact of symptom and sample selection on the results of an analysis of dimensionality versus taxonicity, and to show how prior knowledge about the data can guide the choice of method. The paper is structured as follows. The next section covers some general methodological considerations that can influence the inference of dimensionality or taxonicity that are independent of the method used. This is followed by a section providing an overview of the essential features of (1) taxometric methods (e.g. Meehl, Reference Meehl1995, Reference Meehl2004; Waller & Meehl, Reference Waller and Meehl1998; Gordon et al. Reference Gordon, Holm-Denoma, Smith, Fink and Joiner2007; McGrath & Walters, Reference McGrath and Walters2012), (2) model-based clustering (e.g. Banfield & Raftery, Reference Banfield and Raftery1993; Fraley & Raftery, Reference Fraley and Raftery2002; Frühwirth-Schnatter, Reference Frühwirth-Schnatter2006), and (3) LVMM (e.g. Dolan & van der Maas, Reference Dolan and van der Maas1998; Muthén & Shedden, Reference Muthén and Shedden1999; Lubke & Muthén, Reference Lubke and Muthén2005; Tueller & Lubke, Reference Tueller and Lubke2010). Although not inclusive, a discussion of these three methods illustrates the complexities involved in deciding whether a psychiatric disorder is dimensional or categorical. The description of the three methods focuses specifically on those aspects and assumptions that can influence the outcome of an analysis either in favor of dimensions or in favor of categories. The comparison of the three methods is covered in the final section, which also includes a review of simulation studies. This is followed by a general discussion. More technical details are provided in the online Appendix (see Supplementary material).
Some general methodological considerations
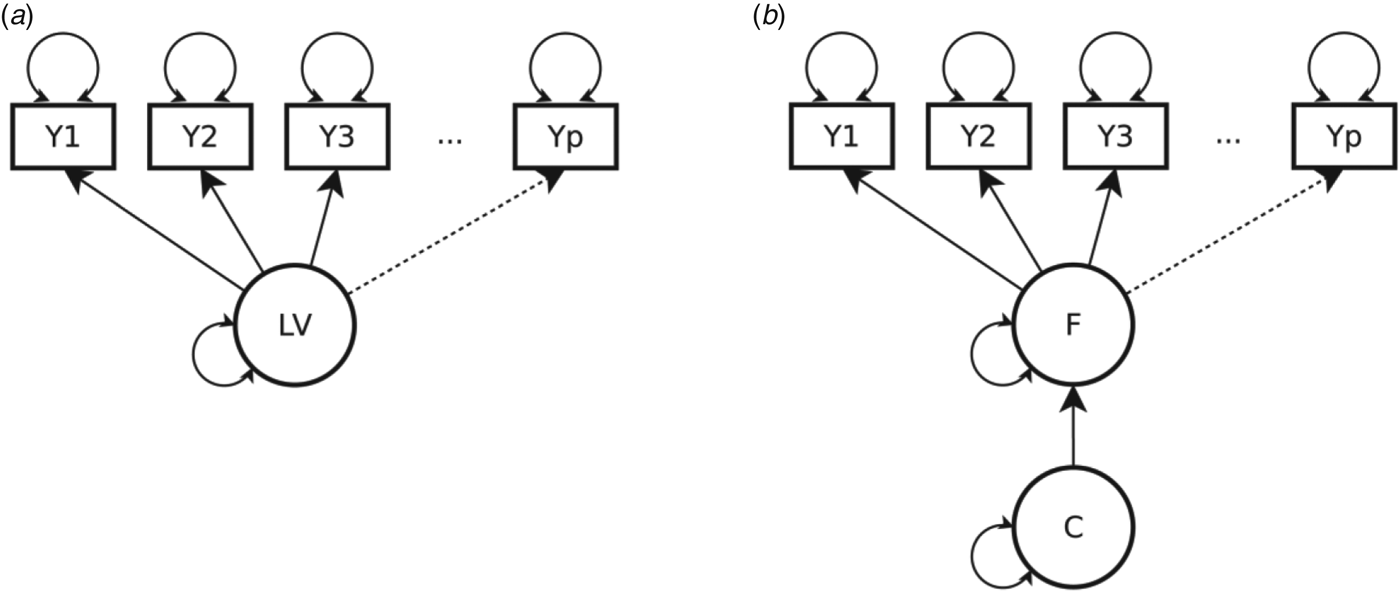
Many constructs in abnormal psychology and psychiatry, such as depression or neuroticism, are not measured directly but by means of questionnaires or symptom collections. The construct itself is unobserved, or latent (see the online Supplementary material for more detail on representing disorders as latent variables). The individuals’ scores on the latent variable are thought to predict the responses on the symptoms (see Fig. 1a). The central question is whether the latent variable is categorical (i.e. a latent class variable), or continuous (i.e. a latent factor). A latent class variable categorizes a sample into groups (e.g. affected/unaffected or subtypes), and group membership predicts how likely it is that a person will endorse a symptom. By contrast, a latent factor aligns individuals in a sample on a continuum, and the higher a person scores on the factor, the more likely they will endorse a symptom.
(a) Path diagram showing p observed variables, Y 1−Y p, and an underlying latent variable (LV), which represents the construct. The LV can be either categorical (latent class variable) or continuous (latent factor or trait). (b) Path diagram for a hybrid model with a continuous factor (F) within each latent class of the latent class variable C.

If the construct is categorical and can be represented by a latent class variable, then the observed items covary because of mean differences between the groups or classes. If the construct is continuous, then the observed items covary because of the gradual differences in the continuous latent variable. More recent LVMMs combine factors and classes, and feature continuous latent factors within the latent classes. These models therefore permit continuous differences within the distinct groups. In these models part of the covariation of observed items is attributed to the factors, and part is attributed to the latent class variable (see Fig. 1b).
The three methods discussed in this paper share this basic framework, and have in common that the nature of the latent variable is inferred from multiple observed symptoms or questionnaire items. Prior to an analysis of the latent structure and independent of which method is used, it is necessary to take into account some properties of the observed data and the sample that can influence the outcome of this inference.
Selection of symptoms or questionnaire items
It is important to consider the impact of item selection, in terms of both item content and the response scale. Already at this step, specific decisions can induce bias in favor of dimension or class detection (Gangestad & Snyder, Reference Gangestad and Snyder1985; Beauchaine & Waters, Reference Beauchaine and Waters2003).
Item content: severity
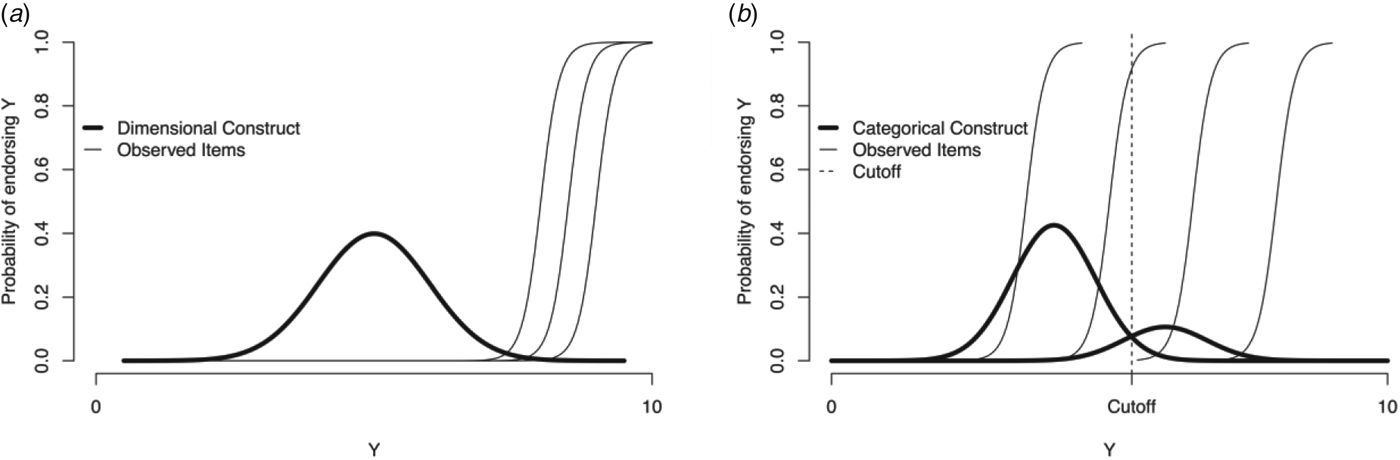
To illustrate, suppose a disorder is in fact continuous in a general population. If we select symptom indicators only at the high end of the continuum (see Fig. 2a), then the majority of subjects are likely not to endorse any of the items. As a result, these subjects are lumped into a single group, and individual differences within that group are masked. The subjects on the high end of the continuum would be most likely to endorse all items, thus also forming a group that has negligible within-group differences. The grouping of the subjects in this example would be artificially induced by the item selection, and not represent the true nature of the latent construct.
(a) The three thin lines show the probability of endorsing three severe symptoms of an underlying continuous construct (thick curve). Only individuals with very high scores on the construct have a non-zero probability of endorsing the items, and a large proportion of the population will score zero on all items. (b) The thick lines show two latent classes, a taxon and a complement. The thin lines reflect again the probability of endorsing symptoms, which are here spread over the range of the construct.

To provide an adequate basis for the desired inference it is therefore necessary to have items that differ gradually with respect to the probability of being endorsed by more affected individuals (dimensional construct). In case the construct is in fact categorical, such a set of items would not lead to biased inference. In fact, it would support the discrimination between two groups even if there are additional within-group severity differences (see Fig. 2b).
Endorsement probabilities are directly related to the item content in terms of severity: more severe symptoms are less likely to be endorsed, and it is necessary to carefully select a set of items that is adequate for the purpose of investigating the nature of the latent structure.
Response scale of the items
In addition to the item content covering the range of mild to severe symptoms, it is also necessary to consider the response scale of the observed items. As an example, consider attention problems in the general population. Hay et al. (Reference Hay, Bennett, Levy, Sergeant and Swanson2007) compared the Australian Twin Behavior Rating Scale (ATBRS) and the Strength and Weaknesses of ADHD-Symptoms and Normal Behavior (SWAN) scale. The response format of the ATBRS items ranges from ‘never’ to ‘very often’, and resulted in observed skewed data in the Hay et al. study. The format of the SWAN items is designed to cover gradual difference both above and below average, and ranges from ‘far above average’ to ‘far below average’, and resulted in more normally distributed observed data. If the ATBRS and the SWAN data would be used for an analysis of the nature of the latent structure, then the results could be very different because the ATBRS neglects the gradual differences at the lower end of the normal distribution that are detected with the SWAN (Hay et al. Reference Hay, Bennett, Levy, Sergeant and Swanson2007). If the response format of the observed items does not tap into the gradual differences of scale, then we cannot expect that the latent construct that is inferred from the observed measurements will reflect such differences.
Sample selection
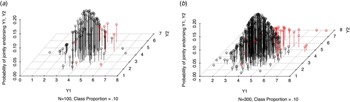
Several aspects of the sample selection can have an impact on the desired inference. As might be expected, sample size is directly related to the statistical power to detect subgroups within the population (Lubke & Neale, Reference Lubke and Neale2006, Reference Lubke and Neale2008). Larger samples provide a smoother approximation of the population than smaller samples, and sampling fluctuation (i.e. the variability if multiple samples were drawn) has less impact. Sampling fluctuation in smaller samples can lead to erroneous decisions in favor of categories or dimensions. Figure 3 shows two draws from the same two-cluster distribution. Figure 3a has a sample size of n=100, which can look like a single cluster (the red dots are subjects of the second cluster but are not really distinguishable from the black dots). Figure 3b shows a draw from the same distribution but now with n=300, which provides a clearer picture. Fitting a mixture model to data in Fig. 3b permits two classes to be distinguished. In addition to sample size, it is necessary to consider how the sample is drawn. Any oversampling of subgroups that exists within the population will increase the probability of detecting those subgroups in a sample, and oversampling the tails of a continuum can create artificial groups. Finally, the results of a latent structure analysis are not necessarily generalizable to different populations. For instance, an analysis carried out on a sample from a clinical population can provide a more fine-grained focus on differences between affected individuals compared to analyses of samples drawn from the general population. Similarly, results might differ across, for example, age, gender or ethnicity.
(a) A smaller sample from a truly categorical construct consisting of a complement (black) and a taxon (red) might not suffice to detect taxonicity. There are too few red dots belonging to the taxon to clearly show a separate cluster. (b) In a larger sample, the power is more likely to be sufficient to detect the taxon.

In sum, item and sample selection can induce circularity in the sense that a particular selection can bias the results of a latent structure analysis in favor of dimensionality or in favor of categories depending on the specific selection. This implies that the results of any analysis of dimensionality versus taxonicity need to be contextualized in terms of item selection, sample size and the population from which the sample was drawn.
Three methods to decide between latent dimensionality and latent categories
The three methods share the same point of departure, namely that if the disorder is categorical, then each group has its own distribution (e.g. group-specific means or endorsement profiles, group-specific variances and covariance between symptoms). Meehl's taxometrics limit the number of groups to two, a taxon and a complement group, and do not require many other assumptions to be met. Model-based clustering and LVMM can handle multiple groups but necessitate the choice of a specific distribution for the observed symptoms or items (e.g. multivariate normal distribution). For model-based clustering it is not necessary to specify how exactly the symptoms are related to the underlying disorder but for mixture modeling this is necessary.
Meehl's taxometric procedures
The objective of Meehl's procedures was to address the question of continuous versus categorical constructs in an empirical, hypothesis-based manner (e.g. Meehl, Reference Meehl1965, Reference Meehl1992).
MAMBAC (mean above minus mean below a cut; Meehl & Yonce, Reference Meehl and Yonce1994), MAXCOV-HITMAX (Meehl, Reference Meehl1995; Meehl & Yonce, Reference Meehl and Yonce1996) and MAXEIG (Waller & Meehl, Reference Waller and Meehl1998) are three popular procedures. Other taxometric procedures such as L-mode (Waller & Meehl, Reference Waller and Meehl1998) and MAXSLOPE (Grove, Reference Grove2004) are somewhat less popular. As the general structures of the procedures are similar, MAXCOV is explained in more detail, and details concerning MAMBAC and MAXEIG are given in the online Supplementary material.
The basic structure consists of first deriving theoretical expectations from premises, and then checking these expectations against observed data. Specifically, the procedures evaluate whether the summary statistics of the observed items (means, covariances or eigenvalues, depending on the procedure) behave according to the expectations regarding these statistics under the hypothesis of taxonicity, or according to the expectations under the hypothesis of dimensionality. The term ‘coherent cut kinetics’ (Meehl, Reference Meehl1995) refers to the fact that the behavior of the summary statistics is evaluated for different partitions or ‘cuts’ of one of the observed items.
The different procedures derive expectations from the same premises. In case of taxonicity the premise consists of two parts: (1) the population consists of two subpopulations, a taxon and a complement group, and (2) the covariance between any two observed symptoms in the joint population is entirely due to mean differences between the taxon and complement groups. Equivalently, the covariance within each of the two groups is zero. In case of dimensionality, the premise again consists of two parts: (1) the population consists of one homogeneous group, and (2) the covariance between any two observed items is due to an underlying dimensional construct.
The expectation concerning the pattern of covariances differs depending on the premise. Consider MAXCOV-HITMAX. The procedure uses three continuous items, X, Y and Z. One of the variables, say X, is used to partition the sample into two groups. The focus is on the covariance between Y and Z in the group below the cut point on X. If the premise regarding taxonicity is true, then the expectation is that the covariance between Y and Z is near zero if the cut point on X optimally divides the sample into taxon (=high on X) and complement members (=lower on X). Sliding the cut point along the range of X will produce an increasing and then a decreasing covariance between Y and Z because within the taxon and within the complement groups the covariance is assumed to be negligible, but when the partition includes members of both groups then the covariance will be larger than zero. However, if the premise regarding dimensionality is true, no substantial change in covariance of Y and Z is expected when moving the cut point along the range of X. Graphical inspection of plotting the covariance as a function of splitting on X is used to support a decision in favor of either dimensionality or taxonicity.
The procedures are limited to two latent classes, a taxon and a complement class. Furthermore, the procedures rely on covariances, that is they assume that the observed items are linearly associated. The procedures necessitate continuous observed indicators of the disorder to obtain the multiple partitions. Although extensions to yes/no symptoms have been proposed, these have been criticized (Maraun et al. Reference Maraun, Slaney and Goddyn2003). Researchers are encouraged to apply the methods using each of the observed items once as the X variable for the repeated partitioning of the sample to check consistency. In case of large questionnaires it can be somewhat cumbersome to inspect the resulting large number of graphs. The procedures permit the calculation of class proportions and post-hoc computation of the means and variances in the taxon and the complement groups, along with post-hoc assignment of subjects to one of the two groups.
As explained, the different procedures share the same premises regarding taxonicity and dimensionality, and the expectations of the different taxometric procedures are derived as straightforward consequences. Note that if a premise is true, then the consequences are expected to be observable. The different procedures are therefore not independent and cannot provide cumulative evidence. The procedures differ with respect to statistical power possibly because different summary statistics are evaluated, and have been reported to be differentially sensitive to the selection of cut points and other procedural choices, in addition to the characteristics of the data (Walters & Ruscio, Reference Walters and Ruscio2010). Ruscio (Reference Ruscio2012) has provided an implementation in R.
Model-based clustering
This is a clustering approach based on a probability model. The key idea is to fit alternative models to the data and select the best-fitting model using indices of model fit. The question of taxonicity can be decided by comparing single cluster and multiple cluster models.
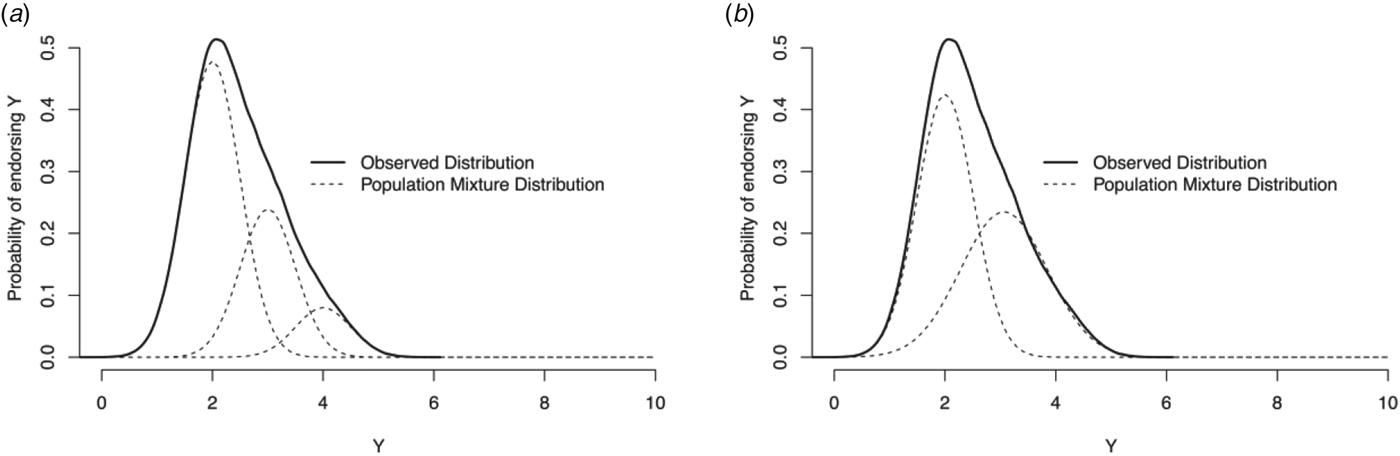
The starting point is that the observed data have a multivariate distribution, and that if there are multiple groups or clusters in a sample, then each group has its own distribution with group-specific means and covariance matrices. The joint distribution is called a mixture distribution. It is important to note that mixture distributions are used not only to model clusters in a population but also to approximate distributions that do not have a known functional form (e.g. skewed distributions) (Titterington et al. Reference Titterington, Smith and Makov1985). This is illustrated in Fig. 4, which shows that the same observed skewed distribution can be due to either a mixture of three components with equal variance or two components with unequal variance. The mixture components do not necessarily have to correspond to meaningful clusters of subjects in a population. It is for the researcher to decide whether the clusters are meaningful; for instance, whether subjects in the tail of the skewed distribution in Fig. 4 should be considered as a meaningful distinct group. When selecting a model with multiple clusters as the best-fitting model, it is therefore necessary to check whether the cluster structure is consistent with previous findings, or validate the classes for instance in a replication sample.
(a) A skewed observed distribution (thick line) resulting from a population mixture distribution (dashed lines) consisting of three classes with equal variance. (b) The same skewed observed distribution can be due to a mixture with two components that have unequal variance.

In model-based clustering the mixture component distributions are most commonly assumed to be multivariate normal, with component-specific mean vectors and covariance matrices, although other mixture distributions can also be used within this framework (Banfield & Raftery, Reference Banfield and Raftery1993). Focusing on the case of multivariate normal mixtures, the parameters of the model are the within-cluster mean vectors and covariance matrices. Consider plotting two variables X and Y. The group means determine where on the X and Y axes the data cloud (or scatter) is located, and the covariance between X and Y determines the orientation, shape and volume of the cloud. Extending this to more than two variables, the group-specific means determine the location of each of the clusters, and the covariance matrices contain the information concerning the orientation, shape and volume of the data cloud for each cluster.
The framework offers great flexibility for comparing alternative models that differ with respect to whether volume, shape and/or orientation are cluster invariant or cluster specific, and with respect to the number of clusters (Fraley et al. Reference Fraley, Raftery, Murphy and Scrucca2012). Technical details of model-based clustering can be found in the online Supplementary material. The models are not limited to two clusters. The best-fitting model can be selected using, for instance, the Bayesian information criterion (BIC). If a model with a single cluster fits best, then the hypothesis of taxonicity is rejected.
To summarize, model-based clustering is based on the assumptions that (1) each component distribution corresponds to a cluster in the population, and (2) model comparisons result in selecting an adequate model for the data. The selected model provides a detailed description of each cluster in terms of how the data are distributed and permits post-hoc assignment of subjects to clusters using Bayes’ formula.
Fraley & Raftery (Reference Fraley and Raftery2002) mention the possibility of modeling the within-cluster covariance matrices more parsimoniously, for instance using a single-factor model. LVMM is a general framework that provides the flexibility to specify structural equation models within each class.
LVMM
LVMM is similar to model-based clustering in that the user has to choose a distribution for the data. Other mixture distributions in addition to the multivariate normal can be chosen to account for the type of data (e.g. mixtures of Poisson distributions for count data such as number of cigarettes per day). LVMM is a combination of structural equation modeling and latent class analysis. For technical details concerning LVMMs, the reader is referred to the online Supplementary material.
The general model framework permits fitting models with a specific factor structure that relates the observed items or symptoms to the underlying disorder within each of the different latent classes. It is also possible to constrain the number of classes to 1, resulting in a factor model for a single homogeneous population. This would correspond to a dimensional disorder. Alternatively, all covariances within a class can be constrained to be zero, resulting in the latent class model. Most importantly, specifying a factor model within each class permits severity differences within class, and therefore represents a hybrid between taxonicity and dimensionality.
Using LVMMs to distinguish between latent dimensions and categories requires great care when specifying the within-class factor structure. Specifying, for instance, the factor variances to be class specific versus class invariant can have a great impact on the number of classes of the best-fitting model (see Fig. 4; three components with equal variance or two components with unequal variance result in the same observed distribution).
As in the case of model-based clustering, models can be estimated using the Expectation-Maximization (EM) algorithm, which is implemented in software for mixture models such as Mplus (Muthén & Muthén, Reference Muthén and Muthén2012). Models can be compared using the BIC or bootstrapped likelihood ratio tests (Nylund et al. Reference Nylund, Asparouhov and Muthén2007). After the model has been estimated, individuals can be assigned to one of the classes based on their highest posterior class membership (Titterington et al. Reference Titterington, Smith and Makov1985; McLachlan & Peel, Reference McLachlan and Peel2004).
Comparison of the three methods
Summary of assumptions
Taxometrics, model-based clustering and LVMM differ with respect to their assumptions and to the type of a priori knowledge about the data that is required. Taxometrics rely on linear associations (i.e. covariances) between the observed variables and also zero covariances within clusters. Mild deviations from the assumption of zero within-cluster covariances have been reported to be unproblematic although explicit modeling of the within-cluster covariance structure can lead to superior power to detect taxonicity (Meehl, Reference Meehl1999; Ruscio & Ruscio, Reference Ruscio and Ruscio2002; Lubke & Tueller, Reference Lubke and Tueller2010; McGrath & Walters, Reference McGrath and Walters2012). Taxometrics aim at deciding between dimensionality on the one hand and a two-cluster solution (taxon and complement) on the other. The decisions are mainly based on graphical inspection, although quantitative measures have been proposed (Ruscio et al. Reference Ruscio, Ruscio and Meron2007).
Model-based clustering and LVMM require a choice of a multivariate distribution for the observed symptoms within each cluster. Single class models correspond to dimensionality, and multiple class models indicate taxonicity. The key assumption in both methods is that the component distributions correspond to meaningful clusters. The methods permit modeling continuous data and also binary (yes/no) or ordinal observed data (Likert scales). In model-based clustering the user can compare models that allow differences between clusters regarding shape, volume and orientation, or constrain any of the related parameters to be equal across clusters. Some of the possible parameterizations result in models that are equivalent with certain LVMMs (i.e. latent class models).
Fitting LVMMs requires the specification of all relationships between the observed variables within a class, for instance that the covariation of items within a class is due to an underlying factor. Furthermore, the user has to specify whether the related parameters are class specific or class invariant. This leads to an extremely large number of possible models. Although multiple different models can be fitted to the data, the user has to limit the number of models a priori to a reasonably small number of models to minimize multiple testing. This selection requires additional a priori knowledge about the data. If such knowledge is available and integrated in a fitted model, the power to detect the correct cluster structure is improved (Lubke & Neale, Reference Lubke and Neale2006; Tueller & Lubke, Reference Tueller and Lubke2010). Model misspecifications such as incorrectly specifying that the covariances within a class are zero can lead to accepting too many classes (Lubke & Neale, Reference Lubke and Neale2006). In both model-based clustering and LVMM the model selection can be based on the BIC or bootstrapped likelihood ratio tests. If a single class model with a continuous latent variable representing the construct fits best, then the hypothesis of taxonicity can be rejected.
Methods to assign individuals to latent classes, or taxon and complement, have been described for all three approaches (Meehl, Reference Meehl1995; Dolan & van der Maas, Reference Dolan and van der Maas1998; Walters & Ruscio, Reference Walters and Ruscio2010; Fraley et al. Reference Fraley, Raftery, Murphy and Scrucca2012). In taxometrics, subjects can be assigned based on a cut-off on the variable chosen as the X variable, usually the hitmax point. Model-based clustering and LVMM estimations result in probabilities for each individual of belonging to each of the latent classes. The highest of these probabilities can be used to assign an individual to a class. Note that assigned class membership should not be used without caution in subsequent analysis. As pointed out by Vermunt (Reference Vermunt2010; see also Asparouhov & Muthén, Reference Asparouhov and Muthén2013), to obtain adequate standard errors in subsequent analyses it is necessary to take into account the uncertainty of assigning subjects to classes. Naively using class assignments in subsequent regression analyses or tests of mean differences will result in standard errors that are too small, and therefore an inflation of statistical significance (Vermunt, Reference Vermunt2010).
Comparisons with simulated data
Comparisons of methods with simulated data are very useful for quantifying a difference in power. Several simulation studies have been published that evaluate the performance of methods designed to distinguish between latent categories and latent dimensions (Cleland et al. Reference Cleland, Rothschild and Haslam2000; Lubke & Tueller, Reference Lubke and Tueller2010; McGrath & Walters, Reference McGrath and Walters2012). Unfortunately, the terminology used to describe the methods is not uniform. For instance, the term ‘finite mixture modeling’ has been used for model-based clustering and also for LVMM, and the terms ‘latent variable mixture modeling’ and ‘mixture modeling’ have been used to refer exclusively to latent class analysis. However, the latent class analysis model is a very constrained submodel within the more general LVMM framework that does not leverage the advantage of more complex LVMMs to model the factor structure within a class. The latter permits accounting for severity differences within a class. In addition to the ambivalent labeling of methods, the simulation studies differ greatly with respect to the data generation. As described earlier, characteristics of the data have a direct impact on the inference regarding categories and dimensions. To evaluate simulation study results it is therefore crucial to take into account the type of data-generating model, and the type of method or model that was used to analyze the simulated data.
To compare any two or all three of the described methods it would be ideal to generate data sets with increasing deviations from each method's assumptions while keeping sample and effect sizes constant (i.e. deviations from linear association, zero within-cluster covariance and multivariate normality, along with model misspecifications of LVMMs). The different methods can then be applied to the generated data, permitting a structured comparison.
The performance of taxometric procedures and LVMMs has been evaluated separately under different conditions (Meehl, Reference Meehl1995, Reference Meehl1999; Cleland & Haslam, Reference Cleland and Haslam1996; Haslam & Cleland, Reference Haslam and Cleland1996, Reference Haslam and Cleland2002; Lubke & Neale, Reference Lubke and Neale2006, Reference Lubke and Neale2008; Walters et al. Reference Walters, McGrath and Knight2010), but direct comparisons of the methods are sparse. The few published comparisons are usually limited to latent class analysis models. Some studies do not include a correct model representing dimensionality in the model comparisons, and are therefore not useful to decide whether a method can distinguish between dimensionality and taxonicity (Cleland et al. Reference Cleland, Rothschild and Haslam2000; McGrath & Walters, Reference McGrath and Walters2012). The study by Lubke & Tueller (Reference Lubke and Tueller2010) includes more complex LVMMs but only covers MAXEIG, and does not evaluate misspecifications of the LVMM. However, taken together, the simulation studies seem to support the common sense intuition that if there is a priori knowledge about the covariance structure of the data, then integration of this knowledge in a mixture model can improve the power to distinguish latent classes. Furthermore, increasing misspecification of LVMMs can be expected to result in a deterioration of performance, as do violations of assumptions of taxometric procedures or deviations from assumed distributions in model-based clustering and LVMM (Lubke & Neale, Reference Lubke and Neale2008; Ruscio & Kaczetow, Reference Ruscio and Kaczetow2009; Lubke & Tueller, Reference Lubke and Tueller2010). Most simulations agree on the main factors that lead to deterioration of performance, irrespective of the specific method used. Not surprisingly, these are effect size (i.e. distance between clusters) and sample size in the smallest cluster. The response format of the items (continuous works better than binary), the reliability of the observed items (higher is better) and the complexity of the within-class model (simpler models require less parameters to be estimated) can also affect the power to discriminate between classes (Nylund et al. Reference Nylund, Asparouhov and Muthén2007; Lubke & Tueller, Reference Lubke and Tueller2010; Tueller & Lubke, Reference Tueller and Lubke2010).
Discussion
The question of whether disorders are best described by underlying dimensions or by categorically distinct groups can be addressed by a statistical analysis of observed data of symptoms or questionnaire items. There are different methods that can be used for this purpose, and the three most commonly used approaches differ considerably with respect to their assumptions. The assumptions translate directly to the knowledge about the data that is required for a proper application of a given method. The main conclusion of this review is that the choice of method should match the required knowledge, and that it is advantageous to choose a method that permits integration of the existing knowledge in the analysis. Importantly, conclusions drawn from a particular analysis depend on the type of sample and the observed items, and should therefore be contextualized appropriately.
Distinguishing between dimensions and categories is often not the sole purpose of a study. Class-specific parameters, between-class differences, class proportions or the assignment of individuals to classes are usually of great interest. There is a clear relationship between the assumptions that are acceptable and the level of information that can be gained from an analysis. If prior research provides information on how to specify a structural equation model within each class, then the payoff in terms of information gained from an LVMM analysis can be substantial. Parameter estimates of the within-class factor structure, factor means and variances, class proportions and covariate effects directly result from fitting a model to the data. Taxometric procedures, which can be appropriate in case of more limited knowledge about the data, are also more limited regarding their output. The taxon and complement proportions are deducted from the average hitmax of the different plots, and means and variances of observed variables within taxon and complement have to be computed post hoc by a hard partition of the sample at hitmax (Meehl, Reference Meehl1995).
Heterogeneity can be a major factor impacting power in, for instance, genetic analyses (McCarthy et al. Reference McCarthy, Abecasis, Cardon, Goldstein, Little, Ioannidis and Hirschhorn2008; Manchia et al. Reference Manchia, Cullis, Turecki, Rouleau, Uher and Alda2013). If the objective is to rule out potential heterogeneity prior to other analyses, then taxometrics or model-based clustering may be considered because all inter-relationships between the observed items do not have to be specified. If the results do not indicate heterogeneity, we can proceed with analyses for single homogeneous populations. Conversely, if heterogeneity is substantial, then subsequent analyses are likely to benefit from methods that take this heterogeneity into account. Detecting heterogeneity is therefore an important step in many studies, and the choice of method can be optimized by carefully considering its assumptions.
Supplementary material
For supplementary material accompanying this paper, please visit http://dx.doi.org/10.1017/S003329171400169X.
Acknowledgments
G. H. Lubke received funding for this study from the National Institutes of Health (NIH) R37DA018673 (PI M. Neale) and P. J. Miller is in receipt of a National Science Foundation (NSF) Graduate Research Fellowship.
Declaration of Interest
None.