1. Introduction
Concern about global climate change has spread beyond the scientific community to the public at large. In response to this concern, governments around the world are considering additional measures to reduce greenhouse gasses, both in concert and individually. The 1997 Kyoto Protocol represents the culmination of these concerns. The agreement became binding in 2005 and calls for higher-income developed countries to reduce greenhouse gas emissions by 5.2 per cent relative to 1990 levels. The Protocol is a part of the United Nations Framework Convention on Climate Change and has been ratified by 187 countries, but not the United States.
Yet, lingering questions remain about the effectiveness of measures undertaken to reduce these emissions, especially carbon, and how the distribution of greenhouse gas reductions might be shared among the world's countries.Footnote 1 In the light of these questions and the coming expiration of the first phase of the Kyoto Protocol in 2012, negotiations have continued with the Copenhagen Summit in December 2009, and further negotiations are scheduled in Mexico City for the end of 2010.
Environmental Kuznets curves (EKCs) offer one analytical tool for addressing these questions. EKCs emerged in 1991 when Eugene Grossman and Alan Krueger produced a path-breaking working paper that reported a strong statistical relationship between important measures of environmental quality and income for a cross-section of countries (Grossman and Krueger, Reference Grossman and Krueger1991, Reference Grossman and Krueger1995). Some of Grossman and Krueger's EKCs were shaped like an inverted U, a quadratic form that mapped income and pollution concentration for a sample of countries. These quadratic results, now replicated many times for some pollutants, but surely not applicable to all things that might be called pollutants, indicate that it is possible for countries simultaneously to enjoy higher income and improved environmental quality. Since the original Grossman–Krueger report, a multitude of EKC studies have been published and scores of them reviewed (Yandle et al., Reference Yandle, Bhattarai and Vijayaraghavan2004).Footnote 2
Economic logic and common sense tell us that countries’ political bodies will somehow set priorities for environmental improvement based on rents generated or costs avoided for their people. Along these lines, empirical work shows that nations take actions to improve water quality and reduce water-borne diseases before actions are taken to reduce air oxide emissions. The cost of bad water, as measured by levels of dissolved oxygen, is apparently recognized sooner and seen to be more important for costly action than the more remote morbidity associated with sulfur dioxide (SO2) and nitrogen oxide (NO) emissions (Yandle et al., Reference Yandle, Bhattarai and Vijayaraghavan2004: 11, 13).
When the expected benefits of pollution control become more dispersed across time and space, free riding tends to prevail. Recent efforts to control carbon dioxide (CO2) emissions are perhaps one of the most challenging situations of all. Through political and private action, some countries are attempting to reduce carbon emissions or slow their rate of growth. Laws to reduce carbon emissions are passed in some quarters, and corporations and individuals voluntarily engage in actions designed to reduce such emissions in others (Yandle, Reference Yandle2008). Yet while some countries espouse concern and take costly action in the name of countering climate change, other countries just as enthusiastically avoid such actions. In short, there is significant variation in the behavior and rhetoric regarding carbon emission reductions across countries. The observed behavior may be about free riding, the relative costs of meeting carbon reduction goals, and rent-seeking efforts among competing parties to raise rivals’ costs (Yandle, Reference Yandle1999; Yandle and Buck, Reference Yandle and Buck2002). This variation in political behavior provides a natural public choice laboratory.
We believe estimates of EKCs provide a simple device for explaining the likely pathway of countries’ (and global) carbon emissions. Put differently, we propose that per capita income, somehow measured, is the critical factor. Nonetheless, we believe EKCs can tell us more. In particular, we believe that estimates of the efficiency with which a country avoids carbon emissions can shed light on that country's position in international negotiations to reduce carbon emissions. These insights help to reveal whether Kyoto's greenhouse gas reduction goals are likely to be met, and how individual countries are likely to respond to proposals to further reduce emissions.
In the following section, we examine the relationship between carbon emissions and income seen in the light of theory, prior studies, and our own estimates. In the third section, we explore estimates of countries’ carbon emission efficiency, and then use these estimates to explain the differing positions in carbon reduction debates among the G8 + 5 countries.Footnote 3 We offer summary thoughts on the future of carbon emissions and their distribution among the world's major emitters in the conclusion.
2. Environmental Kuznets curves and carbon emissions
The Kyoto Protocol, originally negotiated in December 1997, set a collective goal of a 5.2 per cent reduction in greenhouse gas emissions for industrialized countries by 2012, using 1990 as a benchmark.Footnote 4 The treaty went into effect in February 2005 when countries accounting for 55 per cent of global carbon emissions had ratified the treaty. The G8 + 5 countries agreed at this time to continue negotiations to further cap global carbon emissions. To assess the likely success of the Kyoto Protocol and subsequent negotiations, we turn to theory and evidence from the EKCs.
2.1. A brief review of environmental Kuznets curves and carbon emissions
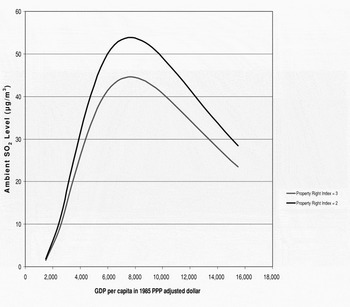
We begin with figure 1 showing a sample EKC that was estimated for SO2 emissions based on a panel of 14 countries with 6 annual observations for each country (Qin, Reference Qin1998). The neat inverted U-shaped curve shows that air pollution in the form of concentrated SO2 increases as per capita GDP rises from very low to intermediate levels, after which a point is reached where SO2 concentration diminishes with further per capita GDP improvements. Other factors may shift the EKC. For example, when Qin included the Knack and Keefer (Reference Knack and Keefer1995) property rights enforcement index (which ranges from 1 to 4 in a weak-to-strong setting) in his estimate, the EKC shifted downward for those countries with stricter property rights enforcement.Footnote 5 But control of SO2 emissions, which make contact with human populations, turns out to be a simpler public choice problem than control of carbon emissions, which ultimately head to the heavens.
An EKC for sulfur dioxide emissions.

The Kyoto Protocol and related efforts to bring about commitments among higher-income nations to binding carbon emission reduction goals have generated a long and contentious process. Kyoto is a global enterprise. Climate change is slow, and the benefits that accrue from one community's reductions are so widely dispersed that the effects cannot easily be recognized by the parties that bear the cost of control. And until recently, there has been limited EKC guidance as to how income levels and growth might encourage or discourage the prospects for CO2 emission reductions or explain positions taken for or against carbon reduction goals.
In our review of the EKC literature on carbon emissions, we note that Qin's investigation of carbon emissions revealed a linear relationship between the level of carbon emissions and per capita GDP. Higher levels of carbon emissions were systematically associated with higher levels of GDP. There was no evidence of a turning point. On the other hand, Cole et al. (Reference Cole, Rayner and Bates1997), Hil and Magnani (Reference Hil and Magnani2002), and Cole (Reference Cole2003) found inverted U-shaped carbon emission relationships. Of particular importance to our work, Cole (Reference Cole2003) acknowledged empirical work that finds N-shaped EKC relationships, in which rising income initially deteriorates environmental quality and then improves it – the standard EKC result – but then with additional income, environmental quality deteriorates again. Canas et al. (Reference Canas, Ferrao and Conceicao2003) found just such a relationship when analyzing the usage of direct material inputs.
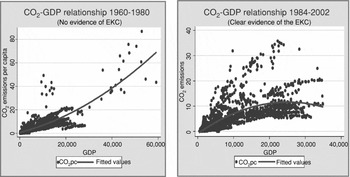
Recent work reported by Dutt (Reference Dutt2008) provides more evidence that higher-income countries are taking actions that reduce carbon emissions. Dutt examined the relationship between income levels and tons of carbon emitted annually per capita for a panel of 124 countries which account for more than 90 per cent of anthropomorphic CO2 emissions.Footnote 6 She uncovered important findings when she provided separate estimates for the years 1960–1980 and then for the years 1984–2002. We report her findings in figure 2.Footnote 7 Obviously, something striking appears to have occurred across the countries Dutt examined. Carbon emissions per capita reach an apparent turning point in the second panel. The race to the bottom appears to become a race to the top. The turning point is a per capita GPD of $29,600 in 2000 dollars, which is relatively high.
Dutt's work on carbon emissions.

These results may be interpreted to imply that some high-income countries have reached a turning point without the Kyoto Protocol being embraced systematically by all high-income countries. The inference is that countries that have effected change in the second time period, perhaps in pursuit of greater energy efficiency, now find reductions in greenhouse gas emissions sufficiently beneficial to afford the cost of reducing those emissions, while other nations have yet to reach the turning point. Yet countries, rich and poor, complain that carbon reduction is costly. Among the G8 + 5 countries only three, Germany, Russia, and the UK, have reduced their carbon emissions since 1990, and Russia's reduction is surely the result of economic collapse in the 1990s. Further, apart from Russia, only Germany has reached its Kyoto Protocol goal. While 2012, the termination point of the Kyoto agreement, is eight years beyond the most recent year for which we have data, 2004 is seven years beyond the conclusion of the 1997 Kyoto negotiations. These facts suggest that the analysis of carbon emissions is a complex enterprise.
2.2. An alternate theory
In 1999, Goklany (Reference Goklany1999) published a detailed empirical examination of US air pollution that mapped together data from the 1900s to the then current period. Goklany's assessment of the data led him to conclude that Americans systematically took action to reduce air pollution long before the 1970s when the federal government assumed legislative control of air quality protection. Goklany translated his empirical findings into an EKC theory of public choice.
The theory can be described as assuming a population of people who confront gradually deteriorating air quality with respect to a particular pollutant. When the population discovers the linkages that connect environmental use to human costs, they somehow weigh the costs and benefits of taking action, and if there are perceived net benefits, the community organizes action to reduce the level of pollution. Goklany refers to this first recognition as the ‘period of perception’. It is during this period that different property rights arrangements and other regulatory institutions are devised for managing environmental assets. The period of perception corresponds to that portion of a quadratic EKC where pollution concentration may be still rising but at a decreasing rate with respect to community income.
Once effective protection of environmental quality is in place and the linkages between environmental use and cost are better understood, the community takes action to reduce the total level of pollution that reaches the environment. This ‘period of transition’ is the well-known EKC turning point. Of course, Goklany recognizes that pollution control is costly and can more readily be achieved when community incomes are rising.
Perception and transition are not the end of Goklany's story. His empirical study leads him to conclude that in setting environmental goals during the transition period, communities cannot know how costly it will be to achieve those goals. An example of this might be seen in the 1972 Federal Water Pollution Control Act that called for zero discharge by 1984. The goal was admirable, but technically and economically unachievable. In other words, rhetoric overshoots reality and the cost of the overshooting, which may rise rapidly at the margin, cannot be recognized until those costs are actually incurred. These rising costs, often combined with the technical limits of clean technologies and changes in public opinion regarding the relative importance of environmental versus other goals, lead Goklany to a third phase in his story when the community modifies goals and allows pollution, now at a reduced level, to increase at the margin (Goklany, Reference Goklany1999: 95–97). This third phase adds a rising tail to the typically drawn EKC giving the EKC a cubic form. The logic is consistent with the work of Cole (Reference Cole2003) and Canas et al. (Reference Canas, Ferrao and Conceicao2003). We propose that further investigation of the relation between income and carbon emissions is warranted.
2.3. Time series evidence from the G8 +5 countries
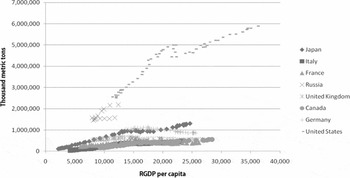
We note that the earlier empirical work we have cited was generally based on cross-sectional panel data and often involved different specifications and modeling assumptions. To determine which form, linear, squared, or cubic, best relates carbon emissions and income, we examined time series data on carbon emissions, in total and per capita terms, for the G8 +5 countries.Footnote 8 Scatter plots are revealing. As shown in figure 3, the United States is clearly the largest emitter of CO2 among the G8 countries, and the rate of increase for the United States also dwarfs that of the other G8 countries.
Total CO2 emissions, G8 countries, 1950–2004.

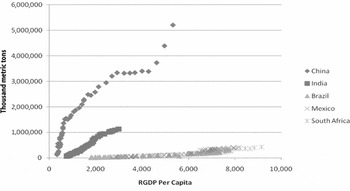
As shown in figure 4, what the United States is to the developed world, China is to the developing world.Footnote 9 China's level of carbon emissions and rate of increase are far greater than those of any other developing country, despite having a per capita income just over half that of Brazil, Mexico, and South Africa. India follows as the second largest carbon emitter, while Brazil, Mexico, and South Africa are clustered at much lower emission levels.
Total CO2 emissions, five main developing countries, 1950–2004.

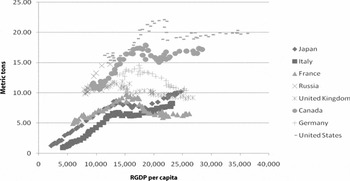
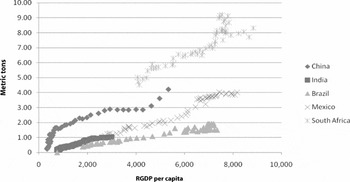
When we turn to per capita emissions, we observe much greater dispersion of emissions. For the G8 countries shown in figure 5, the United States remains the biggest emitter of CO2, but Canada and, to a lesser extent, Russia, stand out as large emitters, while France and Italy are notable for their low emission levels.Footnote 10 For the developing five, figure 6 reveals that South Africa is clearly the largest emitter, in part because of activities that generate its higher income.
Per capita CO2 emissions, G8 countries, 1950–2004.

Per capita CO2 emissions, five main developing countries, 1950–2004.

China and Mexico follow, while India and Brazil produce the least. These data provide insight not only on the levels of CO2 emissions by the G8 +5 countries, but also indicate the pattern of emissions. Dutt provides strong evidence for an EKC for carbon emissions. If her findings are robust, concern over greenhouse gas emissions and global warming may be overstated: developed countries are already reducing carbon emissions and developing countries are sure to follow once their incomes grow. However, Goklany (Reference Goklany1999) has posited that downward trends in carbon emissions may be short lived as countries begin to experience the (rising) cost of carbon reductions.
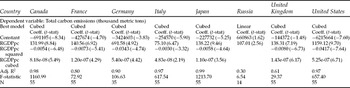
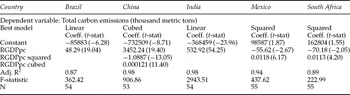
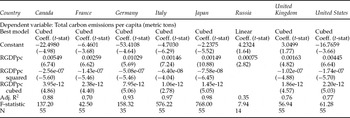
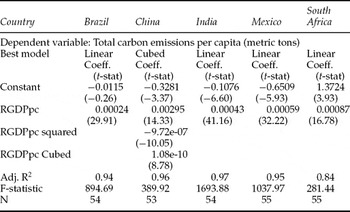
To determine which hypothesis is sustained, we estimated regressions of CO2 emission on per capita Real GDP (RGDP) for each of the G8 +5 countries from 1950 through 2004. To accommodate the possibility of different functional forms, we estimated linear, squared, and cubed equations and then examined the statistical significance of added terms to determine the best statistical fit. These results are presented in tables 1–4. As shown in table 1 for the G8 countries, estimates of total CO2 emissions are best fit by the cubed functional form for each of the countries except Russia, which is best estimated with a linear form.Footnote 11 Each of the estimated coefficients, including the coefficient for the cube of per capita RGDP, is highly significant. For each country, a clear pattern exists: as per capita RGDP rises, CO2 emissions also rise, until an income level at which they fall or rise more slowly, after which they begin to rise again. The pattern for the developing countries is much less consistent as shown in table 2. Only China displays the clear positive–negative–positive coefficient pattern characteristic of the developed countries. For Brazil and India, a linear fit is best, while for Mexico and South Africa, a squared pattern is best.Footnote 12
Estimates of total carbon emissions for G8 countries

Estimates of total carbon emissions for five main developing countries

Estimates of per capita carbon emissions for G8 countries

Estimates of per capita carbon emissions for five main developing countries

Turning to the regressions for per capita CO2 emissions, shown in table 3, we again find strong support for Goklany's hypothesis among the G8 countries. With the exception of Russia, each G8 country is best fit by a cubed model. For the developing five, shown in table 4, once again, only China exhibits the strong cubed relationship. The remaining developing countries are best fit by linear models.Footnote 13
These results, taken as a whole, provide strong support for Goklany's hypothesis, at least for the developed G8 countries and China, which are the world's largest carbon emitters. For the other four developing countries, the evident trend, while not cubed, points to increasing carbon emissions. A permanent downward turning point for CO2 emissions has yet to be reached.
These findings are striking for optimists hoping that rising incomes will decrease carbon emissions and ease concerns about global warming. The goals of the Kyoto Protocol appear unlikely to be met, and the outcome of the Copenhagen Summit is consistent with our empirical model's predictions and expectations. Begun with great fanfare and anticipation, the Copenhagen Summit failed to reach binding emission cuts by the negotiating countries. Further, the final accord recognizes the importance of limiting a rise in global temperatures to 2°C, not the 1½ degrees many had hoped for, and drops the goal of an 80 per cent reduction in carbon emissions by the developed countries by 2050.Footnote 14
The political implications of these results are remarkable. Though the conventional wisdom inherent in all EKC estimates is that rising incomes raise awareness by citizens, neither developed countries, usually associated with strong political institutions and administrative machinery, nor their weaker counterparts in the developing world seem able to revert rising carbon emissions, at least on a long-term basis. The United States stands as a telling case study, as its Senate has refused to ratify the Kyoto Protocol or pass cap-and-trade legislation on grounds that unilateral constraints on carbon emissions that omit developing countries, especially China, are meaningless. While this argument may have merit, opposition to carbon controls from the oil and manufacturing industries, as well as an indifferent and skeptical public, surely play a role in explaining rising carbon emissions in the United States.
3. Environmental Kuznets curves and public choice
Economists have long devoted considerable attention to the optimal quantities of pollution and the allocation of environmental resources. Using efficiency criteria, they have evaluated the relative merits of alternative policy prescriptions, such as taxes and marketable pollution permits (Baumol and Oates, Reference Baumol and Oates1988). Nevertheless, these efficiency evaluations suffer from an ignorance of political realities. Rent seeking, which may be cloaked with public interest rhetoric, and political feasibility can cause environmental policy to depart markedly from derived efficiency conditions (Yandle, Reference Yandle and Anderson2000).
As global carbon emissions rise, countries continue to negotiate future reductions, with the intent of forging an agreement before expiration of the first phase of the Kyoto Protocol in 2012. These negotiations, however, are set in the backdrop of political reality. To ascertain the likely positions of carbon-emitting countries on proposals to further reduce greenhouse gas emissions, the influence carbon-emitting countries are likely to exert on proposals to limit greenhouse gas emissions, and the likely consequences of proposed reductions in greenhouse gases, we examine carbon efficiency measures of the G8 +5 countries, derived from the regression results presented in the previous section.
3.1. A simple model of carbon reduction
To evaluate the differential impact of carbon emissions on developed and developing countries, we consider a two country model. For Country A total carbon emissions, E, are a linear function of total output, so that EA = α*QA, where α is a measure of carbon efficiency and Q is RGDP. Similarly, for Country B, EB = β*QB. If Country A is the richer and more carbon efficient country, then QA > QB and α < β. In a dynamic world, we may write the following: ∂lnEA/∂lnt = ∂lnα/∂lnt + ∂lnQ/∂lnt and ∂lnEB/∂lnt = ∂lnβ/∂lnt + ∂lnQ/∂lnt, where t designates time. If both countries agree to a mandated percentage decrease in carbon emissions and technology is stagnant, then the percentage reduction in emissions will equal the percentage reduction in RGDP. While this reduction would hurt both countries, and in absolute terms hurt the developed country more, the developed country would still maintain a much higher standard of living.
On the other hand, if technology is dynamic, it is possible for countries to meet their emissions reduction goals through conservation, alternate fuels (e.g., nuclear), or by applying cleaner burning technologies to carbon fuels. In terms of the equation, ∂lnα/∂lnt and ∂lnβ/∂lnt may also be negative. If developed countries have the technology to conserve, tap cleaner alternate fuels, or apply clean technologies to carbon fuels (i.e., |∂lnα/∂lnt| > |∂lnβ/∂lnt|), their reduction in RGDP may be much lower in percentage terms. If so, unless clean technology and knowledge transfers to lower-income countries are somehow large enough to offset the relative cost burden, emissions reductions may preclude developing countries from reaching higher standards of living because they lack alternative fuels or the technologies to conserve or burn carbon fuels more cleanly.
However, developed countries are likely to resist full payment for the costs of emissions reductions and adjustments to climate change for the developing world. A European proposal to offer developing countries $10 billion for three years with up to $100 billion in the future was seen as inadequate and greeted with derision by the leaders of the developing world attending the Copenhagen Summit.Footnote 15 Whether or not and how developing countries might ‘tunnel’ though the EKC to achieve higher GDP growth and lower emissions is the large unknown (Munasinghe, Reference Munasinghe1995: 122; Reference Munasinghe2004: 15–18).
3.2. The current positions of the G8 +5 countries on carbon emissions
With the first phase of the Kyoto Treaty set to expire in 2012, the G8 countries proposed a 50 per cent reduction in global carbon emissions by 2050 and pledged substantial technological and financial aid to developing countries whose cooperation is essential if global emissions goals are to be reached (G8 Statement on Climate Change and Environment, 2008). Despite this pledge, many developing countries are skeptical about carbon reductions and the share of any reductions they may be expected to bear. Their skepticism is borne out in their public statements.Footnote 16
In 2007, for example, in light of climate change negotiations, China, which gets more than 90 per cent of its consumed energy from coal and oil,Footnote 17 announced a national climate change policy with the aim of reducing carbon emissions. Yet, this policy rejected mandatory carbon caps. Ma Kai, minister of China's National Development and Reform Commission, said emission caps were ‘too early, too abrupt and too blunt’ because China has historically had much lower total and per capita emissions than developed countries. He continued, saying China had a ‘right’ to ‘develop the economy and eradicate poverty’, a right that should be respected by other countries (Chong, Reference Chong2007).
In a 2008 news report on efforts by the G8 countries to bring about a global sharing of carbon emission reductions, leading developing nations were openly resistant.
The five main developing nations – China, India, Brazil, Mexico and South Africa, who together represent 42 percent of the world's population – issued a statement explaining their split with the G-8 over its emissions-reduction goals. They said they rejected the notion that all should share in the 50 percent target because it is wealthier countries that have created most of the environmental damage up to now (Raum, Reference Raum2008).
As a whole, the five main developing nations went so far as to propose that developed countries cut their carbon emissions by 80 per cent by 2050 before they would give consideration to a 50 per cent reduction (Antony, Reference Antony2008).
The logic of the five developing countries is simple: the developed countries have been the biggest polluters and so should be the first to clean up. Further, they argue they have the right to reach the development level of the Western world, and that they have already made significant investments in clean-coal technology and renewable energies (Heating up or cooling down?, 2009). Yet, as former UK Prime Minister Tony Blair has openly acknowledged, the feasibility of any global agreement on climate change is contingent on cooperation from developing countries, especially China and India (McCurry, Reference McCurry2008).
Negotiations in the G8 Summit leading up to the 2009 Copenhagen Summit (hurt by the departure of China's president, Hu Jintao, to deal with a domestic dispute) brought much of the same: Neither developing nor developed countries think the other is reducing emissions enough. In these negotiations the G8 countries adopted a goal of an 80 per cent reduction in greenhouse gas emissions for themselves and a 50 per cent global reduction goal.Footnote 18 For their part, developing countries were skeptical and reluctant to go along. They pointed out the lack of G8 commitment to interim (2020) reduction targets and to financial and technological aid to help developing countries clean their environments. On the other hand, Italian prime minister Silvio Berlusconi argued ‘it would not be productive if European countries, Japan, and the United States and Canada accepted cuts that are economically damaging while more than five billion people in other countries carried on as before’. US president Barak Obama added that ‘with most of the projected growth in emissions coming from these [developing] countries their active participation is a prerequisite to a solution’. The stage was set for further contentious debate at the Copenhagen Climate Change Summit in December 2009 (Feller, Reference Feller2009; ‘Ban blasts G8 emissions targets’, 2009; Weisman, Reference Weisman2009; Wintour and Elliott, Reference Wintour and Elliott2009).
As feared, the Copenhagen Summit reinforced all these difficulties by laying bare the discord between developed and developing countries. Clearly, the developed countries want developing countries to do their part to reduce carbon emissions and are unwilling to fully fund the level of technology transfers that the developing countries argue are necessary for them to reduce carbon emissions and adjust to the consequences of climate change. For their part, the developing countries do not intend to agree to substantial carbon reductions that will put them at a developmental or competitive disadvantage relative to developed countries and accuse the developed countries of shirking their responsibilities to reduce emissions.
Again, the political implications are striking. Leaders of developed and developing countries alike, regardless of the political systems in which they operate, are confronted with powerful political forces that thwart efforts to reduce carbon emissions. Vested interests, voters, and taxpayers bring force to bear in democracies. But even in autocratic regimes, such as China, leaders face expectations that standards of living will continue to rise and demands that their countries not succumb to the demands of richer countries to do more.Footnote 19
3.3. An examination of carbon efficiency
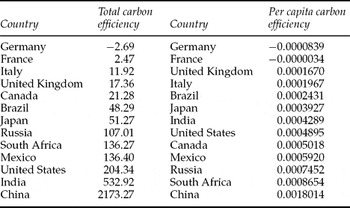
Are the developed countries more technically efficient in avoiding carbon emissions when generating GDP? To answer this question, we use the regression equations reported in section 2 to calculate carbon emission efficiency measures, which we define as the change in carbon emissions divided by the change in per capita RGDP, for each country at that country's per capita RGDP level in 2004. These calculated measures of efficiency should be useful and accurate indicators of a country's position on proposed carbon emissions. The results of our calculations are shown in table 5.
Estimates of carbon efficiency

Notes: Total carbon efficiency is the change in total CO2 emissions (measured in thousand metric tons) divided by the change in per capita RGDP (measured in US dollars) for a country's 2004 per capita RGDP. Per capita carbon efficiency is the change in per capita CO2 emissions (measured in metric tons) divided by the change in per capita RGDP (measured in US dollars) for a country's 2004 per capita RGDP.
Looking first at total carbon efficiency, we observe results broadly consistent with our hypothesis: Developed countries with high levels of emission efficiency would be able to maintain a high standard of living through technological advantages that enable them to reduce carbon emissions at a lower cost. Germany and France stand out as the most efficient countriesFootnote 20 with virtually no carbon emitted per dollar increase in per capita RGDP,Footnote 21 and seven of the most efficient countries are G8 members. Among the G8 countries, only the United States is ranked near the bottom at number eleven.Footnote 22
On the other hand, countries with the lowest estimates of emission efficiency are the developing countries. China is by far the most carbon emission intensive country, emitting over 2,173 thousand tons of CO2 per dollar increase in per capita RGDP. Brazil is the most efficient of the developing countries, ranking sixth, while the remaining developing countries occupy four of the five lowest rankings.
The estimates of per capita carbon efficiency are similar. Again, the G8 members are generally more efficient. Germany and France again are the most efficient, with estimates indicating they can simultaneously raise per capita RGDP and reduce carbon emissions.Footnote 23 Intermediate rankings reveal that Canada is apparently much less efficient in per capita terms, while the United States ranks considerably more efficient. Again, the developing countries are generally less efficient users of carbon, with China the least efficient user. Brazil remains the most efficient of the developing countries, though India achieves a median ranking.
These estimates of carbon emission efficiency are broadly consistent with countries’ respective positions on proposed carbon emission limitations. Developed countries with substantial investments in conservation, alternate fuels, and clean-fuel technologies have lower rates of carbon emitted per unit of output and are less opposed to reductions in carbon emissions than developing countries that rely heavily on increased use of carbon fuels, often inefficiently burned, to achieve the higher and rising standards of living their populations have come to expect. However, developed countries clearly do not intend to be the sole bearers of the costs of carbon reductions, as evidenced by their insistence that the developing countries do their part as well.
In summary, EKCs allow estimates of not only the pattern of carbon emissions as per capita RGDP rises, but also estimates of carbon efficiency that illuminate the debate over global carbon emissions. Both estimates shed light on the difficulties of past initiatives to reduce carbon emissions and suggest future negotiations will be bedeviled with the same impediments.
4. Final thoughts
Our use of EKCs provides valuable insight into not only the path of carbon emissions as income rises, but also the carbon emission efficiency of major emitters. Consistent with Goklany's theory and contrary to the hopes of optimists and some prior estimates, our time series analysis of carbon emissions for the G8 +5 countries indicates that global carbon emissions will rise with rising incomes. Rising emissions are predicted by the growth of the developing world and by the rising EKC tails we have reported.
Binding constraints on carbon emissions, as are now being considered by many of world's governments, may reverse this trend, but imposing these constraints means facing and overcoming difficult political realities. Developed countries seem willing to shoulder a disproportionate share of the reduction burden, but insist that developing countries bear a significant part of the burden as well. The five main developing countries voice resistance to these proposed reductions in their carbon emissions, worried about the consequences for their economies, and insistent on their right to develop. Our estimates of carbon emission efficiency indicate that the economic cost associated with carbon emission reductions by relatively inefficient developing countries could be substantial.
In our empirical analysis we are unable to take account of breakthroughs that can occur to alter carbon emission efficiency and related reduction prospects for developing and developed countries alike. As suggested by Munasinghe (Reference Munasinghe1995: 122; Reference Munasinghe2004: 15–18), changes in technology, revised regulatory approaches, and knowledge transfers can make it possible for nations on the left-hand side of the inverted U-shaped part of an EKC to short circuit the trip to the top and down by ‘tunneling’ through the EKC. Our work suggests that if and when this occurs, the challenge that remains is one of staying on course to avoid a rising EKC tail and more emissions.
Taken together, our results do not predict the passage of a global agreement to make measurable progress in reducing carbon emissions. And here we emphasis the word ‘global’. Instead, we predict the road toward lower total emissions for the world will be filled with detours and potholes, but that forward movement for some major emitters will continue.