INTRODUCTION
The distribution and abundance of larval fish in space and time are influenced by both biotic and abiotic factors in the coastal environment. Larval abundance is initially driven by the reproductive success of the adult stocks. The survival of larvae and thus their ultimate recruitment can then be modulated by their ability to get from spawning grounds to suitable nurseries, or in other cases to maintain themselves within the areas where they were spawned (Norcross & Shaw, Reference Norcross and Shaw1984; Boehlert & Mundy, Reference Boehlert and Mundy1988). Various mechanisms effect the advection and dispersion of larvae such as currents (Garrido et al., Reference Garrido, Santos, dos Santos and Ré2009), mixing (Ruiz et al., Reference Ruiz, Garcia-Isarch, Huertas, Prieto, Juarez, Munoz, Sanchez-Lamadrid, Rodriguez-Galvez, Naranjo and Baldo2006), fronts (Lee et al., Reference Lee, Nash and Danilowicz2005), surface slicks (Kingsford & Choat, Reference Kingsford and Choat1986), upwellings (Castro et al., Reference Castro, Salinas and Hernandez2000) and the effects of wind (Hernandez-Miranda et al., Reference Hernandez-Miranda, Palma and Ojeda2003; Voss & Hinrichsen, Reference Voss and Hinrichsen2003).
The recruitment success of a year-class of fish with pelagic eggs and larvae is considered to be primarily influenced by conditions experienced in their larval stage. Cushing's (Reference Cushing1990) match–mismatch hypothesis proposes that successful cohorts of larval fish are spawned to coincide with peaks of plankton production, thus ensuring a plentiful supply of food. Van der Veer et al. (Reference Van der Veer, Geffen and Witte2000) found a very strong year-class of North Sea plaice Pleuronectes platessa to be generated in the larval phase. Single strong year-classes are important to the overall health and resilience of a stock. Episodic pulses of larval production are a widespread feature of marine fish, and these overlapping cohorts within a year-class confer increased chances of the successful recruitment of at least part of the year's production (Secor, Reference Secor2007). A review by Leggett & Deblois (Reference Leggett and Deblois1994) found that mortality during the pre-juvenile stages determined year-class strength, although mortality in the later juvenile and post-juvenile stages may moderate the size of the effect. Recruitment variability is the product of complex and interacting factors at various temporal and spatial scales; during the pre-recruit stages of fish life histories both trophodynamic and physical processes influence ultimate recruitment success (Houde, Reference Houde2008).
The hydrodynamic systems governing the spawning and recruitment of fish along the west coast of Ireland have not been studied until now. Galway Bay is the only embayment on the west coast of Ireland to have attracted research into its nearshore ichthyoplankton community, and as such it is the sole representative of an intricate, extensive and largely unspoiled coastline on the most westerly edge of Europe. Ireland's complex Atlantic coast provides many important habitats for fish but the transport and retention of their early stages are poorly understood. Sandy beaches within Galway Bay serve as nursery areas for several flatfish species including plaice (P. platessa), turbot (Psetta maxima), flounder (Platichthys flesus) and dab (Limanda limanda) (Haynes et al., Reference Haynes, Allen, Brophy and McGrath2008, Reference Haynes, Brophy, McGrath, O'Callaghan, Comerford and Casburn2010; De Raedemaecker et al., Reference De Raedemaecker, Keating, Brophy, O'Connor and McGrath2011, Reference De Raedemaecker, Brophy, O'Connor and Comerford2012). The bay is also ringed with rocky shores and has an extensive littoral zone. In the past the larval and juvenile stages of up to 106 fish species have been recorded in the bay (Dunne, Reference Dunne1972) representing a range of larval survival strategies and adult habitat preferences. Previous work on the ichthyoplankton of Galway Bay has described the general assemblages (Fives, Reference Fives1970; Dunne, Reference Dunne1972; Fives & O'Brien, Reference Fives and O'Brien1976); concentrated on the neustonic and pseudoneustonic fish (Tully & O'Ceidigh, Reference Tully and O'Ceidigh1989a, Reference Tully and O'Ceidighb); or focused on the larvae of herring (Grainger, Reference Grainger1980).
This study was designed to describe the spring and summer ichthyoplankton assemblages of inner Galway Bay over two years, and to discover what hydrodynamic features and climatic forces contribute to their distribution. In particular, we analysed the effects of wind blows, tidal water movements and fresh water inputs on where larval fish were found. The aim was to formulate an ecological model, not to predict future outcomes but to increase our understanding of the system under investigation. Estuaries and bays are uniquely important but fragile ecosystems that are under increasing anthropogenic pressures. Inner Galway Bay is a designated Special Area of Conservation under the EU Habitats Directive 1992 and as such is of recognized importance as a marine, littoral and terrestrial habitat. The area is also a Special Protected Area under the EU Birds Directive 1979. The hydrodynamics of the bay are subject to potential disruption by building, development and changes in land and water use. The bay and its surrounding littoral act as nurseries for the juveniles of commercially exploited fish stocks, notably plaice, turbot, brill (Scophthalmus rhombus), whiting (Merlangius merlangus), sprat (Sprattus sprattus) and pollock (Pollachius pollachius) (Marine Institute, 2010). Perturbation of the early life history stages of fish could therefore have economic as well as ecological implications. In general, increased understanding of the mechanisms underlying the ecological functions of the system will allow greater measures of protection from potentially harmful activities.
MATERIALS AND METHODS
Study area
Galway Bay is a large embayment on the Atlantic coast of Ireland oriented westward. To the west the bay is open to the Atlantic, interrupted only by the Aran Islands situated approximately 35 km distant from the study site. The study area was inner Galway Bay and samples were taken in an area approximately 140 km2 bounded by the land to the north, east and south. Waters in this area are well mixed with no evidence of stratification during the periods sampled. The bay receives diffuse and point freshwater discharge around its perimeter, notably from the Corrib River in the north-eastern corner of the bay, an estuary discharging water through Galway City at an annual average of 99 m3s−1 (Office of Public Works of Ireland, 2007). This discharge results in a thin (<1 m) lens of low-salinity water along the north shore of the bay west of the Corrib River outfall (authors, personal observation) Circulation in the bay is net inward along its southern part; net outflow is westward along the north shore and the residual circulation is anti-clockwise (Booth, Reference Booth1975; White, Reference White, Keegan and O'Connor1996).
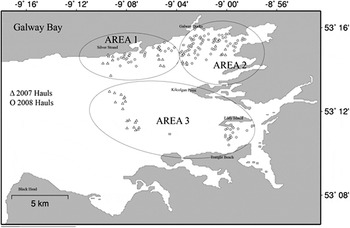
Data for this study came from both dedicated sampling and surveys undertaken as part of other related projects. As a result the sampling was to some extent opportunistic and also was shaped by weather suitable for small boat work. However, there was sufficient consistency of effort and coverage of Galway Bay over the two years to justify the analysis. Inner Galway Bay was divided into three areas: off the north shore west of 009°04′ (area 1); off the north shore east of 009°04′ (area 2); and south of Kilcolgan Point at 53°13′ (area 3) (Figure 1). In 2007, 108 tows were made in total, with 36 in each of the areas. The effort in area 3 was concentrated approximately in the middle of the bay. In 2008, 107 tows were made; 27 in area 1, 62 in area 2, and 18 in area 3. The offshore site in area 3 from 2007 was abandoned as it was very exposed and could only be sampled in particularly clement weather; in 2008 the effort in area 3 was moved further inshore in the south-east of the bay. The samples from both years in area 3 were pooled as both were from the southern part of the bay. In both years, tows were evenly split between surface (neuston) and subsurface (plankton). Sampling took place throughout the summer from May to August in 2007 and April to August in 2008. No sampling was undertaken in July of either year due to bad weather. In general sampling was abandoned or not attempted in winds >F5. These features of the study had the effect of unbalancing the design to some extent but did not cause problems with the analysis.
Chart of Galway Bay, Ireland showing positions of hauls in 2007 and 2008.

Sampling protocol
Sampling was by net with a mesh of 333 µm towed behind a 5 m open boat driven by a 15 hp outboard engine. Tows were conducted both in the neuston and the plankton; in 2007 a frame net with rectangular opening 75 cm × 35 cm was employed for both types of tow with floats added for surface tows, and removed for subsurface tows. In 2008 a bongo net with twin circular frames with diameter 30 cm was used instead for the subsurface tows, and the surface tows were conducted as before. This modification was not considered to influence the gear's ability to catch fish, though it decreased the estimated volume of water sampled in subsurface tows in the second year. A heavy chain depressor was used to keep the gear down for subsurface tows and a towing depth of approximately 5 ± 3 m was controlled by boat speed and the length of warp paid out. A depth sensor attached to the net during preliminary trials indicated that the net tended to kite up and down in the water column fairly constantly. Charted depths in the areas sampled ranged from 3 to 15 m and there is a mean spring tidal range of 4.5 m. Surface tows were carried out at ~2.5 knots and subsurface tows at ~2.0 knots, both for fifteen minutes. At least three replicate samples of both the neuston and the plankton were taken during any sampling event in an area. Boat speed was monitored by a Clipper log, and the volume of water flowing through the nets was estimated using a General Oceanics flowmeter. The net was kept out of the wake of the boat by deploying the gear from the end of a short boom mounted across the beam of the boat. During surface tows the net was alongside the boat forward of the propeller wash, during subsurface tows the gear was 10–15 m behind the boat. This was considered adequate to keep the gear away from the disturbance caused by the boat. Tow positions were recorded using a GPS. Temperature and salinity of the water column were measured throughout each season using a WTW 197i TS meter, though not on every sampling date in 2008.
Larval fish were removed from the nets at sea and stored in 4% buffered formalin before transfer into methyl alcohol in the laboratory. Fish were identified according to the classification in Russell (Reference Russell1976) to the lowest possible taxonomic level which was species except for Gobiidae (gobies) which were identified to family and Callionymidae (dragonets) which were identified to genus. Larval, post-larval and early juvenile planktonic or pelagic stages were caught, and for the purpose of this study it was not necessary to differentiate between stages. As a result ‘larvae’ may refer to any young stage of fish caught by the nets.
Data analysis
A binomial model with a logistic link was chosen on the basis that it was a better descriptor of the abundance of larval fish within the system given the high numbers of catches without fish. Garrido et al. (Reference Garrido, Santos, dos Santos and Ré2009) successfully modelled larval fish abundance against environmental variables using binomial models, and Stoner et al. (Reference Stoner, Manderson and Pessutti2001) used non-parametric binomial general additive models to examine relationships between juvenile winter flounder (Pseudopleuronectes americanus) and environmental variables. Logistic regression of this kind can provide simple, accurate habitat models (Norcross et al., Reference Norcross, Blanchard and Holladay1999). Catch data for all the fish species captured were converted into binomial (presence/absence of fish per haul) data and modelled using generalized linear modelling (glm) with a logit link using the open source language R version 2.11.1 (R Development Core Team, 2010).
A number of candidate explanatory variables were modelled and manual backward selection was applied on the basis of Akaike information criterion values (Burnham & Anderson, Reference Burnham and Anderson2002; Zuur et al., Reference Zuur, Ieno, Walker, Savaliev and Smith2009) and the significance of parameters at the P = 0.05 level. Prior data exploration prevented the inclusion of correlating predictor variables. All possible two-way interactions between explanatory variables were initially included along with single-order variables. The candidate explanatory variables were: tidal flow (estimated volume of water flowing into or out of the bay); tidal height at Galway Port; spring or neap tide; moon phase; tow depth, i.e. neuston or plankton; wind strength and direction during sampling; rainfall preceding sampling; wind strength and direction preceding sampling; day of the year; site; and year. Wind strength was assigned a positive or negative sign to indicate an onshore (westerly) or offshore (easterly) direction, then averaged over 1, 2, 3, 4, 5, 7 and 10 days preceding sampling; the number of days explaining most variation in the model was used thereafter. Rainfall preceding sampling was similarly averaged over a number of days. Tidal data were taken from the Belfield Software Tide Plotter program. Wind data came from the Met Eireann weather station at Shannon, approximately 60 km from the study site, and rain data came from Met Eireann's Valentia weather station through the European Climate Assessment and Dataset website (http://eca.knmi.nl). As conductivity–temperature–depth measurements taken throughout the survey showed a well-mixed water column which was largely uniform around the bay, temperature and salinity were not included in the analysis.
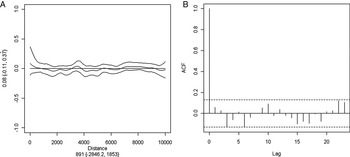
The model was validated according to the methods of Zuur et al. (Reference Zuur, Ieno, Walker, Savaliev and Smith2009). Issues of temporal correlation that could potentially bias the model were investigated by plotting the correlation of residuals from the glm model using the auto-correlation function (acf) in R (Figure 2). Spatial correlation between samples was tested by generating a correlogram using the spatial non-parametric covariance functions (ncf) package in R (Figure 2). Spatial correlation was also checked by plotting model residuals against x–y co-ordinates using the bubble function from the gstat package in R. No spatial or temporal correlation was evident which justified the use of a glm without including any correlation structure or random effect. Model residuals were plotted against fitted values and also against the predictor variables excluded during the model selection process; no patterns of any significance were observed and the model was considered robust.
Correlogram (A) showing the lack of spatial auto-correlation in the model and an auto-correlation function plot (B) of model residuals, also showing the absence of any autocorrelation.

RESULTS
Fish species
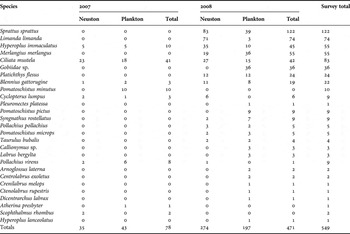
A total of 549 larval and juvenile fish representing 27 taxa were caught over the two years of sampling: in 2007, 78 were caught in 108 tows over 10 days sampling. In 2008, 471 were caught in 105 tows over 13 days sampling (Table 1). In 2007, 35 fish were captured from the neuston and 43 from the plankton; in 2008 274 were taken from the neuston and 197 from the plankton. Catches were dominated by larval sprat (Sprattus sprattus) in 2008, 124 were caught that year, although none were caught in 2007. They were evenly spread throughout the bay and were caught both in the neuston and plankton. The five-bearded rockling Ciliata mustela were caught in relatively high numbers (74 larvae and juveniles) across the two years, the neuston and the plankton, and all areas sampled. The greater sand eel (Hyperoplus immaculatus) (55 larvae) was also taken in both neuston and plankton in both years. Whiting (Merlangius merlangus) yielded 55 juveniles from both the neuston and the plankton; all were taken from areas 1 and 2 in the north of the bay in 2008 only. There were 74 dab (Limanda limanda) caught in total, again only in 2008, 71 of which came from one haul on the surface in area 3 in the south of the bay. A similar temporal pattern was seen with gobies (Gobiidae sp.); considerable numbers of each species were caught in 2008 but none were present the previous year. Throughout the survey there were no obvious distribution patterns either spatially or between neuston and plankton. While a number of species were found exclusively in sub-surface tows, most were caught in small numbers (<= 3) with the exception of the gobies (36) and Pomatoschistus pictus (9). Brill (Scophthalmus rhombus) were the only fish found exclusively in the neuston but there were only 2 caught. Catches of all species tailed off sharply in the latter half of both years.
Larval fish captured during 2007 and 2008 in Galway Bay showing larvae caught in the neuston (surface) and plankton (sub-surface).

Modelling
The explanatory variables significant at the P = 0.05 level were year, area, day and wind index over 5 days preceding sampling. Regressors found not to be significant at P = 0.05, and thus rejected during model selection, were tidal flow, tidal height, tidal phase, moon phase, tow depth, wind strength and direction during sampling, and rainfall over several time intervals preceding sampling. All possible two-way interactions between explanatory variables were also tested, and none were significant.
The following logistical model was fitted to the data:
 $$\hbox{logit} \lpar {\rm \pi_{i}}\rpar = {\rm \alpha} + \hbox{Wind index}_{\rm i} + \hbox{Area}_{\rm i} + \hbox{Day}_{\rm i} + \hbox{Year}_{\rm i}$$
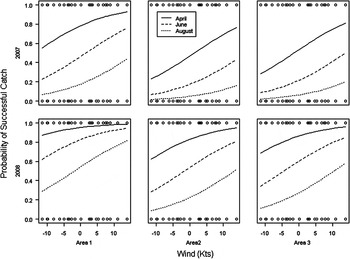
The model estimates indicated higher abundance of larval fish overall in the second year; the negative effect of time on catches each year and that area 1 on the north shore west of the Corrib Estuary was more productive than the other two areas, which were almost identical. The effect of the wind index was positive; onshore winds increased catch probability, offshore winds reduced it. Null deviance was 307.47 on 221 degrees of freedom and residual deviance was 231.33 on 216 degrees of freedom. This implies that the model explains 24.8% of the variance. All explanatory variables included were significant at P < 0.001. The model estimates were converted from logits to calculate probability (P) by the formula:
 $$P = {e^x \over 1 + e^x} \hbox{where}\, x\, \hbox{is the model estimate}.$$
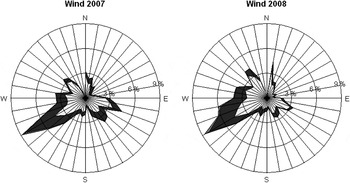
To visualize the model, the probability of catches containing larval fish was plotted for both years and each of the three areas choosing the median day of April, June and August to describe the change over time and using wind as the continuous explanatory variable (Figure 3). Windroses were generated to demonstrate the frequency, strength and direction of the winds influencing the study area over the two years (Figure 4).
Model output: predicted probability of catching larval fish for each area over two years. Negative values for wind indicate offshore winds averaged over five days prior to sampling; positive values indicate onshore winds. Circles top and bottom of each panel indicate positive or negative binomial data points.

Windroses showing percentage frequency, direction and strength of winds recorded at Shannon, April to September 2007 and April to September 2008. White, 0–10 knots; dark grey 11–20 knots; light grey 21–30 knots.

DISCUSSION
The ichthyoplankton community of Galway Bay has been well described in the past (Fives, Reference Fives1970; Dunne, Reference Dunne1972; Fives & O'Brien, Reference Fives and O'Brien1976; Tully & O'Ceidigh, Reference Tully and O'Ceidigh1989a, Reference Tully and O'Ceidighb), but no attempt had been made to formally relate this community to the physical environment. Studies have established the importance of wind-forcing in the transport of fish larvae across continental shelves (Epifanio & Garvine, Reference Epifanio and Garvine2001; Doyle et al., Reference Doyle, Picquelle, Mier, Spillane and Bond2009), along open coastlines (Nakata et al., Reference Nakata, Fujihara, Suenaga, Nagasawa and Fujii2000; Prieto et al., Reference Prieto, Navarro, Rodriguez-Galvez, Huertas, Naranjo and Ruiz2009), and in estuaries (Simionato et al., Reference Simionato, Berasategui, Meccia, Acha and Mianzan2008). Catalan et al. (Reference Catalan, Rubin, Navarro and Prieto2006) established that short term changes in hydrodynamic conditions caused by wind-forcing resulted in profound changes in the distribution of some species of larval fish in the Gulf of Cadiz. In the present study wind speed and direction was a significant driver of larval distribution and the model indicated that the averaged effect of wind over five days prior to sampling had the strongest impact on catch success when compared with winds averaged over shorter or longer periods. This suggests that larval fish become concentrated in inner Galway Bay following sustained blows with a westerly component, and five days is the timescale that best represents the pattern of the wind, revealing the net effect on larval fish transport. Hydrodynamic modelling work has indicated that in conditions unforced by wind or tide the residual circulation is anti-clockwise in the bay, with a prevailing current flowing west along the north shore (C. Mohn, unpublished data). However the wind plots show that the study site was subject to frequent and occasionally strong wind blows, predominantly from the south-west, throughout the spring and summer; and these conditions appear to have driven the distribution of larvae and juveniles of the fish species sampled in this study. On a bay scale passively transported larvae have nowhere else to go but into the inner bay as the prevailing winds overcome the residual circulation. In the bay wind driven currents and thus the passive transport of larvae are in the direction of the wind, Ekman spirals being unable to form in shallow inshore waters (Nielsen et al., Reference Nielsen, Bagge and MacKenzie1997; Werner et al., Reference Werner, Quinlan, Blanton and Luettich1997). The implication is that should winds be exceptionally light or from an unusual direction during the spring and early summer that larval transport and retention would be adversely affected. Residual currents would tend to carry larval fish out of the bay along the north shoreline.
The present study yielded 26 species from inner Galway Bay, only one of which, Dicentrarchus labrax (sea bass) had not been previously recorded anywhere in the region. While the number of species recorded is the lowest of all the local studies it is only generally comparable to Fives (Reference Fives1970) who recorded 35 species sampling in the inner bay from 1961 to 1965. The extreme scarcity of larval fish both in number of species (8) and total abundance (78) was striking in 2007. There was no obvious reason for this; the wind frequency, strength and direction were remarkably similar between the two years. The nearest available sea surface temperature for that period was at Buoy M3 off the south-west coast of Ireland (Marine Institute); average temperatures for the period 1 January to 20 April for 2007 and 2008 were identical indicating that there was no temperature-related failure to spawn by offshore-spawning species. From this it is probably safe to infer that there were no major temperature anomalies affecting inshore spawning species either. Biological factors relating to spawning success remain a possibility to explain the annual differences, but it seems improbable that failure could occur across so many species representing a range of survival strategies. There was a change of gear used for subsurface tows in 2008, but this had no appreciable effect on efficiency, and actually reduced filtered volumes in the more productive year. The results from 2007 appear to show that the gear was capable of catching fish when they were present, which possibly rules out the change in equipment as a confounding factor. Nevertheless the differences in results between years are striking, and unexplained.
A physical variable indicating the wind strength and direction at the time of sampling (always <20 knots) was not significant, which implies that short-term turbulent mixing of the water column due to wind did not affect the number of larvae available for capture, and also did not detract from the ability of the gear to catch fish. Contrasting with the importance of wind averaged over 5 days, the wind blows measured at shorter timescales may be too variable for their influence to be reflected in the distribution of the fish. In a study carried out in wind speeds of 0–22 knots approximately 70 km offshore in 80 m of water, wave height was found to lag wind speed by about 4 hours, both in growth and decay phases (PrasadaRao & Baba, Reference PrasadaRao and Baba1996). In contrast to open ocean or continental shelf conditions, wind-generated wave growth rates in waters of finite depth are limited (Young, Reference Young1997).
The model output plots show the decreasing probability of catching larval fish of any kind over the course of each year, while simultaneously onshore winds of greater magnitude contribute to greater catch success. The number of larval and juvenile fish captured in the plankton had fallen off markedly by August. This reflects the evolution of the larval communities over time, with the larvae of some species growing larger and becoming harder to catch, or, in other cases, leaving the neuston or plankton. Doyle et al. (Reference Doyle, Picquelle, Mier, Spillane and Bond2009) found that ontogenetic-specific responses to physical variables representing sub-intervals of life are important, and that the relationship between abundance and those variables was unique and complex among species.
Larval distribution differed significantly according to which area of the bay was sampled, and area 1 on the north shore west of the Corrib Estuary yielded more catches. Catch successes in areas 2 and 3 were lower, and almost identical to one another. Area 1 is the only one sampled that showed any salinity anomalies, with a thin lens of lower-salinity water from the Corrib system sitting on the surface. The higher abundance is not easily explained by entrainment or passive transport; if wind-forcing alone was the driver then it could be expected that area 2 covering the mouth of the Corrib Estuary and points east of there would show the highest abundances under the influence of the prevailing wind (Figure 4) as the larvae fetched up against the land–sea boundary. This was also the area of greatest sampling effort. During the less frequent periods of slack or offshore winds the driver for passive transport along this shore is the westward cyclonic flow (Booth, Reference Booth1975; C. Mohn, personal communication).
Different species use different strategies to locate themselves advantageously during the larval phase, employing behaviours to benefit from hydrodynamic features in their environment (reviewed in Boehlert & Mundy, Reference Boehlert and Mundy1988). Selective tidal stream transport is a well-studied mechanism whereby larvae position themselves vertically according to the horizontal flow regime. It is particularly employed by larval fish entering estuaries where they maintain themselves on the bottom during ebb tides, keeping out of the main flow; then move up into the water column during flow tides to enjoy an energetically inexpensive ride upstream (De Veen, Reference De Veen1978; Fortier & Leggett, Reference Fortier and Leggett1983; Norcross & Shaw, Reference Norcross and Shaw1984). Behaviours by larvae are in response to environmental cues, and tidal flux can result in accumulations of fish. However, tidal flux is a complex of potentially collinear variables including, at differing time scales, lunar phase, current speed, freshwater input, salinity, turbidity, temperature and olfactory cues (Boehlert & Mundy, Reference Boehlert and Mundy1988). We tested lunar phase, tidal phase, tidal height, estimated tidal flow, and rainfall but none were significant in the model either as main effects or in interaction with any other variables. An interaction between hydrodynamic variables and area would have been expected if there was a strong estuarial effect in the bay, but none was evident. The binomial approach used to model the presence or absence of larval fish is quite a blunt instrument with which to detect signals of temporal and spatial variability in the mouth of a small estuary such as the Corrib, and on a wider scale throughout Galway Bay. No species was caught in sufficient numbers to allow a more in-depth analysis. Future projects of this kind would need to succeed in capturing greater numbers of fish with finer temporal resolution in the early part of the season to allow a more specific inference than the general one offered here.
CONCLUSION
The ichthyoplankton of inner Galway Bay surveyed in this study was species poor relative to previous studies in the region, and catches were meagre in the first year of the study. Nevertheless sufficient data were gathered to formulate a simple ecological model which revealed that wind forcing from the west had the greatest effect on the distribution and abundance of fish larvae compared with other physical variables. The prevailing winds appear to be a necessary component for the transport and accumulation of larval fish within Galway Bay. The community showed predictable changes over time within each year and the area of the bay west of the Corrib Estuary had the highest abundances, although the reason behind this was not clear. This study serves as the first attempt to quantify the hydrodynamic forces driving the patterns of abundance of larval fish in the nearshore environment on the west coast of Ireland. The Galway Bay area is subject to largely the same prevailing winds, moderate tidal effects and proximity to the Gulf Stream as the rest of the Atlantic coast of Ireland, and so the findings are important on a greater than bay scale.
ACKNOWLEDGEMENTS
This work was funded by the Irish Research Council for Science, Engineering and Technology, under the National Development Plan. Thanks to Clare Murray, Bernadette O'Neill and Fien De Raedemaecker for help with sampling.