

When the 113th Congress convened in January 2013, women occupied only 17.9% of the 435 seats in the U.S. House,Footnote 1 ranking the United States 80th globally in terms of the percentage of women serving in the lower legislative assembly.Footnote 2 The underrepresentation of women is particularly puzzling, as political scientists since the 1990s have consistently shown that women candidates are not of demonstrably less quality than men on average (see Fulton Reference Fulton2012, Reference Fulton2014; Fulton et al. Reference Fulton, Maestas, Maisel and Stone2006; Lawless and Fox Reference Fox, Carroll and Fox2010), do not suffer from a gender-related funding disadvantage (Berch Reference Berch1996; Burrell Reference Burrell2008; Gaddie and Bullock Reference Gaddie and Bullock1995; Fox Reference Fox, Carroll and Fox2010; Herrick Reference Herrick1995, Reference Herrick1996), and do about as well as men at the polls, accounting for differences in incumbency status (Fox Reference Fox, Carroll and Fox2010; Smith and Fox Reference Smith and Fox2001).
Yet despite a decided lack of empirical evidence for systemic discrimination against women candidates, women considering a run for office believe that they face a more difficult path to election than men. In their 2001 survey of people occupying the so-called “feeder professions” most likely to spawn a politician—law, business, education, and politics—Lawless and Fox (Reference Fox, Carroll and Fox2010, 116) found that women were much more likely to believe that they are “not at all qualified” to run for office and were less likely to believe that they would win an election if they ran. These beliefs are probably due in part to the fact that 91% of women respondents felt that there was significant gender bias in politics (Lawless and Fox Reference Fox, Carroll and Fox2010, 125). In short, many would-be women candidates perceive that their gender poses a significant impediment to election, even though there is little empirical evidence that this is the case.
In this article, we examine mass perception of the relative efficacy of women candidates, whether or not that perception can be changed, and, if so, whether or not any such change persists. Specifically, we test whether a straightforward information campaign can change beliefs about women candidates' likely success. We designed a short video that summarized documented findings in political science about the efficacy of women as candidates and randomly assigned some participants in an online survey to watch this video. We find that exposure to information depicting the above-mentioned success of women (relative to men) in terms of garnering both campaign money and votes substantially increased the proportion of respondents who believed that “a male and female candidate stand the same chance of winning” compared to respondents who received no such information. We also conducted a follow-up survey approximately two to three weeks after the initial one, in which about 50% of our initial sample participated. This panel design permitted us to observe the extent to which the effects of the informational campaign diminish over a short period of time (see Chong and Druckman Reference Chong and Druckman2010; Druckman, Fein, and Leeper Reference Druckman, Fein and Leeper2012; Gerber et al. Reference Gerber, Gimpel, Green and Shaw2011; Hill et al. Reference Hill, Lo, Vavreck and Zaller2013). We find that although the effects decayed substantially—by about 30%—participants who viewed the video were still significantly more likely to deem women at least on par with men in terms of their likelihood of winning office. Thus, our findings suggest that while the chances of women as candidates are not well regarded by the public at large, the promulgation of factual information about the success of female candidates dramatically improves the perceived efficacy of women candidates. Moreover, our results also suggest that even a brief, one-shot intervention is capable of affecting judgments about women over a meaningful period of time.
Despite the significant real-world implications of a widespread misperception of women's electoral fortunes, we are aware of no studies in the political science literature that seek to substantiate, explain, or remediate mass beliefs about women who run for office. Here we focus on the simple provision of factual information about the efficacy of women as candidates and employ a panel design that allows us to determine whether informational treatments can impart enduring effects on respondents' evaluation of women's electoral fortunes. As such, we believe that the present study is important from both a practical and academic perspective. In the realm of practical politics, if more women are equipped with the knowledge that they can run strong campaigns, it stands to reason that more will do so. From an academic perspective, understanding whether information can correct misperceptions beyond the period of time immediately following its receipt contributes to our understanding of the nature of political information, facts, and misperception.
CAN INFORMATION BRIDGE THE AMBITION GAP?
Mass perceptions of the electoral chances of women candidates are an important component to understanding the nature of gender and political ambition. Prospective women candidates perceive their odds of winning as lower, and they are more likely to downgrade their qualifications for office (Lawless and Fox Reference Fox, Carroll and Fox2010). Meanwhile, when polled, substantial majorities of women in the electorate have reported that women are covered less seriously by the media and taken less seriously by voters than men,Footnote 3 and pluralities have told pollsters both that the media have treated women candidates more harshly and that gender is a larger obstacle to election than race.Footnote 4 It should not be terribly surprising then that there is a wide gap in political ambition between the two genders that results in fewer women running at all (Lawless and Fox Reference Fox, Carroll and Fox2010; Fulton et al. Reference Fulton, Maestas, Maisel and Stone2006).
It is not difficult to understand why women might feel that their path to election is more challenging. Media coverage of women in presidential elections, for example, is historically less substantive and less likely to portray them as viable candidates (Falk Reference Falk2008). In 2008, coverage of Hillary Clinton's presidential campaign was more negative than that of her male counterparts, though some of that difference can be attributed to her front-runner status early in the campaign (Lawrence and Rose Reference Lawrence and Rose2010, 145–78). Nonetheless, Clinton's experience underscores that women have long been subjected to different standards and tone in media coverage (e.g., Fowler and Lawless Reference Fowler and Lawless2009; Fox Reference Fox1997; Kahn Reference Kahn1996). Sarah Palin also endured considerable scrutiny regarding both her appearance and capacity to simultaneously tackle the roles of mother and vice president during the 2008 election. The experiences of both Clinton and Palin serve as a reminder that women still face obstacles stemming from persistent gender stereotypes in media coverage (Carroll and Dittmar Reference Carroll, Dittmar, Carroll and Fox2010).
Moreover, there is a robust literature demonstrating that voters stereotype men and women running for office. Women are presumed to be more liberal relative to both men of their own party and their actual ideology (Koch Reference Koch2000; Reference Koch2002). Consciously or not, voters tend to see women as more compassionate and competent in the realm of “women's issues” such as abortion or child care (see Burrell Reference Burrell2008; Herrnson, Lay, and Stokes Reference Herrnson, Lay and Stokes2003; Kahn Reference Kahn1996; Koch Reference Koch1999; Plutzer and Zipp Reference Plutzer and Zipp1996). These gender stereotypes can influence voting behavior as voters weigh their image of a candidate against their favored political issues (see Sanbonmatsu Reference Sanbonmatsu2002). Dolan (Reference Dolan2004) found that nearly one-quarter of Americans believe that men are better equipped emotionally to occupy positions of leadership, and there is some evidence that voters prefer more masculine traits in candidates for high-level office as well (Lawless Reference Lawless2004; Rosenwasser, Miller, and Dean Reference Rosenwasser and Dean1989). Stereotypes about women's relative policy strengths—as opposed to their personal traits—seem particularly important in shaping voters' assessments of women candidates (Dolan Reference Dolan2010). The perception of women as more liberal than men can therefore make women candidates seem more distant from the preferences of many voters, leading to a perception of the man as the less risky choice—costing women votes in some cases (Koch Reference Koch2002).Footnote 5
Yet, for all the media double standards and voter stereotyping, there is little evidence suggesting that women running for legislative offices actually win a lower share of the vote due to gender alone. While gender stereotypes may enter into the formation of beliefs about men and women as both candidates and legislators, such stereotypes do not appear to guide vote choice (Dolan and Lynch 2013). Indeed, the modal preference among respondents to the 2006 National Election Study was for gender parity in representation (Dolan and Sanbonmatsu Reference Dolan and Sanbonmatsu2009), and a 2012 Gallup poll found that only 4% of Americans would not vote for a woman because of her gender.Footnote 6 Women voters appear to be more likely to support women candidates in many instances (for a summary of this literature, see Dolan Reference Dolan2008), and gender-focused political action committees like EMILY's List help to ensure that at least in congressional elections, women raise money at rates comparable to men once their incumbency status is taken into account (Fox Reference Fox, Carroll and Fox2010; Burrell Reference Burrell2008).
Equality in resources appears to translate to parity in votes: in terms of their probability of winning a seat in Congress, nonincumbent women perform at rates comparable to nonincumbent men (Fox Reference Fox, Carroll and Fox2010; Dolan Reference Dolan2004; Smith and Fox Reference Smith and Fox2001). Fox and Lawless (Reference Lawless and Fox2010) found that women in their survey sample reported winning state and local office at rates similar to men as well. It is worth noting, however, that the apparent vote parity between women and men might be attributable in part to the fact that the former tend to be better quality candidates on average. For instance, despite being less ambitious than their male colleagues, women state legislators are more strategic in their entry decision when it comes to running for Congress, choosing to enter a race when conditions are particularly favorable (Fulton et al. Reference Fulton, Maestas, Maisel and Stone2006). Women are also more likely than men to face congressional primary competition (Lawless and Pearson Reference Lawless and Pearson2008). A calculating, seasoned candidate makes for stiff competition, and Fulton (Reference Fulton2012, Reference Fulton2014) finds that women's advantage in the “valence” realm of candidate quality translates to vote gains that result in parity with men. Put another way, women may be equally as successful as men, but only because the women who do run are better candidates.
One reason for women being so discerning in their entry decisions might be that regardless of whether they compete at parity with men on average, the stereotyping described above leads many women to believe that they would be at a gender-based disadvantage and thus that a campaign is not worth waging unless they are very well prepared. Such a perception is understandable; if media portray women candidates as less viable during the campaign, then, absent information to the contrary, the public may simply assume that women lose at higher rates than men. Indeed, given the disparate media coverage and its down-weighting of women's electoral fortunes—whether overt or not—it should not be particularly surprising if there is a widely held belief that such a disadvantage exists.
Considering that—as noted above—such a perception is demonstrably false, correcting it seems to be an important first step toward encouraging more women to run for office. There is no shortage of training seminars for women candidates in the United States, as political action committees (such as EMILY's List), party organizations, and universities alike have in the past two decades begun efforts to encourage more women to run for political office. Indeed, as of fall 2013 the advocacy Web site ElectWomen.com listed more than 20 such programs in the United States.Footnote 7 The effectiveness of these programs has as of yet not been studied. While it seems reasonable to expect training seminars to make more efficacious women candidates, it is not clear whether or not such events themselves lead to more women running for office, or even whether or not we should expect them to do so. Some level of political interest seems to be prerequisite for women to enroll in candidate training, and the existence of those programs is likely insufficient to address a widespread misperception among the public that women candidates are disadvantaged.
A mass informational campaign may hold greater promise in this area. Specifically, the provision of overt information to the public regarding women's success as candidates—in terms of both fundraising and vote receipts relative to men—might be sufficient to cause a shift in opinions about the efficacy of women candidates. This claim is not new. Lawless and Fox (Reference Fox, Carroll and Fox2010, 174) suggested that the dissemination of basic information regarding women's success as candidates might help to overcome the ambition gap between women and men, encouraging more women to run for office by helping them to believe that they could win. The provision of direct, factual information about women's actual efficacy as candidates therefore holds the potential to affect mass perception not only of the electoral fortunes of women in general, but also about individuals' own qualifications for office and, by extension, their perception of the likelihood that they would win an election.
There is some reason for skepticism regarding the likely efficacy of informational treatments, however, as misperceptions can be difficult to correct among the mass public. The evaluation of factual information is often dependent upon one's preexisting opinions about the state of the world, as people engage in “motivated reasoning” in which evidence that supports their viewpoint is internalized while contrary facts are disregarded (see Taber and Lodge Reference Taber and Lodge2006). As a result, individuals have greater command of facts that are consistent with their worldview than those that are not (Jerit and Barabas Reference Jerit and Barabas2012). Perhaps most problematic, efforts to correct misperceptions with factual political information often fail to cause much change in the beliefs that people retain and in some cases can lead to a “backfire effect” in which the misperception becomes further entrenched (Nyhan and Reifler Reference Nyhan and Reifler2010).
Given the apparently sticky nature of misperceptions, it is not immediately clear whether a single informational treatment should be expected to impart an effect on entrenched respondent attitudes, such as those we expect regarding the relative efficacy of women candidates. Even more important, should an informational treatment in fact cause a shift in mass beliefs about the efficacy of women candidates, the extant literature provides little guidance on whether such an effect should be expected to be permanent. If information provision is intended to affect mass belief about women's success as candidates in a meaningful way, retention of the new facts over a period of time is equally as important as acquiring them. Thus, efforts to examine whether information can correct misperception about women candidates should include an attempt to study whether the effects of the treatment (if there are any) decay over time.
RESEARCH DESIGN AND MEASUREMENT
We conducted a survey experiment coupled with a panel survey design using an online convenience sample of U.S. residents recruited using Amazon.com's Mechanical Turk (MTurk) interface to assess both how people view the efficacy of women candidates and whether or not an external stimulus can affect those views. MTurk is an online platform for recruiting and paying subjects to perform tasks, such as taking surveys with embedded experiments. The MTurk population—anyone who signs up through Amazon to be a “Worker” on MTurk—is a convenience sample that appears to be more representative of the larger U.S. population than student samples but is not completely representative of the U.S. population. For instance, MTurk samples are typically younger, less likely to own a home, and more likely to report no religious affiliation (see Berinksy, Huber, and Lenz Reference Berinksy, Huber and Lenz2012; also see Buhrmester, Kwang, and Gosling Reference Buhrmester, Kwang and Gosling2011 for a discussion of using MTurk to recruit participants for experiments). Berinsky, Huber, and Lenz (2012) illustrate MTurk's usefulness for conducting experiments in several ways, chief among them replicating important published experimental work that used both student and national samples (e.g., the General Social Surveys).Footnote 8
We first recruited 800 participants to take a short survey of approximately five minutes in length.Footnote 9 After completing an informed consent page, all participants were asked to view a video to test their audio and video capability. Only those participants who passed the audio and video screener were permitted to continue with the survey.Footnote 10 Participants next answered some questions to ascertain demographic and political characteristics and were then randomly assigned to either a control group in which respondents did not watch another video (25%) or to a treatment condition in which they watched an informational video (75%).Footnote 11 The full battery of survey questions is included as Appendix A. The only difference between the surveys for the treatment and control groups is that the treatment group watched the informational video described below.
Respondents who were assigned to view the brief (approximately two and a half minutes)Footnote 12 informational video were shown a title slide (“Women as Candidates”), followed by three charts. There was also a voice-over narrative, performed by a radio professional in a neutral tone. In the first chart, respondents saw average fundraising totals for women and men running for the U.S. House in 2008, by party and incumbency, as reported in Fox (Reference Fox, Carroll and Fox2010). The chart shows that in three of four groupings, women raised more money on average than their male counterparts. The second chart portrays the same candidate segmentations (party and gender) as in the first but shows the percentage of candidates who won elections to the U.S. House between 1992 and 2008. Once again, in three of the four groupings, women appear to do better than men. Finally, the third chart depicts the percentage of Lawless and Fox (Reference Fox, Carroll and Fox2010) survey respondents who reported winning their election to state and local offices, by gender. As in the previous chart, women appear to win slightly more often. Thus, the video presents a narrated description of campaign data showing that, controlling for incumbency, there is little reason to believe that women are disadvantaged due to their gender. (We include the video script and relevant slide images as Appendix B.)
After watching the video (or, after only answering the demographic and political questions if assigned to the control group), respondents were first asked how well qualified they thought they were to run for public office, how likely they would be to win, and a political participation battery (see Appendix A for question wording). The primary response we are interested in, however, is to the following question, which was asked approximately 30–45 seconds after treatment group participants watched the video: “All else being equal, how do you think the chances of winning a public office compare between a female candidate and a male candidate?” Participants could select from three response options: (1) “The female candidate has a greater chance of winning.” (2) “A male and female candidate stand the same chance of winning.” (3) “The male candidate has a greater chance of winning.”
We also conducted a follow-up study in which each respondent who participated in the initial survey was contacted (through MTurk) to participate in a second survey.Footnote 13 Approximately 50% of our initial respondents participated in the follow-up study, which is in line with other work that has used MTurk for panel designs (see Berinsky, Huber, and Lenz 2012; Buhrmester, Kwang, and Gosling Reference Buhrmester, Kwang and Gosling2011).Footnote 14 The follow-up survey, which was fielded about two to three weeksFootnote 15 after the initial survey, enables us to ascertain the extent to which any immediate effects of the intervention decay over a period of time (about two weeks for most participants), an area of growing scholarly concern in the area of survey experiment research (see Chong and Druckman Reference Chong and Druckman2010; Druckman, Fein, and Leeper Reference Druckman, Fein and Leeper2012), and experimental (see Gerber et al. Reference Gerber, Gimpel, Green and Shaw2011) and survey (see Hill et al. Reference Hill, Lo, Vavreck and Zaller2013) research more generally.
To be clear, we seek to engage three questions with this design. First, we determine the extent to which the public downgrades the electoral viability of women as candidates. Second, by comparing responses from the treatment and control groups in Wave 1, we assess whether the informational intervention changed perceptions of women's chances of winning office. Third, by comparing responses from the treatment and control groups in Wave 2, we determine whether any such changes persisted over time.
ANALYSIS
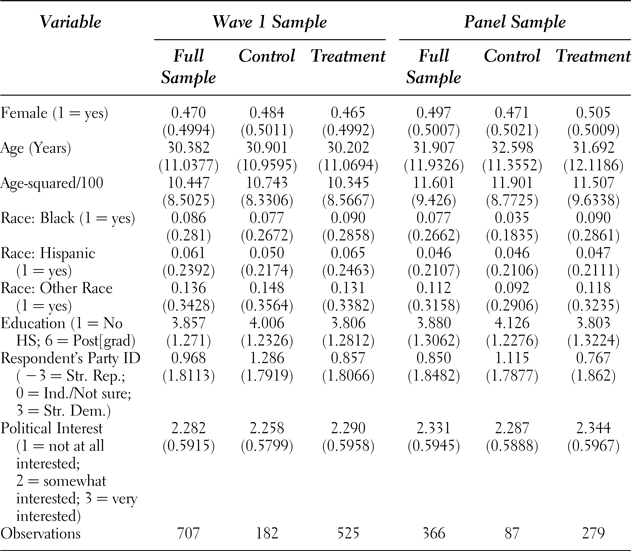
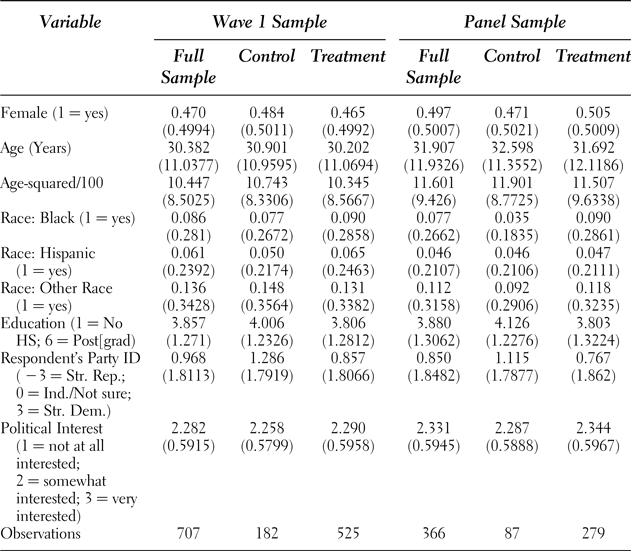
Before presenting our results, we note that in Appendix C we report summary statistics for demographic and political characteristics of our respondents. We do so for the entire sample of 707 respondents who completed Wave 1 and then separately for the 366 respondents who completed both Wave 1 and Wave 2 (what we refer to as our “panel sample”). Two details deserve mention. First, the demographic and political characteristics of the panel sample appear representative of the larger Wave 1 sample.Footnote 16 Second, Appendix C also displays the summary statistics separately for the control and treatment groups for both the Wave 1 sample and the panel sample. We tested for balance between the treatment and control groups using a logit model with the treatment condition serving as the outcome variable and the variables listed in Appendix C (gender, age, race, education, party identification, and political interest) as covariates. We performed this analysis separately for the Wave 1 sample and the panel sample. The p-value for the chi-square statistic was 0.0930 for the Wave 1 sample and 0.0526 for the panel sample.
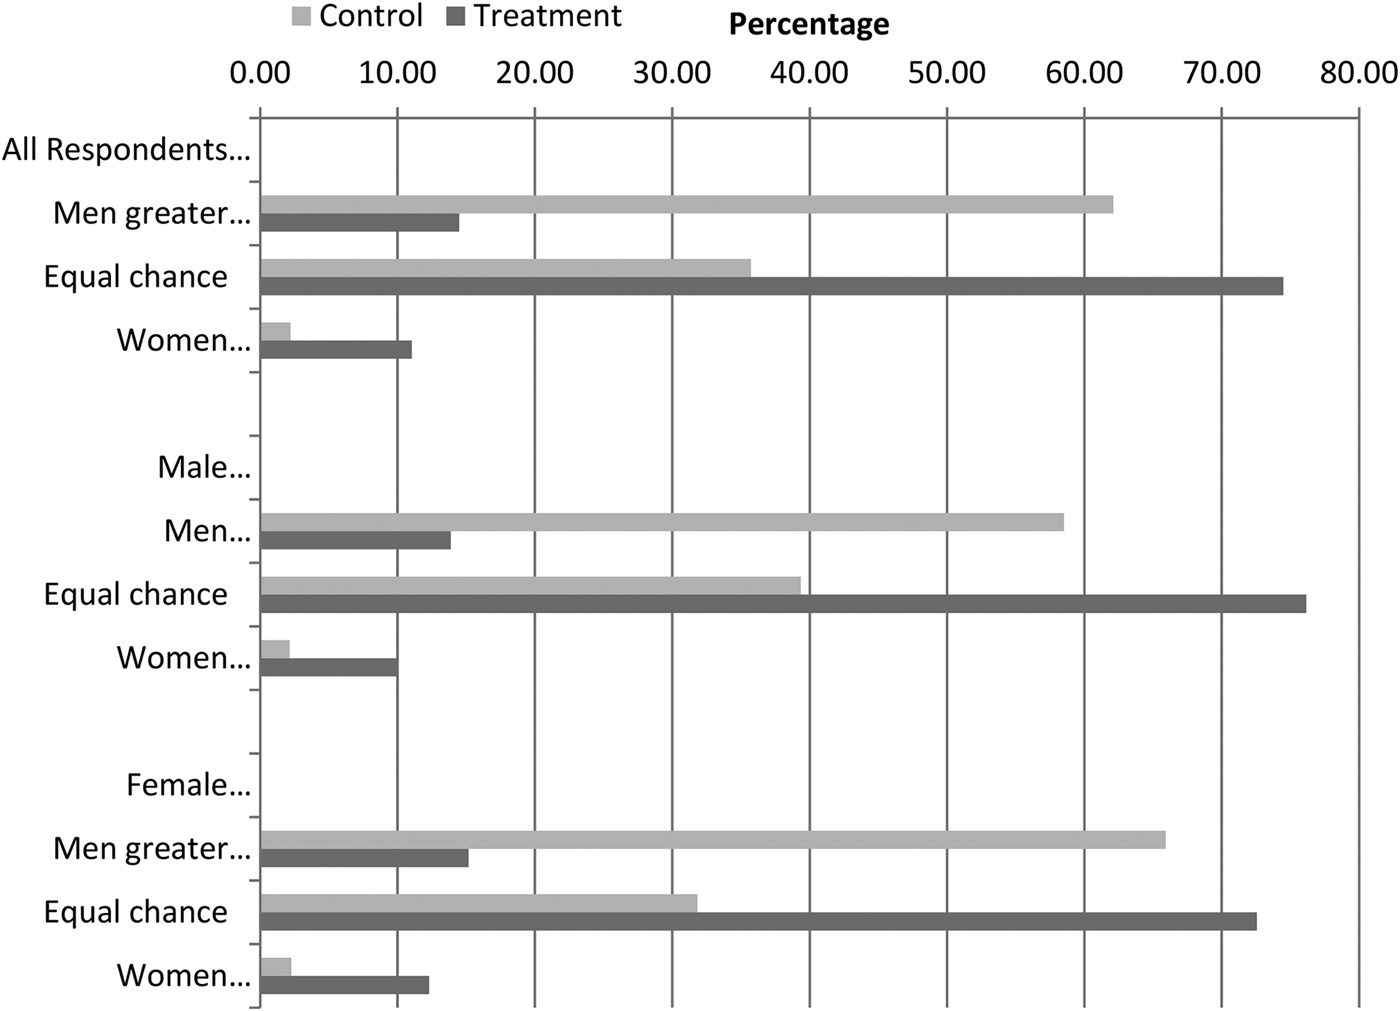
Figure 1 displays the percentage of respondents in our control (light gray bars) and treatment (dark gray bars) groups who selected each response option; responses are depicted both overall and by respondent gender. The figure shows that a majority of all respondents in the control condition (light gray bar)—regardless of gender—believe that male candidates have a greater chance of winning. Overall, 62% of respondents in the control group said that men were more likely to win. In contrast, about 36% of control group respondents stated that male and female candidates have an equal chance of winning (“all else being equal”), while only 2% (4 respondents of 182) in the control condition believed that female candidates have a greater chance of winning. Thus, although previous work has shown that prospective women candidates believe they face poorer election prospects than men (Lawless and Fox Reference Fox, Carroll and Fox2010), our data suggest that these beliefs are also held in the general population.Footnote 17 Also consistent with Lawless and Fox's (Reference Fox, Carroll and Fox2010) survey of prospective candidates, we, too, find a gap in these perceptions between men and women. Specifically, women in the control condition were approximately six percentage points more likely than men to think that male candidates have a better chance of winning than female candidates (65.9% vs. 58.5%).Footnote 18
Belief about whether or not men and women have an equal chance of winning, by experimental condition. Question wording included in Appendix A.

Immediate Effect of the Intervention
The above analysis—perhaps not surprisingly—suggests that the public downgrades the chances of women candidates, all else equal, and that women assess the prospects of women candidates a little more negatively than men. Having established that the public believes women have less promising election prospects than men, we now turn to whether these beliefs can be updated with factual information about candidates for office—that is, did people believe the information contained in our short video enough to change their opinions?
Figure 1 suggests that they did, displaying a rather sizeable treatment effect. Among all respondents who completed Wave 1 of our survey, nearly 75% of people assigned to watch the video thought that men and women had an equal chance of winning an election (compared to only 36% in the control group). More people also responded that women had a greater chance of winning in the treatment group than the control group—11% vs. 2%. Moreover, both men and women were moved by the intervention, as the bottom two portions of Figure 1 show. Of the men in the treatment group, 76% said that men and women have an equal chance of winning, with only 14% saying that men had a greater chance of winning. Among women, 73% of those assigned to the treatment group said men and women have an equal chance of winning, while only 15% said men had a greater chance of victory. In sum, for both men and women, the intervention had a large immediate effect on views about the efficacy of women candidates.Footnote 19
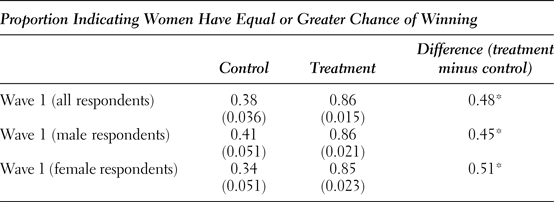
The effect of the intervention was also statistically significant. For this and the remaining analysis we collapse the “equal chance of winning” and “women have a greater chance of winning” responses to one category because so few respondents select the “women have a greater chance of winning” option, regardless of treatment assignment. In other words, we combine respondents who said either that men and women had an equal chance of winning or that women had a greater chance of winning, creating a variable that is a proportion. Table 1 displays these results for the immediate effect of the intervention.
Immediate effect of the intervention (Wave 1 sample, n = 707)

Notes: Cell entries are proportions with standard errors. For all respondents, 182 are in the control group; 525 are in the treatment group. For male respondents, 94 are in the control group; 281 are in the treatment group. For female respondents, 88 are in the control group; 244 are in the treatment group.
*p < .01, two-tailed. Tests of statistical significance based on difference of proportions tests.
Table 1 shows that for all respondents (the first row of results) about 86% of the treatment group indicated that women have an equal or greater chance of winning compared to only 38% of the control group. The last column of the table then indicates that this difference of 48 percentage points is statistically significant (p < .001). The other two rows of results reported in Table 1 indicate that the treatment had a statistically significant and sizable effect for both male and female respondents—differences of 45 and 51 percentage points, respectively (both p < .001). Moreover, the six percentage point difference between these differences (51–45) is not statistically significant (p = .364), suggesting that the treatment had a roughly equal effect on both male and female participants.
Persistent Effect of the Intervention
The informational treatment was designed to challenge respondent beliefs about the efficacy of women as candidates. It should therefore not be surprising that exposure imparted a large, positive, statistically significant effect on participants' evaluation of the likely success of women candidates in our outcome measure, which we solicited less than one minute after exposure to the information. A key question, however, is whether the effect of our intervention persists. An understanding of the enduring nature of treatment effects would seem useful for the development of an effective information dissemination campaign in this area: It is one thing to momentarily alter people's perceptions of female candidates' prospects for office, but quite another to move them permanently.
Our panel design enables us to test whether the informational treatment prevailed against conventional wisdom once some time had passed. In our follow-up survey, we repeated the same question as in the first: “All else being equal, how do you think the chances of winning a public office compare between a female candidate and a male candidate?” The second survey, in which approximately 50% of our initial respondents participated about two to three weeks after the first survey, contained no mention of the video, nor did it include any other information about candidate gender or determinants of electoral success.
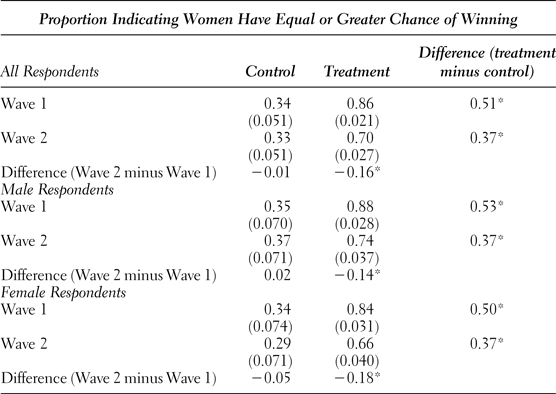
In Table 2, we summarize the results from the 366 respondents who participated in both waves of the survey (i.e., our panel sample). The top row of Table 2 displays the mean percentage of participants who said either that men and women had an equal chance of winning or that women had a greater chance of winning during Wave 1, but for only those participants who are part of the panel sample. Importantly, the initial treatment effect among our panel sample is similar to that of the entire Wave 1 sample reported in Table 1. In Table 1 we reported a difference of 48 percentage points between the treatment and control groups; in Table 2 we report a difference of 51 percentage points. In other words, our sample of panel participants appears to be representative of our larger (Wave 1) sample in terms of their response to our outcome measure immediately following treatment, suggesting that any persistent effect in the panel sample should be reflective of the larger sample.
Persistent effect of the intervention (panel sample, n = 366)
Notes: Cell entries are proportions with standard errors. For all respondents, 87 are in the control group; 279 are in the treatment group. For male respondents, 46 are in the control group; 138 are in the treatment group. For female respondents, 41 are in the control group; 141 are in the treatment group.
*p < .01, two-tailed. Tests of statistical significance based on difference of proportions tests.
The second row of Table 2 displays mean responses to the same question for our panel sample, but for their response at Wave 2. Here, we still observe a sizable treatment effect of about 37 percentage points (p < .001). Although the treatment effect does persist, it is statistically significantly smaller. Specifically, the percentage of respondents in the treatment group who said women have an equal or greater chance of winning was 16 percentage points less (p < .001), down to 70% from 86%. Coupled with the fact that we observe virtually no movement in control group respondents (34% at Wave 1 vs. 33% at Wave 2, p = .873), this suggests that the effect of our intervention diminished by about 30% in a relatively short period of time (about two to three weeks).Footnote 20 The fourteen percentage point difference-in-differences (51–37) is statistically significant (p = .01). Moreover, the treatment effect decay was roughly equivalent for both male and female respondents. The bottom two panels of Table 2 indicate no statistically significant movement among male or female respondents in the control group, but they do indicate significant declines among treatment group respondents—14 and 18 percentage points for male and female respondents, respectively (p < .01 for both).
To be clear, the informational treatment spurred short-term learning about the electoral fortunes of women, and much of this learning was still evident two weeks later without exposure to additional information. So, while the treatment group was significantly less likely to indicate that women have an equal or greater chance of winning an election at Wave 2 compared to Wave 1, the treatment group was still significantly more optimistic about the electoral fortunes of women candidates than the control group after two weeks had elapsed since viewing the information.
DISCUSSION
Previous analysis has found a wide gap between men and women when it comes to political ambition. One apparent component of this gap is the fact that women consistently underestimate both their own qualifications and the likelihood that they would win (if they ran). Yet, there is little evidence from campaign finance records or election results supporting the notion that women raise less money or receive fewer votes than their male counterparts, accounting for relevant confounding factors, such as incumbency status. Thus, bridging the space between the conventional wisdom and observed trends holds some potential for easing the gaps in ambition and self-assessment of qualifications as a candidate.
In this study, we took a first step at ascertaining the extent to which the public downgrades the chances of women candidates vis-à-vis men and how information affects public opinion in this area. Using an online survey administered via Amazon's MTurk, we found that only about 38% of respondents in our control group believed that all else equal, a man and a woman have an equal or greater chance of winning an election. In comparison, when we showed participants an informational video demonstrating that women do indeed perform comparably to men, this percentage rose to almost 86%. When we repolled the same respondents two to three weeks later, we found that the treatment effects had decayed somewhat—by a factor of about one-third—but remained substantively and statistically significant. In short, after two weeks and with no additional information, the majority of participants who viewed the video were able to recall that, all else equal, women run on par with men.
Our findings suggest that while the public does downgrade the viability of women candidates, it is receptive to contrary information in this area. Moreover, conventional wisdom about women candidates appears to be insufficiently strong to completely overcome a robust informational treatment such as the one we provided after the passage of a meaningful period of time. (As a point of comparison, Gerber et al. [2011] reported that the effects of television and radio advertising almost entirely decayed within one week in their field experimental study.) Taken together, our findings demonstrate that an information campaign holds some potential to change attitudes about women candidates, with possible ramifications for women who might run. If women are less likely to run due to an unfounded belief that women lose more often than men, an information campaign might encourage more women to run by bridging the gap between conventional wisdom and observed outcomes.
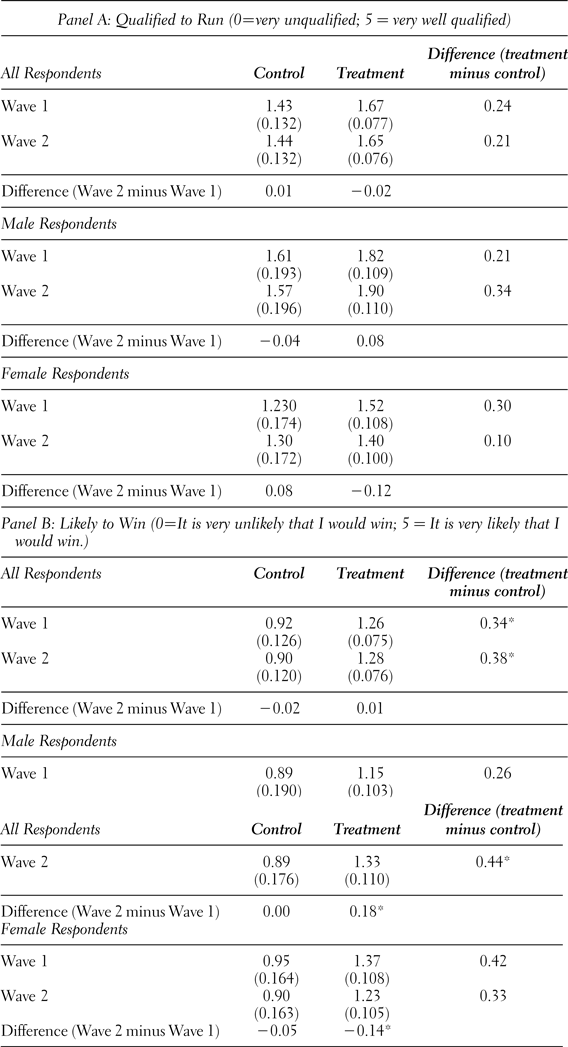
Two other questions we asked after our intervention provide some suggestive evidence that an information campaign might encourage more women to run. Specifically, we asked respondents “how well qualified” they thought they were “to run for public office,” and if they were to run for public office, how likely they thought they would be to win. Complete question wording is included in Appendix A. We asked these questions on both surveys so that we can perform an identical analysis for each question to the one we present above for our primary outcome of interest. In particular, we replicate the analysis presented in Table 2—focusing on the panel sample—for each question. Because each question had six response options, Table 3 presents means on a scale that ranges from 0 (“very unqualified” or “it is very unlikely that I would win”) to 5 (“very well qualified” or “it is very likely that I would win”) for each question.
Persistent effect of the intervention on measures of political efficacy (panel sample, n = 362)
Notes: Cell entries are means with standard errors. For all respondents, 86 are in the control group; 276 are in the treatment group. For male respondents, 46 are in the control group; 136 are in the treatment group. For female respondents, 40 are in the control group; 140 are in the treatment group.
* p < .05, two-tailed. Tests of statistical significance based on difference of means tests.
The results displayed in Table 3 suggest that our intervention did increase the perceived efficacy of respondents, specifically on our measure of how likely respondents thought they would be to win an election (Panel B of Table 3). For all respondents, the treatment group average for the “likely to win” item was about .34 units (about one-third of a standard deviation) higher than the control group average immediately after the treatment and then about .38 units higher in the follow-up survey (both p < .05). This pattern is present for both male and female respondents; however, the effect for female respondents decayed (by about .14 units, p < .05), whereas the effect for male respondents increased by about .18 units (p < .05). We had no a priori expectation that this pattern would occur, but we note that the same pattern is observed in Panel A for our measure of how qualified respondents thought they would be to run for office—treatment effect decays for female respondents but increases for male respondents, except that the differences between the treatment groups are not statistically significant at conventional levels (p = .303 for the .08 unit shift among male respondents; p = .078 for the −.12 unit shift among female respondents). Obviously, reporting in the survey context increased belief that one can win an election is very different from considering this possibility in the real world. Therefore, future analysis, including field experiments incorporating sustained information campaigns, will be useful in determining the extent to which factual information can help overcome the gender-driven gaps in political ambition and candidate emergence.
APPENDIX A
Question Wording
Wave 1 (July 26 to August 1, 2012)
How interested are you in politics and current events?
( ) Very interested
( ) Somewhat interested
( ) Not at all interested
What is the year of your birth?
<drop-down menu>
What is your gender?
( ) Female
( ) Male
What is the highest level of education you have achieved?
( ) no high school diploma
( ) high school graduate
( ) some college, no degree
( ) 2-year college degree
( ) 4-year college degree
( ) post-graduate degree
What racial or ethnic group or groups best describes you?
[ ] White
[ ] Black
[ ] Hispanic
[ ] Asian
[ ] Native American
[ ] Mixed
[ ] Other: _________________________________________________
Which state do you live in?
<drop-down menu>
Which statement best captures how you feel about people who run for political office?
( ) Most people who run for office are very well intentioned and genuinely hope to improve society.
( ) Most people who run for office are generally interested in their own fame and power.
Have you ever run or thought about running for public office?
( ) I have previously run for public office.
( ) I have seriously considered running for public office, but have not yet done so.
( ) I have given some thought to running for public office, but nothing serious.
( ) I have never thought about running for public office.
Generally speaking, do you usually think of yourself as a Democrat, a Republican, an Independent, or what?
( ) Democrat
( ) Republican
( ) Independent
( ) Other
<If Democrat>
Would you call yourself a strong Democrat or not a very strong Democrat?
( ) Strong Democrat
( ) Not very strong Democrat
<If Republican>
Would you call yourself a strong Republican or not a very strong Republican?
( ) Strong Republican
( ) Not very strong Republican
<If Independent or Other>
Do you think of yourself as closer to the Democratic party, closer to the Republican party, or equally close to both parties?
( ) Closer to the Democratic party
( ) Closer to the Republican party
( ) Equally close to both parties
We are interested in learning about your preferences on a variety of topics, including colors. To demonstrate that you've read this much, just go ahead and select both blue and red among the alternatives below, no matter what your favorite color is. Yes, ignore the question below and select both of those options.
What is your favorite color?
[ ] Black
[ ] Blue
[ ] Green
[ ] Orange
[ ] Pink
[ ] Purple
[ ] Red
[ ] White
[ ] Yellow
[ ] Something else
Informational Video Treatment (if assigned; control group goes to next question)
On the next page, you will be asked to watch a short (2 minutes and 30 seconds) video.
Please watch the video in its entirety before continuing with the survey. Thank you.
Generally speaking, how well qualified do you think you are to run for public office?
( ) Very well qualified
( ) Well qualified
( ) Somewhat well qualified
( ) Somewhat Unqualified
( ) Unqualified
( ) Very unqualified
If you ran for public office, how likely do you think it is that you would win?
( ) It is very likely that I would win
( ) It is likely that I would win
( ) It is somewhat likely that I would win
( ) It is somewhat unlikely that I would win
( ) It is unlikely that I would win
( ) It is very unlikely that I would win
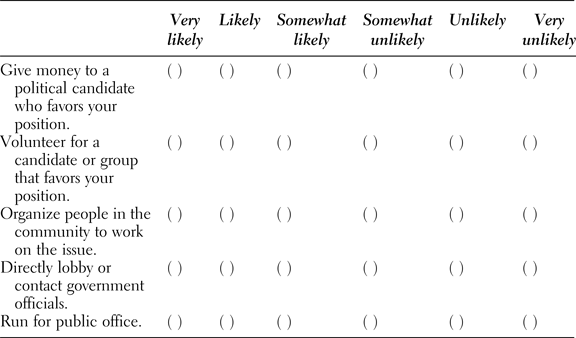
If you felt strongly about a government action or policy, how likely would you be to engage in each of the following political activities?
All else being equal, how do you think the chances of winning a public office compare between a female candidate and a male candidate?
( ) The female candidate has a greater chance of winning.
( ) A male and female candidate stand the same chance of winning.
( ) The male candidate has a greater chance of winning.
How likely are you to vote in the upcoming presidential election to be held this November?
( ) I definitely WILL NOT vote ( ) 1 ( ) 2 ( ) 3 ( ) 4 ( ) 5 ( ) 6 ( ) 7 ( ) 8 ( ) 9 ( ) I definitely WILL vote
Aside from this survey, how many political surveys have you taken through Mechanical Turk in the past month?
( ) None
( ) 1 to 2
( ) 3 to 5
( ) 6 to 9
( ) 10 or more
What did you think about the video you watched? Please provide any feedback you would like in the space provided below.
____________________________________________
____________________________________________
____________________________________________
____________________________________________
Did a male or female voice narrate the video you watched?
( ) Female
( ) Male
( ) Don't Remember
Wave 2 (August 10 to August 20, 2012)
Generally speaking, do you usually think of yourself as a Democrat, a Republican, an Independent, or what?
( ) Democrat
( ) Republican
( ) Independent
( ) Other
<If Democrat>
Would you call yourself a strong Democrat or not a very strong Democrat?
( ) Strong Democrat
( ) Not very strong Democrat
<If Republican>
Would you call yourself a strong Republican or not a very strong Republican?
( ) Strong Republican
( ) Not very strong Republican
<If Independent or Other>
Do you think of yourself as closer to the Democratic party, closer to the Republican party, or equally close to both parties?
( ) Closer to the Democratic party
( ) Closer to the Republican party
( ) Equally close to both parties
Generally speaking, how well qualified do you think you are to run for public office?
( ) Very well qualified
( ) Well qualified
( ) Somewhat well qualified
( ) Somewhat Unqualified
( ) Unqualified
( ) Very unqualified
If you ran for public office, how likely do you think it is that you would win?
( ) It is very likely that I would win
( ) It is likely that I would win
( ) It is somewhat likely that I would win
( ) It is somewhat unlikely that I would win
( ) It is unlikely that I would win
( ) It is very unlikely that I would win
If you felt strongly about a government action or policy, how likely would you be to engage in each of the following political activities?
All else being equal, how do you think the chances of winning a public office compare between a female candidate and a male candidate?
( ) The female candidate has a greater chance of winning.
( ) A male and female candidate stand the same chance of winning.
( ) The male candidate has a greater chance of winning.
How likely are you to vote in the upcoming presidential election to be held this November?
( ) I definitely WILL NOT vote ( ) 1 ( ) 2 ( ) 3 ( ) 4 ( ) 5 ( ) 6 ( ) 7 ( ) 8 ( ) 9 ( ) I definitely WILL vote
APPENDIX B
Women as Candidates: Informational Video Treatment
We deployed two videos, randomizing the gender of a professional narrator. The text and images in each video were the same, and both videos were 2 minutes and 26 seconds long. The videos began with an image of the title slide. The text read by the narrators appears below the slide over which it was heard.
Women As Candidates
As this video shows, women appear to be equally likely to win an election as men when they run. However, survey evidence suggests that compared to men, women are less likely to believe that they can win an election. The underrepresentation of women in Congress and lower levels of government, then, is most likely because women do not run for office at as high of rates as men. In order to increase the representation of women in government, more female candidates are needed.
Considering that only about 20% of Congress is comprised of women, it might be conventional wisdom in American politics that when women run for office, they lose at higher rates. However, when we examine the data, there is little reason to believe that female candidates face difficulties stemming from their gender alone.
This chart shows how much money candidates raised in the 2008 congressional elections. Looking at the Democratic candidates on the left, we can see that on average, female incumbents raised only slightly less than men, and female Democratic challengers actually outraised their male counterparts. Looking now at Republican candidates on the right, we see that female Republican candidates of both types raised more money than Republican men. And these patterns hold for most elections: all in all, there is very little data to support the idea that women raise less money simply due to their gender.
Similarly, women do not appear to face a disadvantage in terms of votes. This chart depicts the percentage of women and men who won their congressional elections between 1992 and 2008. It shows that while incumbents win much more often than challengers, men and women who are incumbents win at comparable rates. The same is true of challengers, and, if anything, Democratic women who challenge incumbents appear to do slightly better than Democratic men. So, accounting for incumbency, there is no evidence that women win less often than men.
The same is true at lower levels of government. This chart comes from a survey of state and local candidates in 2001 and shows that women face no systematic disadvantage at that level either. If anything, women reported winning at slightly higher rates than men.
In tandem, this chart and the previous one provide little evidence that female candidates are less likely to win elections due to their gender, nor is there much evidence that women raise less money.
APPENDIX C
Comparison of Wave 1 sample to panel sample, and by treatment and control group
APPENDIX D
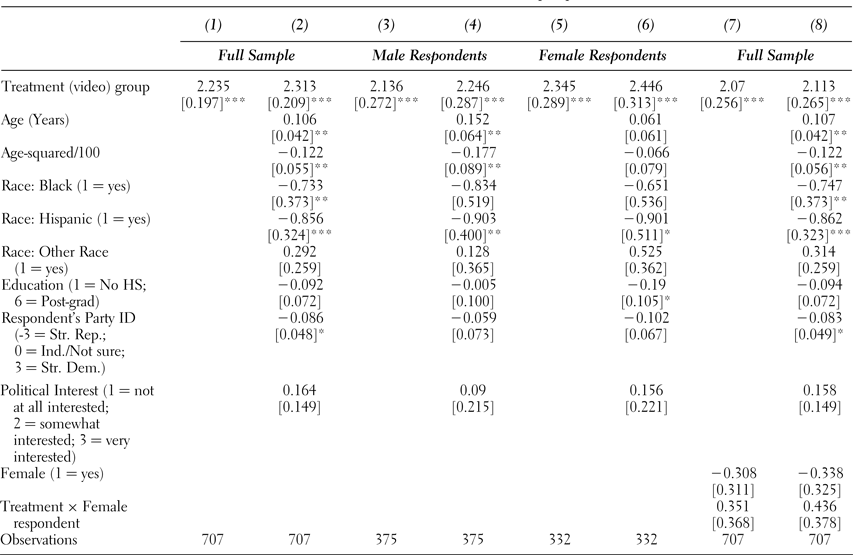
Effect of the intervention on beliefs about female candidates election prospects