


Introduction
The global rise in ultra-processed foods (UPFs) consumption has become a growing public health concern. UPF are defined commonly as industrial ready-to-eat formulations of food substances that have been extracted or refined from whole foods and usually contain other flavours and additives.(Reference Khandpur, Cediel, Obando, Jaime and Parra1) While there are different types of food classification systems proposed by researchers based on the degree of processing, the NOVA classification is the most widely adopted in nutrition research and epidemiological studies.(Reference de Araújo, de Moraes, Afonso, Santos and Rodrigues2) Over the past decade, the NOVA system has been extensively used to investigate associations between UPF consumption and diet quality, as well as a range of health outcomes.(Reference Marino, Puppo and Del Bo’3) Examples of UPF include breakfast cereals, packaged snacks, confectionery, sugar-sweetened beverages (SSBs), flavoured dairy products, and ready-to-eat meals such as chicken nuggets, instant soups and noodles. UPF are generally energy-dense, rich in free sugars, saturated fats, and sodium, while being low in protein, dietary fibre, and other micronutrients and phytochemicals. Their hyper-palatability, convenience, and wide availability contribute to their increased intake amongst various populations, especially children and adolescents, key target populations for the food industry.(Reference Martini, Godos, Bonaccio, Vitaglione and Grosso4)
A trend towards increased UPF consumption has been observed over the last two decades globally.(Reference Monteiro, Louzada and Steele-Martinez5) The 2025 Lancet series on UPFs and their impacts on human health showed that UPFs are now displacing traditional diets and account for up to 50–60% of total energy intake in many high-income countries, with consumption rising most rapidly in low- and middle-income countries (LMICs). Drawing on over 100 prospective studies, meta-analyses and cohort studies, the series presented strong and consistent evidence linking higher UPF intake to increased risk of obesity, type 2 diabetes, CVD, and several cancers, establishing UPF-dominant diets as key drivers of the escalating global burden of diet-related non-communicable diseases (NCDs).(Reference Monteiro, Louzada and Steele-Martinez5) Evidence from this series along with research conducted over the past two decades, has highlighted how children and adolescents, especially in LMICs, are particularly targeted through aggressive marketing, high affordability, and early exposures to UPFs, all of which may have lifelong impact on their eating patterns and risk of NCDs.(Reference Khandpur, Cediel, Obando, Jaime and Parra1,Reference Marino, Puppo and Del Bo’3) Researchers have long cautioned that early exposures to UPFs and highly sweetened foods and beverages can in fact alter the food preferences and eating patterns of children for life.(Reference Khandpur, Cediel, Obando, Jaime and Parra1)
Greater UPF intakes are also associated with poorer diet quality and increased risk of micronutrient deficiencies, partly due to the low content of key micronutrients including calcium, fibre, and vitamins A and D that are usually displaced by high sugar, sodium and fat content in highly processed and formulated food products and sugary drinks.(Reference Neri, Steele and Khandpur6) Additionally, UPF may contain additives and novel compounds that may disrupt the gut microbiome and affect health in ways that have not been adequately explored.(Reference Matos, Adams and Sabaté7) High UPF intakes have been also linked to other unhealthy behaviours, such as physical inactivity and sedentary behaviours, further contributing to the increased risk of overweight/obesity, NCDs, and all-cause mortality among children and adults.(Reference Nilson, Delpino and Batis8)
Studies from the Eastern Mediterranean Region (EMR) have previously documented a rapid nutrition transition characterized by a shift from traditional diets toward Western-style dietary patterns, which are known to be rich in UPF.(Reference Basha, Shalash, Wahdan and Abu-Rmeileh9) This shift has been previously associated with an increased risk of overweight and obesity along with other NCDs.(Reference Nasreddine, Kassis, Ayoub, Naja and Hwalla10,Reference Al-Jawaldeh, Taktouk and Nasreddine11) In Lebanon, a middle-income country of the Eastern Mediterranean basin, a parallel trend has been observed,(Reference Jomaa, Hwalla, Chokor, Naja, O’Neill and Nasreddine12,Reference Nasreddine, Hwalla, Saliba, Akl and Naja13) with the prevalence of overweight and obesity reaching 21.2% and 10.9%, respectively, amongst school-aged children and adolescents (6–19 years old).(Reference Nasreddine, Naja, Chamieh, Adra, Sibai and Hwalla14) Available studies have also highlighted a decrease in adolescents’ adherence to the traditional Lebanese Mediterranean dietary pattern, characterized by whole grains, vegetables, legumes and olive oil. At the same time, their diets have shifted toward Westernized patterns, characterized by higher fat and sugar intake, as well as increased consumption of processed foods and ready-to-eat meals including pizzas, pies, dough-based dishes, and SSBs.(Reference Naja, Hwalla and Hachem15,Reference Mitri, Boulos and Ziade16) While former studies have documented shifts in dietary patterns among children and adolescents, data on UPF intake and its determinants remain limited in the EMR. This study seeks to address this gap by: (1) characterizing food consumption patterns and UPF intakes among school-aged children and adolescents in Lebanon using the NOVA classification system; (2) examining the contribution of NOVA-defined food groups to daily intakes of selected nutrients; and 3) identifying factors associated with higher UPF intakes in this age group. The study is based on the nationally representative Lebanese Food and Nutrition Security Survey (L-FANUS) conducted in 2014–2015, which, although over a decade old, remains the most recent nationally representative food consumption survey among children and adolescents in Lebanon. The results may provide critical evidence to inform public health strategies targeting dietary behaviours in this population.
Methods
Study design
This study utilizes data from the national cross-sectional (L-FANUS) survey conducted between December 2014 and November 2015 in Lebanon. Detailed methods are described elsewhere.(Reference Jomaa, Naja, Kharroubi and Hwalla17) In brief, the survey comprised a nationally representative sample of Lebanese households with children aged 4–18 years, using stratified cluster sampling strategy. Households were the primary sampling units. The six Lebanese governorates served as sampling strata, and clusters were further selected at the level of the twenty-six districts (Cazas). In each district, households were selected using a probability proportional to size approach, with more households drawn from densely populated districts using data from the Lebanese Central Administration of Statistics.(18) The selection of households was carried out using a systematic sampling approach.
To be eligible for the survey, households had to include a mother and one child aged 4–18 years old at the time of the survey. If more than one child was eligible, one was randomly selected using the Kish method.(Reference Kish19) Both the mother and the child had to be of Lebanese nationality, not suffering from any chronic disease, and not taking any medication. Exclusion criteria included non-Lebanese nationality, chronic disease, inborn errors of metabolism, or physical malformation affecting dietary intake or body composition. Of the 4076 households contacted, 3147 agreed to participate (response rate = 77%) and 1221 met the eligibility criteria. Of these, 1209 completed the interview. For the present study, data from children aged 5–18 years were included in the final analysis (n = 1111).
Data collection
Data were collected through face-to-face interviews in the households by trained field workers (dietitians), with the mother as the main proxy. In case the mother was not available at home at the time of the household visit, the research team scheduled a follow-up visit to complete the interview in the presence of the mother. Interviews lasted approximately 45 min and gathered sociodemographic data on the child’s age and sex, mother’s educational level and employment status, father’s educational level and employment status, and household monthly income in Lebanese Pounds. Children’s physical activity was assessed using the modified version of the Children and Youth Physical Activity questionnaire.(Reference Corder, Van Sluijs, Wright, Whincup, Wareham and Ekelund20) According to the WHO recommendations for physical activity in young individuals, children were categorized as meeting the recommendations if they engaged in at least 420 min per week of moderate-to-vigorous activities, and as not meeting the recommendations if they did not.(21)
Dietary data
Dietary assessment was based on one multiple-pass 24-h recall, conducted using the United States Department of Agriculture (USDA) multiple-pass five-step approach: 1) quick food list recall, 2) forgotten food list probe, 3) time and occasion at which foods were consumed, 4) detailed overall cycle and 5) final probe review of the foods consumed.(Reference Moshfegh, Borrud, Perloff and LaComb22) Special attention was given to foods consumed at school. For young children, and if another caretaker was involved in feeding, the mother consulted them for additional information. Dietary intake data were analysed using Nutritionist Pro software (version 5.1.0, 2014, First Data Bank, Nutritionist Pro, Axxya Systems, San Bruno, CA, USA), while selecting the USDA database. For composite traditional Lebanese dishes, standardized recipes were added to the software using local food composition databases(Reference Yassine and Kamal23) allowing the estimation of daily energy (kcal), macronutrient, and micronutrient intakes. All recipes were later disaggregated into their individual ingredients, and foods and beverages were classified according to the NOVA Classification System of Food Processing.(Reference Monteiro, Cannon and Levy24) NOVA categorizes foods based on the extent and purpose of physical, biological, and chemical processing into four main groups: 1) unprocessed or minimally processed foods (UMPFs), 2) processed culinary ingredients (CIs), 3) processed food products (PFPs), and 4) UPFs.
Statistical analysis
Descriptive statistics were presented as frequencies and proportions for categorical variables. NOVA groups and subgroups’ intakes and their contribution to energy intake were estimated and compared across 3 age groups (5–8.9 years, 9–13.9 years, and 14–18.9 years) using Kruskal Wallis test (as the homogeneity of variance was violated). In the case of statistically significant differences between age groups, post hoc Dunn–Bonferroni test was utilized. The contributions of each NOVA group to select nutrients’ intakes (dietary fibre intake (per 1000 Kcal), percentage of energy from carbohydrates, total sugar, fat, saturated fat, protein, and intakes of micronutrients (per 1000 Kcal), including sodium iron, calcium, zinc, vitamin A, and vitamin C) were also estimated for the total sample and stratified by age group. Results were presented as means with 95% CIs.
Mean percent E intake (%E) from UPF was calculated across sociodemographic characteristics. To identify factors associated with UPF consumption, univariate and multivariate linear regression analyses were performed, with %E from UPF as the dependent variable. In addition to child’s age and sex, variables that showed statistical significance in the univariate analysis were included in the multivariate model. Also, %E from UPF was log-transformed due to violation of normality assumption. Accordingly, regression coefficients represent relative differences in UPF intake rather than absolute changes and can be interpreted as percentage change using (eβ − 1) × 100. Both unadjusted and adjusted coefficients with 95% CI were presented.
The results in the present study were weighted to account for the effect of the cluster sampling technique used in L-FANUS. The weighted analyses were conducted using the statistical software package Stata/SE version 18. For this analysis, a p-value < 0.05 was considered statistically significant.
Ethics of human subject participation
The present study was approved by the Institutional Review Board at the American University of Beirut, and all procedures performed were in accordance with the ethical standards of the 1964 Declaration of Helsinki and its later amendments. Written informed consent was obtained from mothers prior to enrolment in the study and assent was obtained from all participating children above 6 years of age.
Results
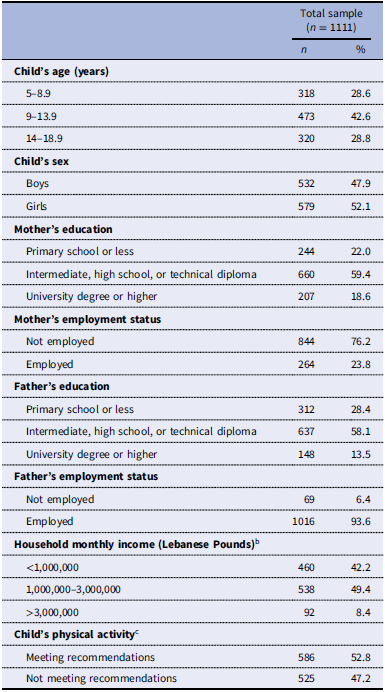
The sociodemographic characteristics of participants are presented in Table 1. The sample comprised approximately 29% of children aged 5–8.9 years, 43% aged 9–13.9 years, and 29% aged 14–18.9 years, with a balanced sex distribution. Most parents had intermediate to high school/ technical diploma education levels, with the majority of mothers not employed (76.2%). About 52.5% of the children met the WHO recommendations of at least 420 min per week of moderate-to-vigorous physical activity.
Sociodemographic characteristics of the study sample, based on a nationally representative survey, 2014–2015 a

Table 1. Long description
The table presents sociodemographic characteristics of participants with 1111 total samples. It includes data on childʼs age, sex, motherʼs education and employment status, fatherʼs education and employment status, household monthly income, and childʼs physical activity. The table has 10 rows and 3 columns. Column headers are ʼnʼ and ʼ%ʼ. Row labels include categories such as Childʼs age (5-8.9 years, 9-13.9 years, 14-18.9 years), Childʼs sex (Boys, Girls), Motherʼs education (Primary school or less, Intermediate, high school, or technical diploma, University degree or higher), Motherʼs employment status (Not employed, Employed), Fatherʼs education (Primary school or less, Intermediate, high school, or technical diploma, University degree or higher), Fatherʼs employment status (Not employed, Employed), Household monthly income (<1,000,000, 1,000,000-3,000,000, >3,000,000), and Childʼs physical activity (Meeting recommendations, Not meeting recommendations). Each row provides the count (n) and percentage (%) of participants in each category.
a Results are presented as frequencies and proportions.
b 1500 Lebanese Pounds are equivalent to 1 USD at the time of the survey.
c Children were classified as meeting or not meeting physical activity requirements if they engaged or did not engage in 420 min per week of moderate-to-vigorous activities, respectively, as per WHO recommendations of physical activity in young individuals(21).
Table 2 displays the intake and contribution of NOVA groups and their constituent food items to energy intake, by age group. Percent of energy intake (%E) from UPF ranged between 48.3% and 51.4% amongst children in our study sample, with pizzas, dough-based dishes, sweets, and fast food as main energy contributors. The contribution of UMPF to %E ranged from 23% to 25.9% and that of PFP from 16.5% to 16.9%. When comparing intakes across age groups, children aged 9–13.9 years had significantly lower %E from UMPF (23.0%) compared to those aged 5–8.9 years (25.5%). Within UPFs, children aged 5–8.9 years had higher contributions from breakfast cereals, ice cream, and fruit drinks, but lower contributions from fast food and carbonated soft drinks, compared to older age groups. Children aged 9–13.9 years had higher contributions from dough-based products than those aged 5–8.9 years, and higher contributions from salty snacks than those aged 14–18.9 years. In contrast, adolescents aged 14–18.9 years had lower contributions from processed cheese spreads compared to younger age groups.
Mean energy intakes (kcal/day and %E) across the four NOVA food groups and their constituent food items, stratified by age group

Table 2. Long description
The table presents mean energy intakes in kcal/day and %E across four NOVA food groups and their constituent food items, stratified by age group. It includes three age groups: 5-8.9 years, 9-13.9 years, and 14-18.9 years. The table has 10 columns: Age group, Energy intake, Absolute (kcal/day), Relative (%E), Absolute (kcal/day), Relative (%E), Absolute (kcal/day), and Relative (%E). The rows are categorized into UMPF, Eggs, Fish and seafood, Fresh and dried herbs and spices, Fruits/Fresh fruit juices, Grains, Homemade soups and sauces, Legumes and beans, Meat, Milk and plain yogurt, Pasta, Rice, Unsalted nuts and seeds, Unsweetened coffee and tea, Vegetables, Water, CI, Animal fats, Plant oils, Table sugar, Other CI, PFP, Breads, Canned fish, Canned vegetables, Dairy products, Ham and other salted, smoked or canned meat, Homemade pudding, Salted nuts and seeds, Vegetables in brine, Wine and Beer, UPF, Breads with additives, Breakfast cereals, Cakes, cookies, bars, and biscuits, Candies, Carbonated soft drinks, Energy drinks, Fast Food, Fruit drinks, Ice Cream, Instant and canned soups, Luncheon Meat and Sausages, Manakeesh, pizzas, and pies, Milk-based drinks, Pastries, RTE or dry mix desserts, Salty snacks, Spread processed cheese, Other UPF. Each row lists the energy intake values for each age group.
%E: percentage of energy intake, UMPF: unprocessed and minimally processed foods, CI: culinary Ingredients, PFP: processed food products, UPF: ultra-processed foods.
a, b, a,b Means with different superscripts within the same row for either absolute mean intakes (kcal/day) or relative (%E) are statistically significant based on Dunn–Bonferroni post hoc test based on p-value < 0.05.
1 Includes poultry, lamb, and beef.
2 Includes butter, tallow, cream, kashta, and lard.
3 Includes molasses, honey, sugar syrup, rose syrup, and orange blossom water.
4 Includes salt, vinegar, flours, starches, tahini, yeast, sodium bicarbonate, dry wheat, and unsweetened cocoa powder.
5 Includes non-spread cheeses, labneh, shanklish, Arishe, and buttermilk.
6 Includes pickled olives, pickled eggplants, and pickled cucumbers.
7 Includes protein bread, toasted bread, kaak, French bread, Oatmeal bread, Apache bread, and buns.
8 Includes breaded chicken and fish, French fries, burgers, and sandwiches.
9 Includes presweetened coffee and tea, sweet snacks, margarine, mayonnaise, ketchup, mustard, sauces, frostings, jams, chocolate spread, peanut butter, dressings, and syrups.
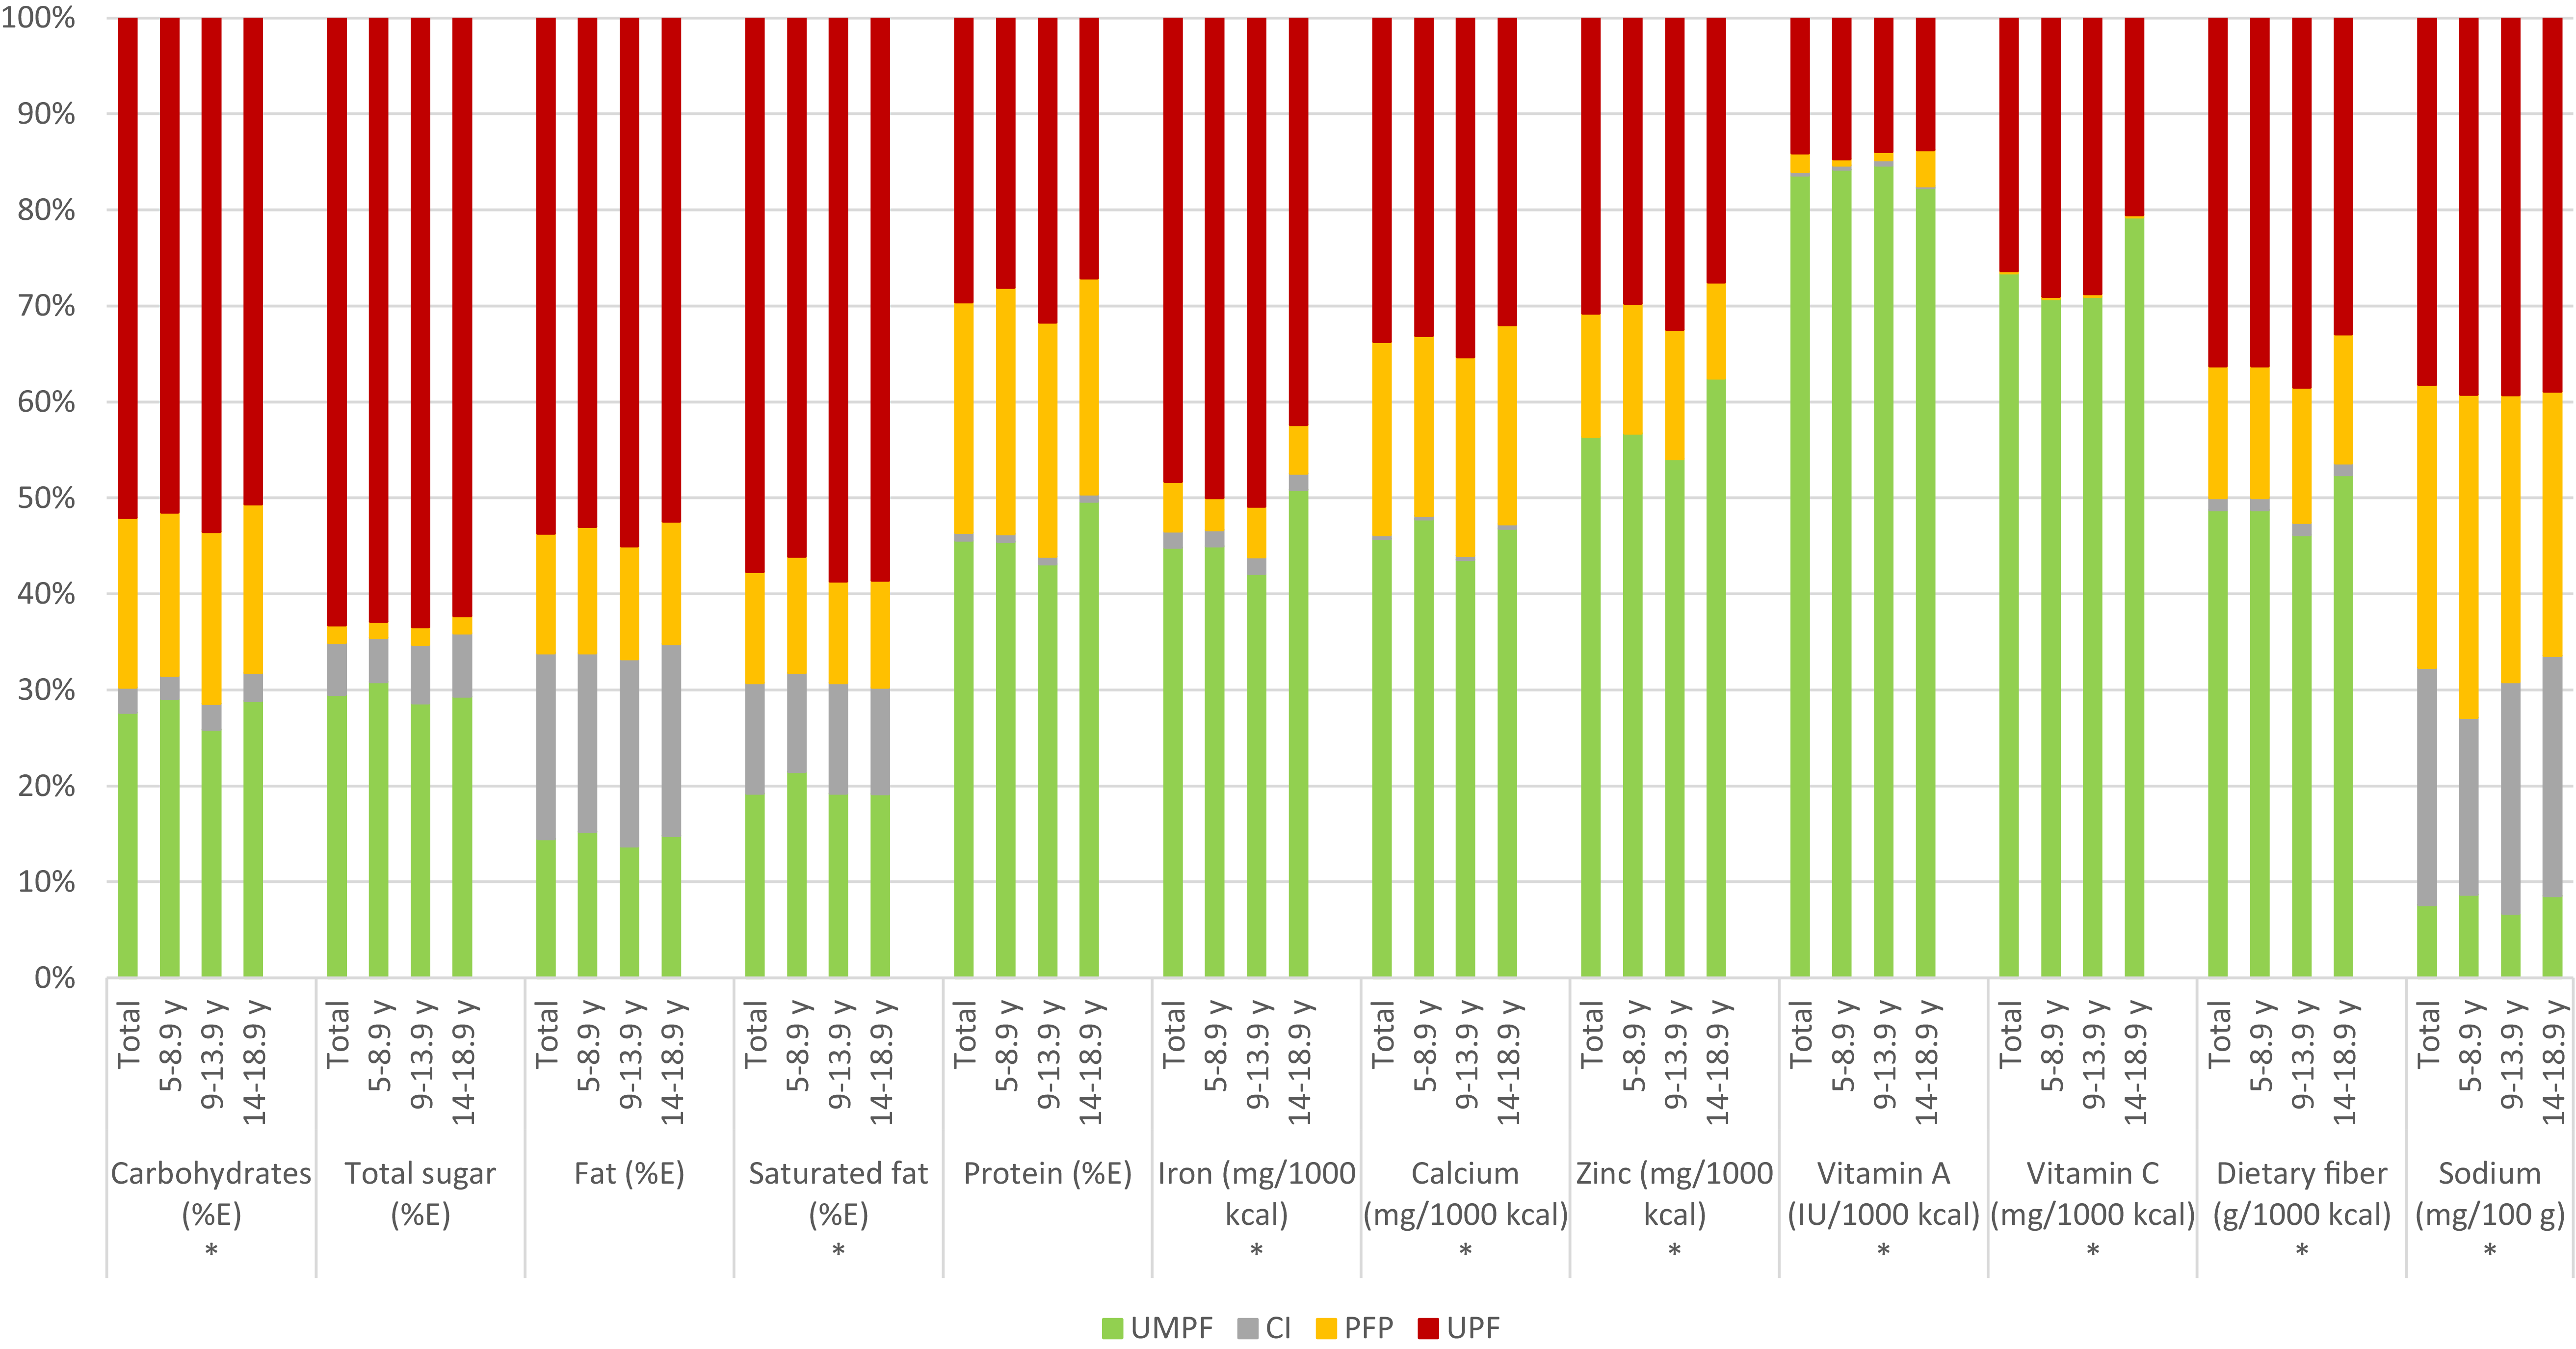
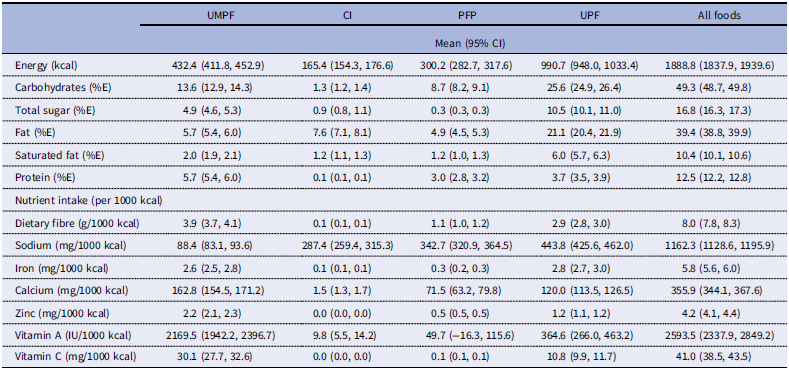
Mean intakes of selected macro- and micronutrients from the four NOVA food groups are shown in Table 3. Overall, UPF contributed most to carbohydrates, total sugar, total fat, saturated fat, sodium, and iron. Conversely, UMPF contributed most to protein, fibre, calcium, zinc, vitamin A, and vitamin C, and least to sodium. Age-specific analyses showed that UPF had significantly lower contributions to fibre, iron, calcium, and vitamin C in adolescents aged 14–18.9 years compared to those aged 9–13.9 years, and significantly lower contributions to iron, calcium, and vitamin C compared to those aged 5–8.9 years (Figure 1). Adolescents aged 14–18.9 years also had lower contributions of zinc from PFP than both younger age groups, and lower sodium contributions from PFP compared to 9–13.9 year olds. In contrast, children aged 5–8.9 years had higher contributions of carbohydrates and calcium from UMPF than those aged 9–13.9 years, and higher saturated fat contributions than those aged 14–18.9 years. Adolescents aged 14–18.9 years also had higher contributions of iron, zinc, fibre, and vitamin A from UMPF compared to younger children aged 9–13.9 years.
Mean nutrient intakes (per capita) from all foods consumed, stratified by NOVA food processing group and age category. *Indicates statistically significant differences in nutrient intakes between age groups within the same NOVA category (UMPF, CI, PFP, UPF) (p < 0.05). Specifically, differences were observed between children aged 5–8.9 and 9–13.9 years for carbohydrate and calcium intakes from UMPF, zinc intake from PFP, and iron, calcium, and vitamin C intakes from UPF, as well as between children aged 5–8.9 and adolescents aged 14–18.9 years for saturated fat intake from UMPF. Additionally, differences between children aged 9–13.9 and adolescents aged 14–18.9 years were identified for iron, zinc, vitamin A, and dietary fibre intakes from UMPF; zinc and sodium intakes from PFP; and iron, calcium, vitamin C, and dietary fibre intakes from UPF.

Figure 1. Long description
A stacked bar graph comparing nutrient intakes from different food processing groups across various age categories. The horizontal axis lists different nutrients: Carbohydrates, Total sugar, Fat, Saturated fat, Protein, Iron, Calcium, Zinc, Vitamin A, Vitamin C, Dietary fiber, and Sodium. The vertical axis represents the percentage of nutrient intake. The bars are grouped by age categories: 5-8.9 years, 9-13.9 years, and 14-18.9 years. Each bar is divided into four segments representing different food processing groups: UMPF (green), CI (yellow), PFP (orange), and UPF (red). The graph shows variations in nutrient intakes across different age groups and food processing categories. For example, UPF contributes significantly to the intake of total sugar, saturated fat, and sodium across all age groups. UMPF contributes more to the intake of dietary fiber and certain vitamins. The graph highlights statistically significant differences in nutrient intakes between age groups within the same NOVA category.
Mean nutritional intakes from the four food groups defined based on the NOVA classification system (per capita) (n = 1111)

Table 3. Long description
A table comparing nutritional intakes from four food groups based on the NOVA classification system. The table has 12 rows and 5 columns. The columns are labeled UMPF, CI, PFP, UPF, and All foods. The rows are labeled Energy (kcal), Carbohydrates (%E), Total sugar (%E), Fat (%E), Saturated fat (%E), Protein (%E), Dietary fibre (g/1000 kcal), Sodium (mg/1000 kcal), Iron (mg/1000 kcal), Calcium (mg/1000 kcal), Zinc (mg/1000 kcal), Vitamin A (IU/1000 kcal), and Vitamin C (mg/1000 kcal). Each cell contains numerical values representing the mean nutritional intakes and their confidence intervals. Notable trends include UPF contributing most to carbohydrates, total sugar, total fat, saturated fat, sodium, and iron, while UMPF contributes most to protein, fibre, calcium, zinc, vitamin A, and vitamin C, and least to sodium.
%E: percentage of energy intake, UMPF: unprocessed and minimally processed foods, CI: culinary Ingredients, PFP: processed food products, UPF: ultra-processed foods.
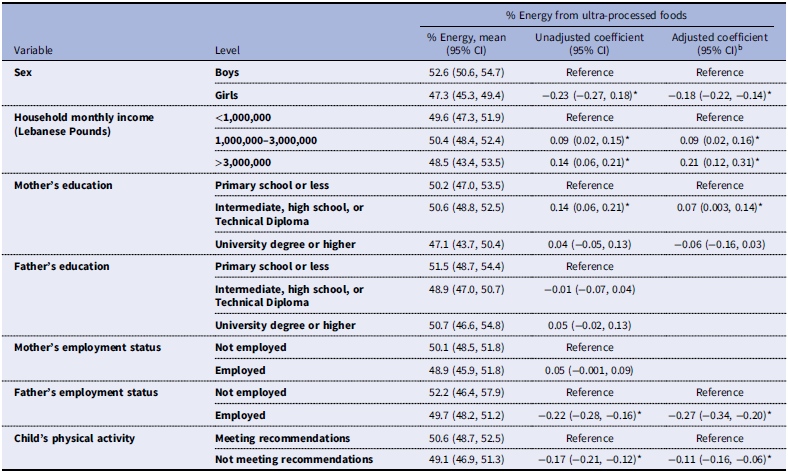
Table 4 presents the percentage of energy derived from UPF across sociodemographic and lifestyle factors, along with the adjusted regression results. Girls and children with employed fathers had significantly lower UPF intake. While there was no significant association between mothers having a university degree (or higher) and the percentage of energy from UPF, children whose mothers had an intermediate, high school, or technical diploma consumed a higher proportion of energy from UPF (50.6%) compared to those whose mothers had a primary school education or less (50.2%). Furthermore, higher monthly household income was positively associated with UPF consumption. Conversely, children not meeting physical activity recommendations had significantly lower intake of UPF.
Factors associated with ultra-processed foods intake expressed as percent energy intake among the study sample (n = 1111) a

Table 4. Long description
The table presents data on the percentage of energy derived from ultra-processed foods (UPF) across different sociodemographic and lifestyle factors. It includes unadjusted and adjusted coefficients with 95% confidence intervals. The table has 10 rows and 6 columns. The columns are labeled as Variable, Level, % Energy, mean (95% CI), Unadjusted coefficient (95% CI), and Adjusted coefficient (95% CI). The variables include Sex, Household monthly income, Motherʼs education, Fatherʼs education, Motherʼs employment status, Fatherʼs employment status, and Childʼs physical activity. Each variable has different levels with corresponding mean percentages and coefficients. Notable trends include lower UPF intake among girls and children with employed fathers, and higher UPF consumption associated with higher household income. Children not meeting physical activity recommendations had significantly lower UPF intake.
a Coefficients are calculated after log-transforming ultra-processed foods intake as percent energy intake (dependent variable) and weighing the data to account for the effect of the cluster sampling technique used in L-FANUS survey.
b This model adjusted for child’s age, sex, household monthly income, mother’s education, father’s employment status, and the child’s physical activity level.
* p-Value < 0.05.
Discussion
This study is amongst the first from the EMR to characterize food consumption patterns amongst school-aged children and adolescents using the NOVA classification system. It further evaluates UPF intake levels and examines its association with sociodemographic and lifestyle factors. Our findings highlight worrisome patterns with high levels of UPF consumption, particularly among boys and older children. On average, UPF contributed to half of the daily energy intake of school-aged children and adolescents in Lebanon, with the main contributors including pizzas, dough-based dishes, sweets (cakes, cookies, candies, pastries), and fast food. The contribution of UPF to total energy intake of children and adolescents in Lebanon was found to be higher than that reported from European countries, whereby UPF accounted for 8.5–29% of energy among children in Italy,(Reference Ruggiero, Esposito and Costanzo25) Portugal,(Reference Morais, Rodrigues and Ferreira26) and Belgium.(Reference Vandevijvere, De Ridder, Fiolet, Bel and Tafforeau27) In fact, our results showed that UPF consumption in this small Mediterranean country were alarmingly closer to those reported from HIC, including Australia, UK, and the USA.(Reference Neri, Steele and Khandpur6) While previous studies suggest that the adherence to the healthy Mediterranean dietary pattern may be inversely associated with UPF consumption,(Reference da Rocha, Rico-Campà and Romanos-Nanclares28) recent studies from Lebanon and other EMR countries are showing that the traditional Mediterranean diet has been eroding across all life stages, and particularly amongst children and adolescents.(Reference Naja, Hwalla and Hachem15,Reference Naja, Itani, Kharroubi, Diab El Harake, Hwalla and Jomaa29) Naja and colleagues have previously reported significant decreasing trends in adherence to the Mediterranean diet amongst Lebanese adolescents between 1997 and 2015, driven mainly by a decline in the consumption of fruits and vegetables coupled with an increase in the intake of refined cereals and SSBs.(Reference Naja, Hwalla and Hachem15) In agreement with our findings, a recent study conducted in Jordan, another country of the EMR, showed that 40% of total energy of school-aged children (8–19 years) were derived from UPF sources, mainly savoury snacks and sweets, processed grain products, fast foods, and sweetened beverages.(Reference Al Hourani, Shhadeh and Al-Jawaldeh30)
Our study findings showed that UPF had the highest dietary contributions to carbohydrates, total sugar, total fat, saturated fat, sodium, and iron intakes. Conversely, UMPF provided the highest contributions to protein, fibre, calcium, zinc, vitamin A, and vitamin C intakes, while contributing the least to sodium. In addition, amongst older children (14–18.9 years old), UPF contribution to key micronutrients such as calcium, iron, and vitamin C was found to be significantly lower than their younger counterparts. In line with our findings, Morais et al.(Reference Morais, Rodrigues and Ferreira26) showed that higher UPF consumption was associated with lower intakes of fibre, magnesium, vitamin B12, vitamin A, vitamin D, and higher intakes of zinc and sodium among girls (9–16 years) in Portugal, while in boys it was linked to lower vitamin C and magnesium and higher total sugars, zinc, and sodium. Studies conducted in Mexico also showed that higher UPF intakes amongst school-aged children and adolescents (5–19 years) were significantly associated with increased intakes of added sugar, total fat, saturated fat, and overall dietary energy density; while being inversely associated with protein and dietary fibre intakes.(Reference Marrón-Ponce, Flores, Cediel, Monteiro and Batis31) These results further emphasize the risk of suboptimal dietary intakes and micronutrient inadequacies associated with high UPF consumption amongst children and adolescents in the region and worldwide.(Reference Neri, Steele and Khandpur6,Reference Nasreddine, Kassis, Ayoub, Naja and Hwalla10,Reference Vandevijvere, De Ridder, Fiolet, Bel and Tafforeau27)
These risks have been emphasized in the 2025 Lancet series,(Reference Baker, Slater and White32) which highlights that high UPF intakes may be driven, in part, by the aggressive promotion of processed foods. Such marketing has expanded beyond traditional media – such as television, radio, and billboards – to ubiquitous social media platforms that are particularly popular among youth. High UPF consumption among children and adolescents may also be linked to the ease of access to UPF in educational settings including day-care centres, schools and higher education institutions. In fact, transnational companies have been able to circumvent many of the nutritional standards for school meals and promote the sale of competitive foods within schools, as is the case in the USA,(Reference Khandpur, Neri and Monteiro33) and other LMICs where national regulations and guidelines are lacking or weakly enforced at best.(Reference Popkin, Barquera and Corvalan34) Thus, understanding the commercial determinants of health and the role that the industry plays in limiting policy responses and blocking regulations that aim at limiting their ubiquitous presence and advertisements are key to identifying policy actions and public health strategies needed to promote, protect, and support diets that are based on fresh, minimally processed foods.(Reference Baker, Slater and White32,Reference Scrinis, Popkin and Corvalan35)
Besides the overall high UPF consumption, sex- and age-based differences in UPF intakes were noted amongst children and adolescents in the present study. More specifically, girls had significantly lower contribution of energy from UPF compared to boys, after adjusting for confounders. Previous studies have shown mixed evidence as to whether the contribution of UPF to total energy intake may differ by sex. For instance, a study conducted amongst Italian children and adolescents (5–19 years) showed that boys consumed two-point percent more UPF of the total energy compared with girls,(Reference Ruggiero, Esposito and Costanzo25) whereas another study conducted in Portugal amongst 9–16 year-old children showed that the contribution of UPF to total energy intake was higher amongst girls (9.5%) versus boys (8.5%), respectively.(Reference Morais, Rodrigues and Ferreira26) Sex-based differences in food groups’ intakes were previously reported amongst Lebanese children and adolescents (6–20 years), whereby boys had significantly higher intakes of red and processed meat, bread, fast food, soft drinks, while girls had higher intakes of fruits, vegetables, milk, and sweets.(Reference Nasreddine, Chamieh, Ayoub, Hwalla, Sibai and Naja36) Similarly, authors previously demonstrated that boys were more likely to adhere to the Western dietary pattern, while females had higher adherence to the traditional Lebanese dietary pattern among both paediatric and adult population groups.(Reference Naja, Hwalla, Itani, Karam, Sibai and Nasreddine37,Reference Nasreddine, Shatila, Itani, Hwalla, Jomaa and Naja38) Sex-based differences in dietary intake may be attributed to a range of internal and external factors, including cultural and social norms that may promote certain eating behaviours amongst girls compared to boys. For example, adolescent girls may be more likely to consume more minimally processed foods, such as fruits and vegetables, and/or limit their intake of processed food, snacks and drinks due to sociocultural pressures, including ideals of thinness and heightened body image concerns that often emerge during adolescence as part of identity formation.(Reference Nasreddine, Chamieh, Ayoub, Hwalla, Sibai and Naja36) On the other hand, adolescent boys may be more focused on internal motivators, such as gaining autonomy, eating for enjoyment and/or improving their physical performances, and thus consuming more animal-based sources of protein such as red meat and its products, readily prepared foods and drinks, including energy and sports drinks.(Reference Deslippe, Bergeron and Cohen39) To address the different determinants of sex and age-based differences in UPF intake, studies have shown that tailored evidence-based nutrition education interventions and behavioural approaches along with providing healthier food environments and nutrition standards that are conducive of healthier food and beverage choices within schools, sports settings, and other extracurricular venues, are much needed to promote better diet quality and nutrition outcomes for children and youth, especially in LMICs.(Reference Samad, Bearne, Noor, Akter and Parmar40–Reference Durão, Wilkinson, Davids, Gerritsen and Kredo42)
The study has also identified other socio-economic factors associated with UPF intake, including father’s employment situation and household socio-economic status. More specifically, children whose fathers were employed consumed significantly less energy from UPF compared to children from families with unemployed fathers. Father’s education level was not found to be associated with UPF intake of children in the regression model, while maternal education was only partially associated with UPF intake. On the other hand, household income was found to be positively associated with the percentage of energy intake from UPF amongst the study sample. These results were in line with those reported earlier amongst younger Lebanese children (6 months–5 years) whereby children from households with higher income and with advanced parental education (primarily mothers) had higher consumption of UPF.(Reference Chokor, Ouaijan, Hwalla, Jomaa and Nasreddine43) Inequalities in UPF intakes amongst children have been reported across diverse contexts. Socioeconomically disadvantaged families, including those with unemployed parents, lower maternal education, younger mothers, migrant backgrounds, or lower household income, are often more likely to rely on UPF.(Reference Khandpur, Neri and Monteiro33) However, these patterns may vary by region and income level. For example, UPF and ready-to-eat foods may be cheaper and more affordable for economically disadvantaged and food insecure families as compared to healthier foods in HICs such as the USA,(Reference Marino, Puppo and Del Bo’3) Canada,(Reference Polsky, Jovovic, Nardocci and Moubarac44) UK.(Reference Aceves-Martins, Bates and Craig45) In contrast, in many LMICs, traditional, minimally processed foods like fruits, vegetables and legumes, may be more affordable and accessible than imported PFPs, although their prices are rising globally.(Reference Suchánková, Kapounova, Dofkova, Ruprich, Blahova and Kouřilová46) This may partly explain the high UPF consumption observed among higher-income households in the present study, who likely possess greater purchasing power to frequently access fast food outlets and procure a wider range of PFPs for their children. It is worth noting that Lebanon has been undergoing since 2019 compounded political, financial, and health crises, including the most recent war, worsening the food security and household purchasing power of large population groups in the country. These adverse conditions are argued to have further promoted access to cheaper and more readily available UPF amongst this vulnerable population group, jeopardizing the diet quality and nutritional status of children and youth. The present study also showed significant association between lower physical activity level and lower UPF intake. Although unexpected, such relationship has been previously described in the literature. For instance, it has been suggested that children and adolescents in low physical activity clusters may also have low UPF consumption due to shared underlying lifestyle patterns such as limited autonomy, highly structured environments (focused on academics, tutoring or traditional religious lifestyles), and caregiver-mediated meal planning.(Reference de Mello, Minatto and Costa47) It is important to note here that although the regression coefficients for all the examined associations in our study appear small due to the log-transformation of the outcome, they correspond to meaningful relative differences in UPF intake when expressed as percentage change.
The high UPF consumption observed amongst children and adolescents in our study may be a result of the nutrition transition that is unfolding in the EMR region, while also reflecting peculiarities related to this age group.(Reference Nasreddine, Ayoub and Al Jawaldeh48) As children grow into preadolescence and adolescence, they gain autonomy with their food choices at home and in other settings (schools, sports teams, and other extracurricular activities), and may have low motivation and self-efficacy to prepare healthy food options, and instead may rely more on consuming ready-to-eat meals and processed foods available elsewhere.(Reference Williams and Churilla49) In addition, children and adolescents are increasingly consuming more food outside of the home and are hence more likely to transition away from traditional home cooked food towards a more Westernized dietary pattern characterized by the higher intake of fast foods, SSBs, sweets, and snacks that are readily available in the market. Such consumption patterns may carry significant health implications. Studies showed that high UPF intake in children and adolescents would set them up for compounded dietary inadequacies and a higher risk of obesity and chronic diseases in the short term as well as later into adulthood. These health impacts may be explained by the deconstruction of the original food matrix during processing, the higher EI level, the high levels of added sugars and fats as well as the presence of additives that may reduce satiation, and contribute to low-grade gut inflammation, and dysbiosis.(Reference Neri, Steele, Rauber, dos Santos Costa, Benicio and Levy50) Other adverse outcomes from high intake of UPF among school-aged children have been also reported in the scientific literature and are worth further exploration. For example, there is growing interest in exploring the associations between dietary patterns including high UPF diets and academic achievement of children and adolescents.(Reference Burrows, Goldman, Pursey and Lim51) A study conducted amongst a sample of adolescents aged 12–17 years in Spain showed significant dose–response associations between UPF consumption and academic performance with higher intakes being associated with poorer grades on multiple academic achievement tests.(Reference López-Gil, Cisneros-Vásquez, Olivares-Arancibia, Yañéz-Sepúlveda and Gutiérrez-Espinoza52) Other studies have also suggested a link between higher consumption of UPF and increased risk of depressive symptoms and emotional disorders in children and adolescents, highlighting a potential connection between poor diet quality and adverse mental health outcomes in this age group.(Reference Adjibade, Julia and Allès53)
The current study has a number of strengths. Notably, it is the first to evaluate the dietary intakes of school-aged children and adolescents in Lebanon using the NOVA classification, while also exploring its association with nutrients’ intakes and sociodemographic factors. Another strength lies in the use of a culturally sensitive questionnaire, ensuring the relevance of the population under study. However, the findings must be considered within the context of certain limitations. First, the study sample is not representative of Lebanese households, as data for the current study were based on a nationally representative sample of Lebanese households with children 4–18 years old only. Second, household income per capita could not be reported as income data were collected categorically rather than numerically, limiting deeper socio-economic analysis. Future research should address this by incorporating income per capita and examining other socio-economic and neighbourhood characteristics when exploring UPF consumption patterns. Third, the study’s cross-sectional design restricts the ability to infer causality from the observed associations. Fourth, given the lack of a validated FFQ for Lebanese children and adolescents at the time of the survey, dietary intakes were assessed using a single 24-h recall, which may not entirely capture usual intake. Nevertheless, the research team took steps to enhance the accuracy of the dietary assessment by employing the standardized five-step USDA multiple-pass 24-h dietary recall method.(Reference Moshfegh, Rhodes and Baer54) Moreover, due to the lack of local food composition databases, the USDA database available in Nutritionist Pro was used for dietary intake analysis. For composite, mixed, and traditional Lebanese dishes, recipes were entered into the software by breaking them down into individual food ingredients.(Reference Yassine and Kamal23) In addition, as data collection was conducted in an interview setting, social desirability bias in the reporting of dietary intakes and physical activity cannot be excluded. However, data collection was conducted by trained dietitians, who participated in a five-day training workshop to decrease judgmental attitudes, maintain neutrality during interviews and standardize procedures. Regular meetings and follow-ups were also implemented to address any errors or inconsistencies, further ensuring the validity and reliability of the data collection process, including both dietary and anthropometric assessments. Another limitation worth noting is that the study was conducted a decade ago; dietary patterns may have shifted since then, with UPF consumption likely increasing over time in Lebanon, as observed in other LMICs.(Reference Monteiro, Louzada and Steele-Martinez5) Nevertheless, the associations between UPF intake and nutrient intakes amongst school-aged children in the present study remain insightful, considering the limited national surveys conducted since 2019 in Lebanon and the ongoing political, economic, and health crises that are further jeopardizing the nutritional status of children.(Reference Jomaa, Ouaijan and Nasreddine55) It can also be argued that the intake of UPF intake may have further increased over the years due to the rapid nutrition transition witnessed locally and regionally and the limited regulations for marketing of UPF to vulnerable age groups, including children and youth.(Reference Basha, Shalash, Wahdan and Abu-Rmeileh9–Reference Al-Jawaldeh, Taktouk and Nasreddine11) Finally, limitations of the NOVA classification should be acknowledged, including potential misclassification, heterogeneity within UPF categories, and ongoing debate regarding its ability to disentangle the effects of food processing from overall nutritional quality.(Reference Fardet and Rock56–Reference Scrinis58)
Conclusions
This study reveals alarmingly high consumption of UPF among Lebanese children and adolescents, accounting for about 50% of energy intake, with main UPF sources including dough-based products, sweets, and fast foods. The study has also contributed new evidence on the association between UPF consumption and nutrients’ intakes in the context of the EMR, a region that is undergoing rapid nutrition transition. It showed that UPF were the primary contributors to carbohydrates, total sugar, total fat, and saturated fat intakes, highlighting their potential adverse impact on cardio metabolic health in this population group. Factors associated with higher UPF intakes were identified and included child’s sex, household income, and father’s employment status. Urgent public health action is needed to reduce UPF intake through nutrition education, healthier school food environments, and stronger food marketing regulations. Promoting minimally processed, culturally appropriate diets is essential to improving nutrition and protecting the health of Lebanese youth.
Data availability statement
The datasets used and/or analysed during the current study are available from the corresponding author on reasonable request.
Acknowledgements
Authors would like to acknowledge all field workers and participants who were involved in the original survey ‘L-FANUS’.
Author contributions
L.J. contributed to conceptualization, methodology, and writing of the first draft. F.A.Z.C. contributed to formal analysis and writing the first draft. N.H. contributed to methodology and writing – review and editing. L.N. contributed to conceptualization, methodology and writing – review and editing. All authors were involved in writing the paper and had final approval of the submitted and published versions.
Financial support
The original survey used in the present study was funded by the Lebanese National Council for Scientific Research and the University Research Board at the American University of Beirut.
Competing interests
The authors declare none.


 Open access

