1. Introduction
The coalescence and breakup of bubbles or drops function as key dynamical elements in a wide range of multiphase flows, found in both nature and technology. In nature, this includes growth of rain drops in clouds (Villermaux & Bossa Reference Villermaux and Bossa2009), tephra formation during volcanic eruptions (Gonnermann & Manga Reference Gonnermann and Manga2007), aerosols from bursting bubbles on the ocean surface (Wanninkhof et al. Reference Wanninkhof, Asher, Ho, Sweeney and McGillis2009) and coarsening of foams or emulsions (Bhakta & Ruckenstein Reference Bhakta and Ruckenstein1997). In industrial processes one can highlight the separation of immiscible fluids like oil and water (Sjöblom et al. Reference Sjöblom, Aske, Auflem, Brandal, Havre, Saether, Westvik, Johnsen and Kallevik2003), boiling heat transfer in power stations (Li et al. Reference Li, Wang, Wang, Peles, Koratkar and Peterson2008), droplet combustion in engines (Williams Reference Williams1973), printing and painting (Renardy et al. Reference Renardy, Popinet, Duchemin, Renardy, Zaleski, Josserand, Drumright-Clarke, Richard, Clanet and Quéré2003; Yarin Reference Yarin2006) and bubble or droplet microfluidic flows in biomedical applications (Friend & Yeo Reference Friend and Yeo2011) and precisely controlled chemical reactions (deMello Reference deMello2006). The coalescence and breakup play a fundamental role in these systems through their effect on emulsion stability, bubble or drop size distributions, as well as determining the surface/volume ratio for interface reactions and phase transformations.
The early stage of the coalescence process has been intensively studied in recent years, for example by Menchaca-Rocha et al. (Reference Menchaca-Rocha, Martínez-Dávalos, Núñez, Popinet and Zaleski2001), who used sessile mercury drops, and Thoroddsen, Takehara & Etoh (Reference Thoroddsen, Takehara and Etoh2005b ), using pendent and sessile drops attached to vertical nozzles. Such studies were largely driven by improvements in high-speed video technology (Thoroddsen, Etoh & Takehara Reference Thoroddsen, Etoh and Takehara2008) especially for the low-viscosity case, where motions are very rapid. This has been complemented by theoretical developments (Eggers, Lister & Stone Reference Eggers, Lister and Stone1999).
Coalescence is driven by unbalanced surface tension in the newborn neck connecting the two fluid masses, where the axial surface curvature is sharper than the azimuthal one. However, its initiation requires the drainage of the thin fluid film separating them. Observing the earliest motions entails experimental challenges at very small length and time scales, which have been overcome using electrical methods (Burton, Rutledge & Taborek Reference Burton, Rutledge and Taborek2004) or the impedance of an oscillating electric field (Case & Nagel Reference Case and Nagel2008). Viscosity changes the dynamics of the motions in the neck (Hopper Reference Hopper1993; Aarts et al.
Reference Aarts, Lekkerkerker, Guo, Wegdam and Bonn2005), eliminating the prominent humps away from the neck up along the drop surface (Keller, Milewski & Vanden-Broeck Reference Keller, Milewski and Vanden-Broeck2000; Duchemin, Eggers & Josserand Reference Duchemin, Eggers and Josserand2003; Thoroddsen et al.
Reference Thoroddsen, Takehara and Etoh2005b
), thereby stopping the production of capillary waves. Recently Paulsen et al. (Reference Paulsen, Carmigniani, Kannan, Burton and Nagel2014) have studied coalescence of drops and bubbles while varying the viscosity of the outer fluid, thereby identifying critical Ohnesorge number
 $\mathit{Oh}$
when the outer fluid viscosity starts controlling the neck motions.
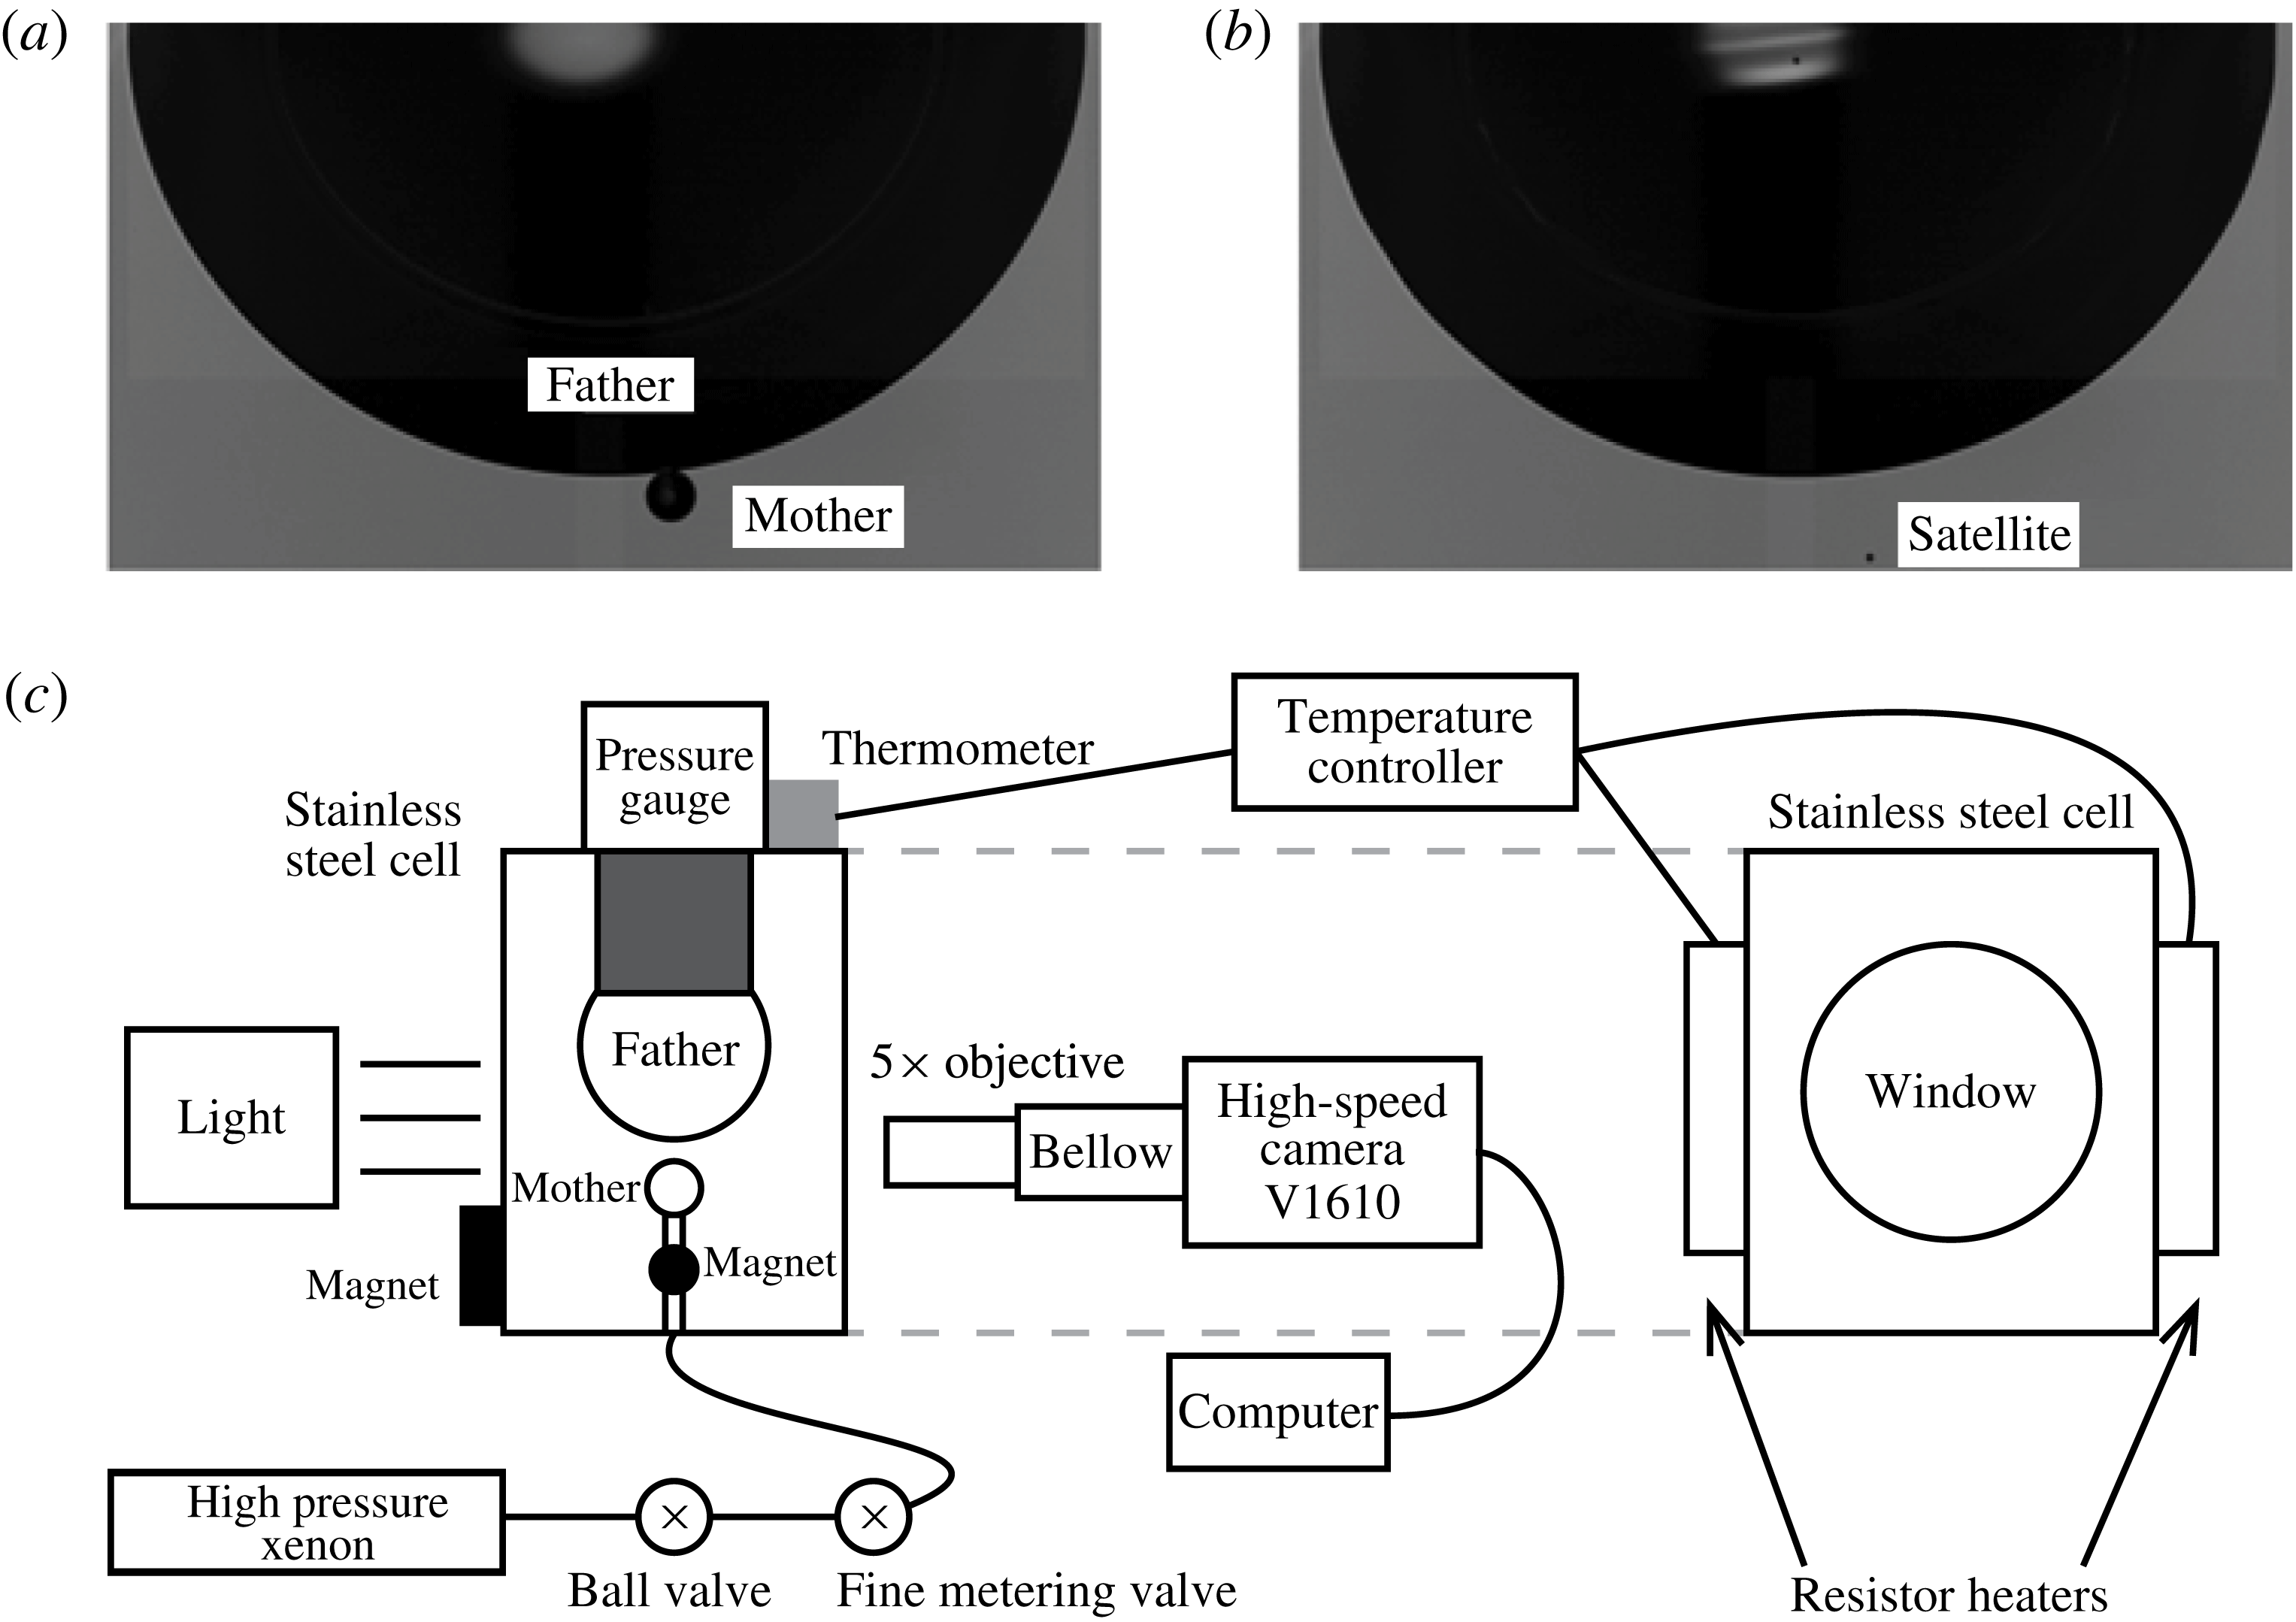
The capillary-driven expansion of the neck generates capillary waves from the released surface energy. The waves carry momentum and propagate axisymmetrically along the bubble surfaces, then focus at their apex and stretch outwards from the opposite poles to form cylindrical protrusions, which are sometimes pinched off to form satellites. Thereby, coalescence not only merges drops or bubbles, but also can produce satellites, as shown in figure 1(a,b). Partial coalescence was initially observed and studied for a drop coalescing with a flat interface. Charles & Mason (Reference Charles and Mason1960a ,Reference Charles and Mason b ) were the first to study it in emulsions of one liquid within another. They observed up to eight stages of coalescence, with a satellite approximately half the size of the original drop. Thoroddsen & Takehara (Reference Thoroddsen and Takehara2000) observed up to six stages for a drop coalescing with a pool surface, with a similar satellite/mother size ratio of 50 %. They demonstrated that the dynamics of this coalescence cascade satisfy a capillary–inertial scaling.
Blanchette & Bigioni (Reference Blanchette and Bigioni2006, Reference Blanchette and Bigioni2009) identified the smallest droplet limit, where viscosity stops the partial coalescence, in terms of a critical Ohnesorge number. They also looked at the effect of gravity for the largest drops, through a Bond-number effect. Gilet et al. (Reference Gilet, Mulleners, Lecomte, Vandewalle and Dorbolo2007a
) studied the satellite formation for a number of liquid combinations and identified the dominant capillary mode responsible for the pinch-off in the droplet case. For reference, the smallest pinched-off satellite, for water, has a diameter of
 $20~{\rm\mu}\text{m}$
(Blanchette & Bigioni Reference Blanchette and Bigioni2006), while for mercury drops the Ohnesorge limit predicts a 600 nm satellite (Thoroddsen Reference Thoroddsen2006). Continuing work is due to Aryafar & Kavehpour (Reference Aryafar and Kavehpour2006), Chen, Mandre & Feng (Reference Chen, Mandre and Feng2006), Honey & Kavehpour (Reference Honey and Kavehpour2006) and Ray, Biswas & Sharma (Reference Ray, Biswas and Sharma2010), and by Yue, Zhou & Feng (Reference Yue, Zhou and Feng2006), who have studied non-Newtonian emulsions.
Typical overall views before (a) and after (b) the partial coalescence. (c) Schematic of the experimental set-up.

However, partial coalescence does not only occur for the drop-on-flat-interface configuration – it has now been studied for a number of other set-ups. Zhang, Li & Thoroddsen (Reference Zhang, Li and Thoroddsen2009) studied the case of two drops of different diameters. They identified new dynamics, where the satellite goes through two sequences of deformations, only pinching off of a satellite during the second stage. Note that, for the simplest case of the coalescence of two identically sized low-viscosity drops, no satellites are observed (Menchaca-Rocha et al. Reference Menchaca-Rocha, Martínez-Dávalos, Núñez, Popinet and Zaleski2001; Zhang et al. Reference Zhang, Li and Thoroddsen2009), even though this has not been conclusively tested for the fully inviscid case.
Zhang & Thoroddsen (Reference Zhang and Thoroddsen2008) furthermore studied partial coalescence for two bubbles, showing that the satellites were much smaller than for the drop case, or approximately 10 % of the original bubble. This had earlier been studied numerically by Ohnishi, Azuma & Straub (Reference Ohnishi, Azuma and Straub1999). In contrast to the coalescence of drops, partial coalescence can be observed for bubbles of the same size, and even on the larger bubble.
Similar dynamics have even been observed for a drop spreading on a hydrophilic solid surface (Roux & Cooper-White Reference Roux and Cooper-White2004; Rioboo et al. Reference Rioboo, Adão, Voué and De Coninck2006; Ding et al. Reference Ding, Li, Zhang, Sui, Spelt and Thoroddsen2012). Here the critical Ohnesorge number is a function of the wettability of the solid, characterized by the static contact angle at the triple line. Such satellites can be detrimental during ink-jet printing on hydrophilic surfaces, by introducing non-uniformities or cross-contamination.
Partial coalescence has also been observed in three-component emulsions (Li et al. Reference Li, Al-Otaibi, Vakarelski and Thoroddsen2014), when a bubble passes through an interface between two immiscible liquids. Here the dynamics are influenced by the triple line where the three phases meet.
More exotic variants show the influence of Marangoni effects (Thoroddsen et al. Reference Thoroddsen, Qian, Etoh and Takehara2007; Blanchette, Messio & Bush Reference Blanchette, Messio and Bush2009) and electric fields (Aryafar & Kavehpour Reference Aryafar and Kavehpour2009; Hamlin, Creasey & Ristenpart Reference Hamlin, Creasey and Ristenpart2012) on partial coalescence (Kavehpour Reference Kavehpour2015), or vibrations of the bath (Gilet, Vandewalle & Dorbolo Reference Gilet, Vandewalle and Dorbolo2007b ). In particular, recent simulations (Martin & Blanchette Reference Martin and Blanchette2015) and experiments (Pucci, Harris & Bush Reference Pucci, Harris and Bush2015) have demonstrated that partial coalescence can occur for a soap bubble on a flat soap film, leading to a satellite size of approximately 50 % of the original bubble.
Why are the typical satellite/mother size ratios
 ${\it\alpha}=R_{s}/R_{m}$
so different for bubbles versus drops, i.e. 10 % versus 50 %? What is the exact mechanism of the partial coalescence in its most fundamental case, when only the capillary and inertial forces are dominant? This pinch-off has generally been attributed to the focusing of capillary waves at the apex of the bubble or drop. These waves are generated from the neck opening during the early coalescence process. However, the details of this dynamical difference between drops and bubbles have not been explained. To answer this question, we herein perform both a set of experiments as well as numerical simulations, where we systematically vary the density ratio between inner and outer fluids, from the bubble to the drop conditions.
2. Experimental set-up and numerics
2.1. Experimental set-up
The schematic of the experimental set-up is shown in figure 1(c). The coalescence of the xenon bubbles (inner fluid) in deionized water (outer fluid) were controlled inside a stainless steel cell with sapphire windows, which are press sealed with Viton O-rings. The water came from a Milli-Q purifier and was dispensed through a
 $0.22~{\rm\mu}\text{m}$
membrane filter. The xenon was released into the experimental cell from a high-pressure tank through a thin stainless steel needle (with outer diameter of 0.21 mm) to form the small mother bubble, while the father bubble is produced by coalescence of many previously released bubbles and is attached under a larger nozzle. The mother bubble rises due to buoyancy towards the stationary upper bubble. The distance between the tip of the thin needle and the bottom surface of the father bubble is kept small to reduce the approach velocity of bubble surfaces and to assist the initiation of the coalescence. During emergence of the mother bubble, the flow rate of the gas was controlled to be very small by a fine metering valve to avoid the disturbance of the gas release to the flow field.
High-speed imaging was performed with a Phantom V1610 CMOS video camera, at frame rates up to 130 000 f.p.s. We used a
 $5\times$
objective lens and bellows for maximum magnification of
 $14.7\times$
, giving a
 $1.9~{\rm\mu}\text{m}$
pixel resolution. To achieve a good focus of both bubbles, the axial position of the needle is tuned by a powerful magnet attached outside the cell and interacts with a smaller magnet fixed to the thin needle.
The pressure in the cell increases after more and more xenon is released into it, and is measured by a pressure gauge and recorded. The maximum pressure reached in the experimental cell is 85 atm, where the xenon density becomes the same as that of water. The temperature is kept higher than room temperature at
 $42\pm 1.5\,^{\circ }\text{C}$
using electrical heaters and a temperature controller to avoid problems with the formation of the xenon–water clathrate (see Nakayama et al.
Reference Nakayama, Klug, Ratcliffe and Ripmeester2003; Burton & Taborek Reference Burton and Taborek2008).
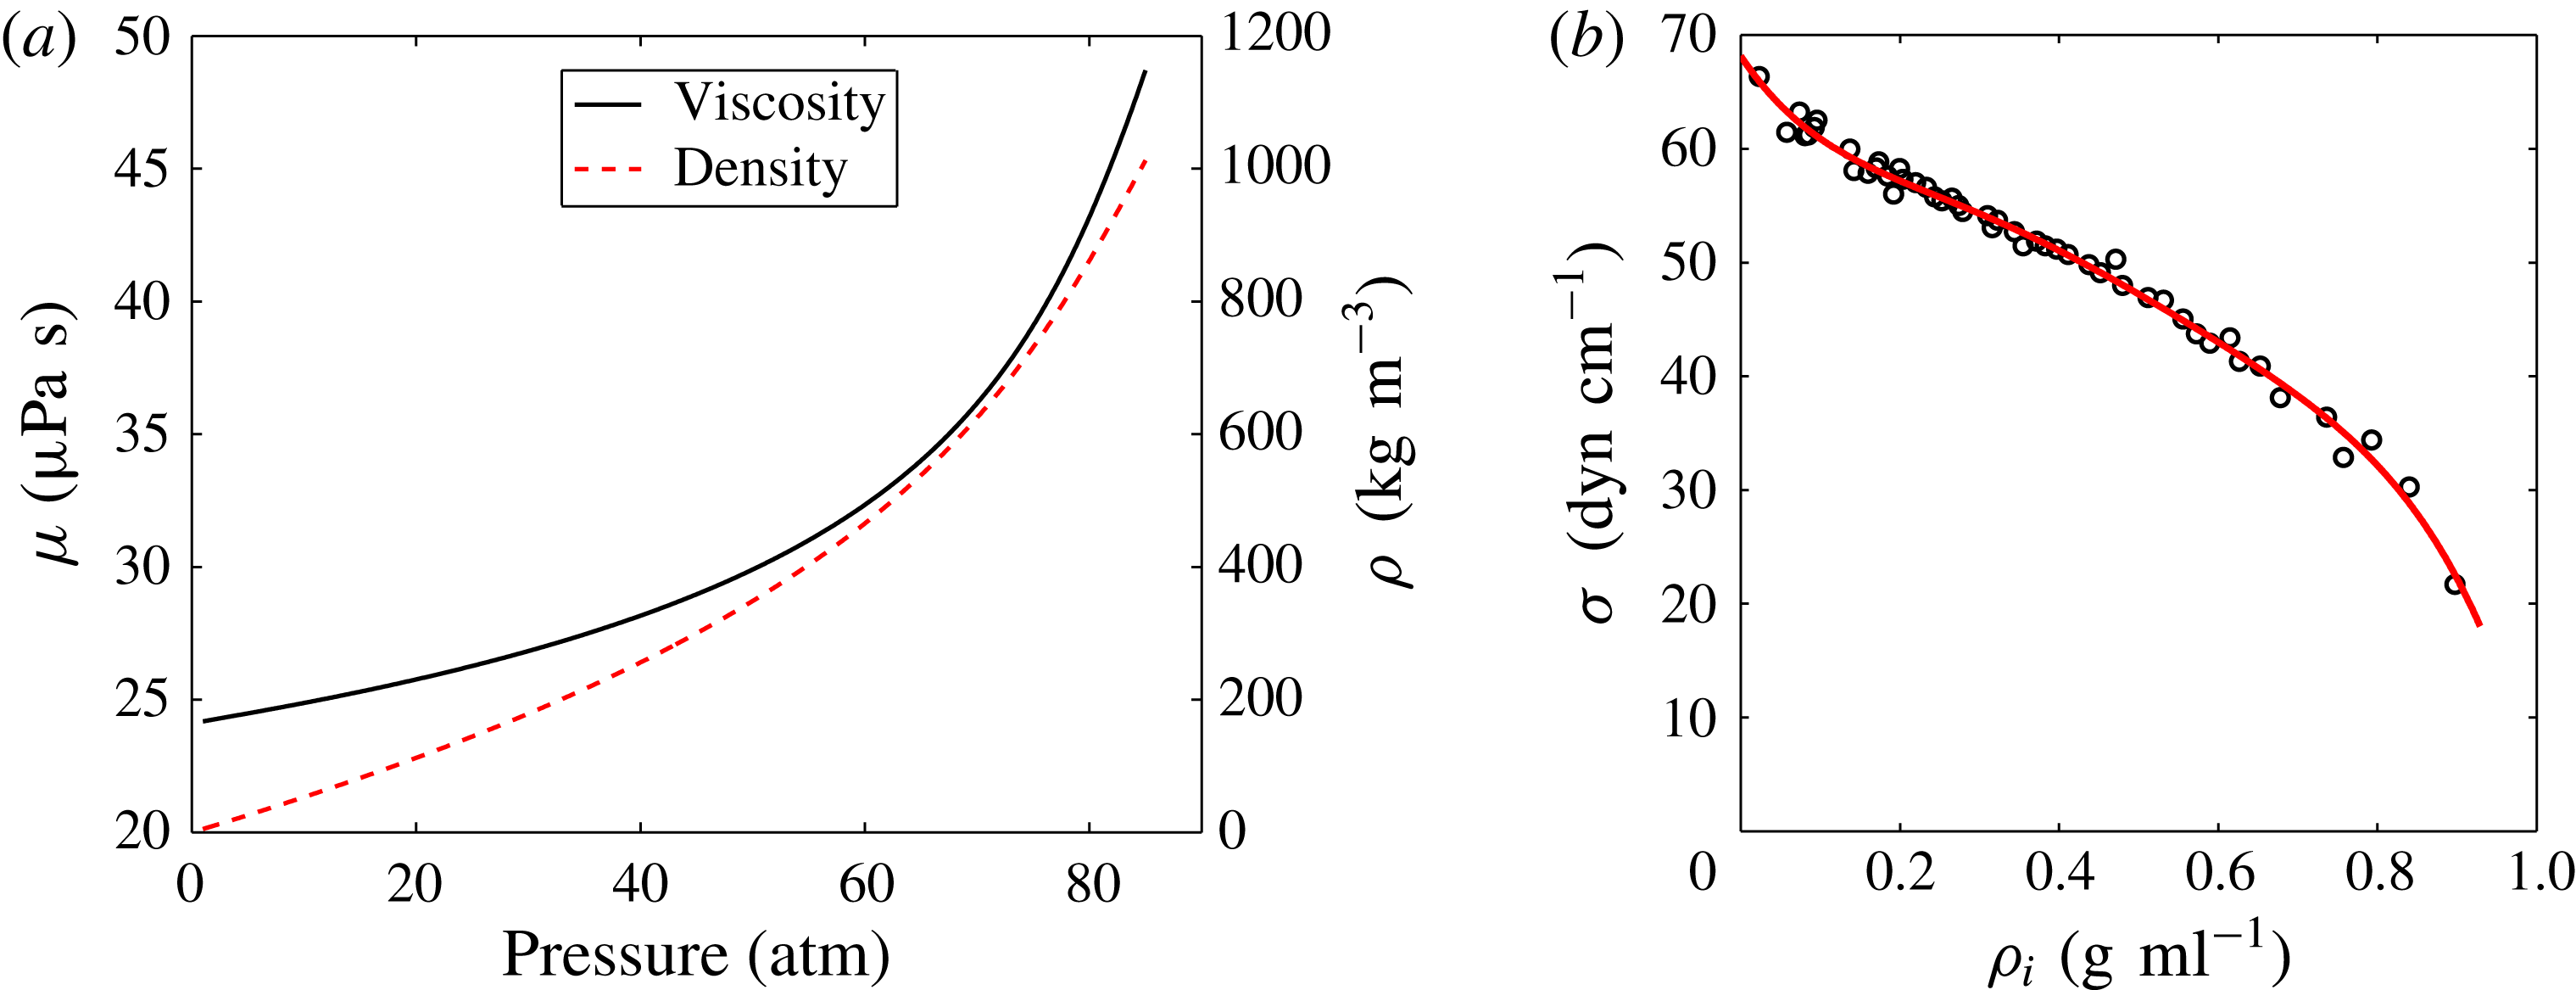
Based on the recorded temperatures and pressures within the cell, the density and viscosity of xenon and the deionized water are obtained from the NIST Standard Reference Database (see figure 2
a). The xenon density
 ${\it\rho}_{i}$
significantly increases with pressure, from 5 to
 $1000~\text{kg}~\text{m}^{-3}$
, while its viscosity
 ${\it\mu}_{i}$
is less affected, increasing from 24 to
 $49~{\rm\mu}\text{Pa}~\text{s}$
. They are approximately constant for water, with less than 0.4 % increase with pressure:
 ${\it\rho}_{o}\approx 993~\text{kg}~\text{m}^{-3}$
and
 ${\it\mu}_{o}\approx 0.63~\text{mPa}~\text{s}$
.
(a) Viscosity and density of xenon from the NIST Standard Reference Database (http://webbook.nist.gov/chemistry/fluid/). (b) The surface tension coefficient of the xenon–water interface at
 $42\pm 1.5\,^{\circ }\text{C}$
under a wide range of pressures from 1 to 81 atm. Circles are measurements and the red curve is a fifth-order polynomial fit:
 ${\it\sigma}=-510.4{\it\rho}_{i}^{5}+1173.9{\it\rho}_{i}^{4}-1038.7{\it\rho}_{i}^{3}+416.1{\it\rho}_{i}^{2}-105.1{\it\rho}_{i}+68.2$
.

The coefficient of surface tension under different pressures was calculated using in situ pendent bubble shape analysis, as explained in Burton et al. (Reference Burton, Huisman, Alison, Rogerson and Taborek2010), where an interactive program is supplied for such measurements. The results are shown in figure 2(b). Similar measurements were carried out by Burton & Taborek (Reference Burton and Taborek2008) for a smaller range of pressures at
 $37\,^{\circ }\text{C}$
. The results were fitted with a polynomial (see caption of figure 2), which has been applied in our data analysis. We estimate the accuracy of these surface tension measurements to be
 $\pm 1~\text{dyn}~\text{cm}^{-1}$
(Burton & Taborek Reference Burton and Taborek2008).
2.2. Nomenclature and non-dimensional parameters
The main parameter of this study is the inner/outer density ratio
 $D={\it\rho}_{i}/{\it\rho}_{o}$
. As the pressure increases, it increases from 0.005 at atmospheric pressure to 1 close to 85 atm, owing to the higher inner densities of the xenon gas. The ratio of dynamic viscosity between the inner and outer fluids is always small, but increasing with pressure from
 ${\it\mu}_{i}/{\it\mu}_{o}=3.8\times 10^{-2}$
to
 $7.7\times 10^{-2}$
.
For ease of reference, the bubble or drop from which the satellite (of radius
 $R_{s}$
) pinches is called the mother (of radius
 $R_{m}$
), while the other bubble or drop is the father (of radius
 $R_{f}$
).
The absence of any external velocity scale leads us to express the relative strength of viscous forces to the inertial force induced by capillarity by two Ohnesorge numbers, which are based on the inner or outer fluid properties, i.e.
 $$\begin{eqnarray}\mathit{Oh}_{i}=\frac{{\it\mu}_{i}}{\sqrt{{\it\rho}_{i}{\it\sigma}R_{m}}}\quad \text{and}\quad \mathit{Oh}_{o}=\frac{{\it\mu}_{o}}{\sqrt{{\it\rho}_{o}{\it\sigma}R_{m}}},\end{eqnarray}$$
while the Bond number,
 $$\begin{eqnarray}\mathit{Bo}=\frac{|{\it\rho}_{i}-{\it\rho}_{o}|gR_{m}^{2}}{{\it\sigma}},\end{eqnarray}$$
measures the relative strength of gravity to the capillary force. The dynamic viscosities are
 ${\it\mu}_{i}$
and
 ${\it\mu}_{o}$
in the inner and outer fluids, respectively;
 ${\it\sigma}$
is the coefficient of interfacial tension; and
 $g$
is the acceleration due to gravity. In the present study, the small values of Ohnesorge numbers (
 $\mathit{Oh}_{i}<\mathit{Oh}_{o}<0.012$
) and Bond number (
 $\mathit{Bo}<0.06$
) indicate that the viscous and gravity forces are negligible relative to the capillary and inertial forces (Blanchette & Bigioni Reference Blanchette and Bigioni2006; Yue et al.
Reference Yue, Zhou and Feng2006). Buoyancy only serves to bring the two bubbles into contact.
The balance between inertia and surface tension gives the following characteristic velocity and time scales, based on the summation of the inner and the outer densities:
 $$\begin{eqnarray}V_{{\it\sigma}s}=\sqrt{\frac{{\it\sigma}}{({\it\rho}_{i}+{\it\rho}_{o})R_{m}}},\quad {\it\tau}_{{\it\sigma}s}=\sqrt{\frac{({\it\rho}_{i}+{\it\rho}_{o})R_{m}^{3}}{{\it\sigma}}}.\end{eqnarray}$$
2.3. Numerical simulations
We perform axisymmetric numerical simulations with the freely available code Gerris (http://gfs.sf.net). It solves the incompressible Navier–Stokes equations using the volume-of-fluid (VOF) method (Tryggvason, Scardovelli & Zaleski Reference Tryggvason, Scardovelli and Zaleski2011). Specifically, the method combines adaptive quad/octree spatial discretization, with a VOF interface representation, using balanced-force continuum-surface-force surface tension formulation, with a height-function curvature estimation (Popinet Reference Popinet2003, Reference Popinet2009).
To allow for a large parent size ratio,
 $R_{f}/R_{m}=30$
, as in the experiments in figure 1(a), a large computational domain is used with height
 $H=80R_{m}$
and width
 $R=47R_{m}$
. Dynamic adaptive mesh refinement is used to increase the resolution at the interface and in regions of high vorticity. The simulations were carried out for density ratios from 0.001 to 100.
To avoid the initial coalescence singularity, we start the simulation when the bubbles are already connected through a thin neck at the axis of symmetry (Oguz & Prosperetti Reference Oguz and Prosperetti1989; Duchemin et al.
Reference Duchemin, Popinet, Josserand and Zaleski2002). The radius of this contact is
 $R_{c}$
, forming a slightly enlarged circular rim of outer fluid, whose size is determined by volume conservation, i.e. retaining the same bubble volume as if the contact were at a point. Two different values of
 $R_{c}/R_{m}$
, of 17.6 % and 7.4 %, showed highly consistent results, indicating that the satellite pinch-off is not sensitive to the size of this initial contact. To retain sufficient resolution along the interface near the highly curved initial contact, we allowed the maximum level of refinement in that region to become 13 instead of 11, used elsewhere in the domain. This kept a minimum of five numerical cells per radius of curvature inside the initial neck.
3. Results
3.1. Overview
To explore experimentally the transition from bubble-like to drop-like partial coalescence behaviours, we film coalescence of two xenon bubbles in deionized water over a wide range of pressures from 1 to 85 atm, while keeping the temperature constant at
 $42\,^{\circ }\text{C}$
. When the pressure is increased, the inner xenon density
 ${\it\rho}_{i}$
increases, while the outer water density
 ${\it\rho}_{o}$
remains essentially constant. We then compare with numerical simulations under the same conditions.
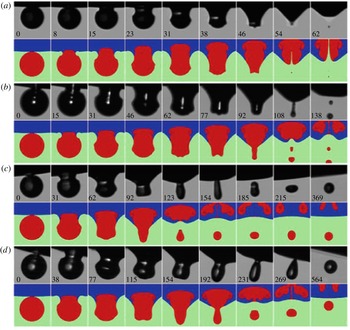
Figure 3 and supplementary movies 1–6 (available at http://dx.doi.org/10.1017/jfm.2015.533) show sequences of partial coalescence events, as the chamber pressure is increased. They show qualitatively the growth in satellite/mother size ratio
 ${\it\alpha}=R_{s}/R_{m}$
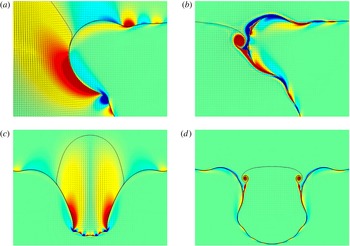
as the density of the inner fluid increases, thereby transitioning from bubble-like to drop-like behaviour. Our numerical simulations accurately reproduce the experimental events and additionally reveal the interface between the fluids originating in the two bubbles and the stirring of the two. The numerics also provide the velocity field and the vorticity induced at the free surface, as described in later sections. Figure 3(b) shows the formation of a sub-satellite, which will be discussed in § 5.2.
Shapes of partial coalescence of various inner/outer density ratios. Typical scenarios of close-up focusing on the deformation and breakup of the mother bubble. In the experimental panels (black and white) time is listed in microseconds, relative to the onset of coalescence in the first panel of each row. Their numerical (colour) counterparts are shown below them. From (a) to (d), the mother radii
 $R_{m}$
are 82, 95, 82 and 89
 ${\rm\mu}\text{m}$
, respectively, the father/mother size ratio is
 $R_{f}/R_{m}=28\pm 1$
, and the Ohnesorge numbers are
 $\mathit{Oh}_{o}=(9.5\pm 1.5)\times 10^{-3}$
and
 $\mathit{Oh}_{i}=(1.5\pm 0.7)\times 10^{-3}$
. The Bond numbers
 $\mathit{Bo}=(9.5\pm 3.5)\times 10^{-3}$
are all similar. However, the pressures are 5.8, 23.2, 49.7 and 74.1 atm, respectively, giving the corresponding xenon/water density ratios
 $D={\it\rho}_{i}/{\it\rho}_{o}=0.03$
, 0.13, 0.35 and 0.71. This results in very different satellite/mother size ratios of
 $R_{s}/R_{m}\simeq 0.07$
, 0.20, 0.45 and 0.52, respectively.

3.2. Satellite size
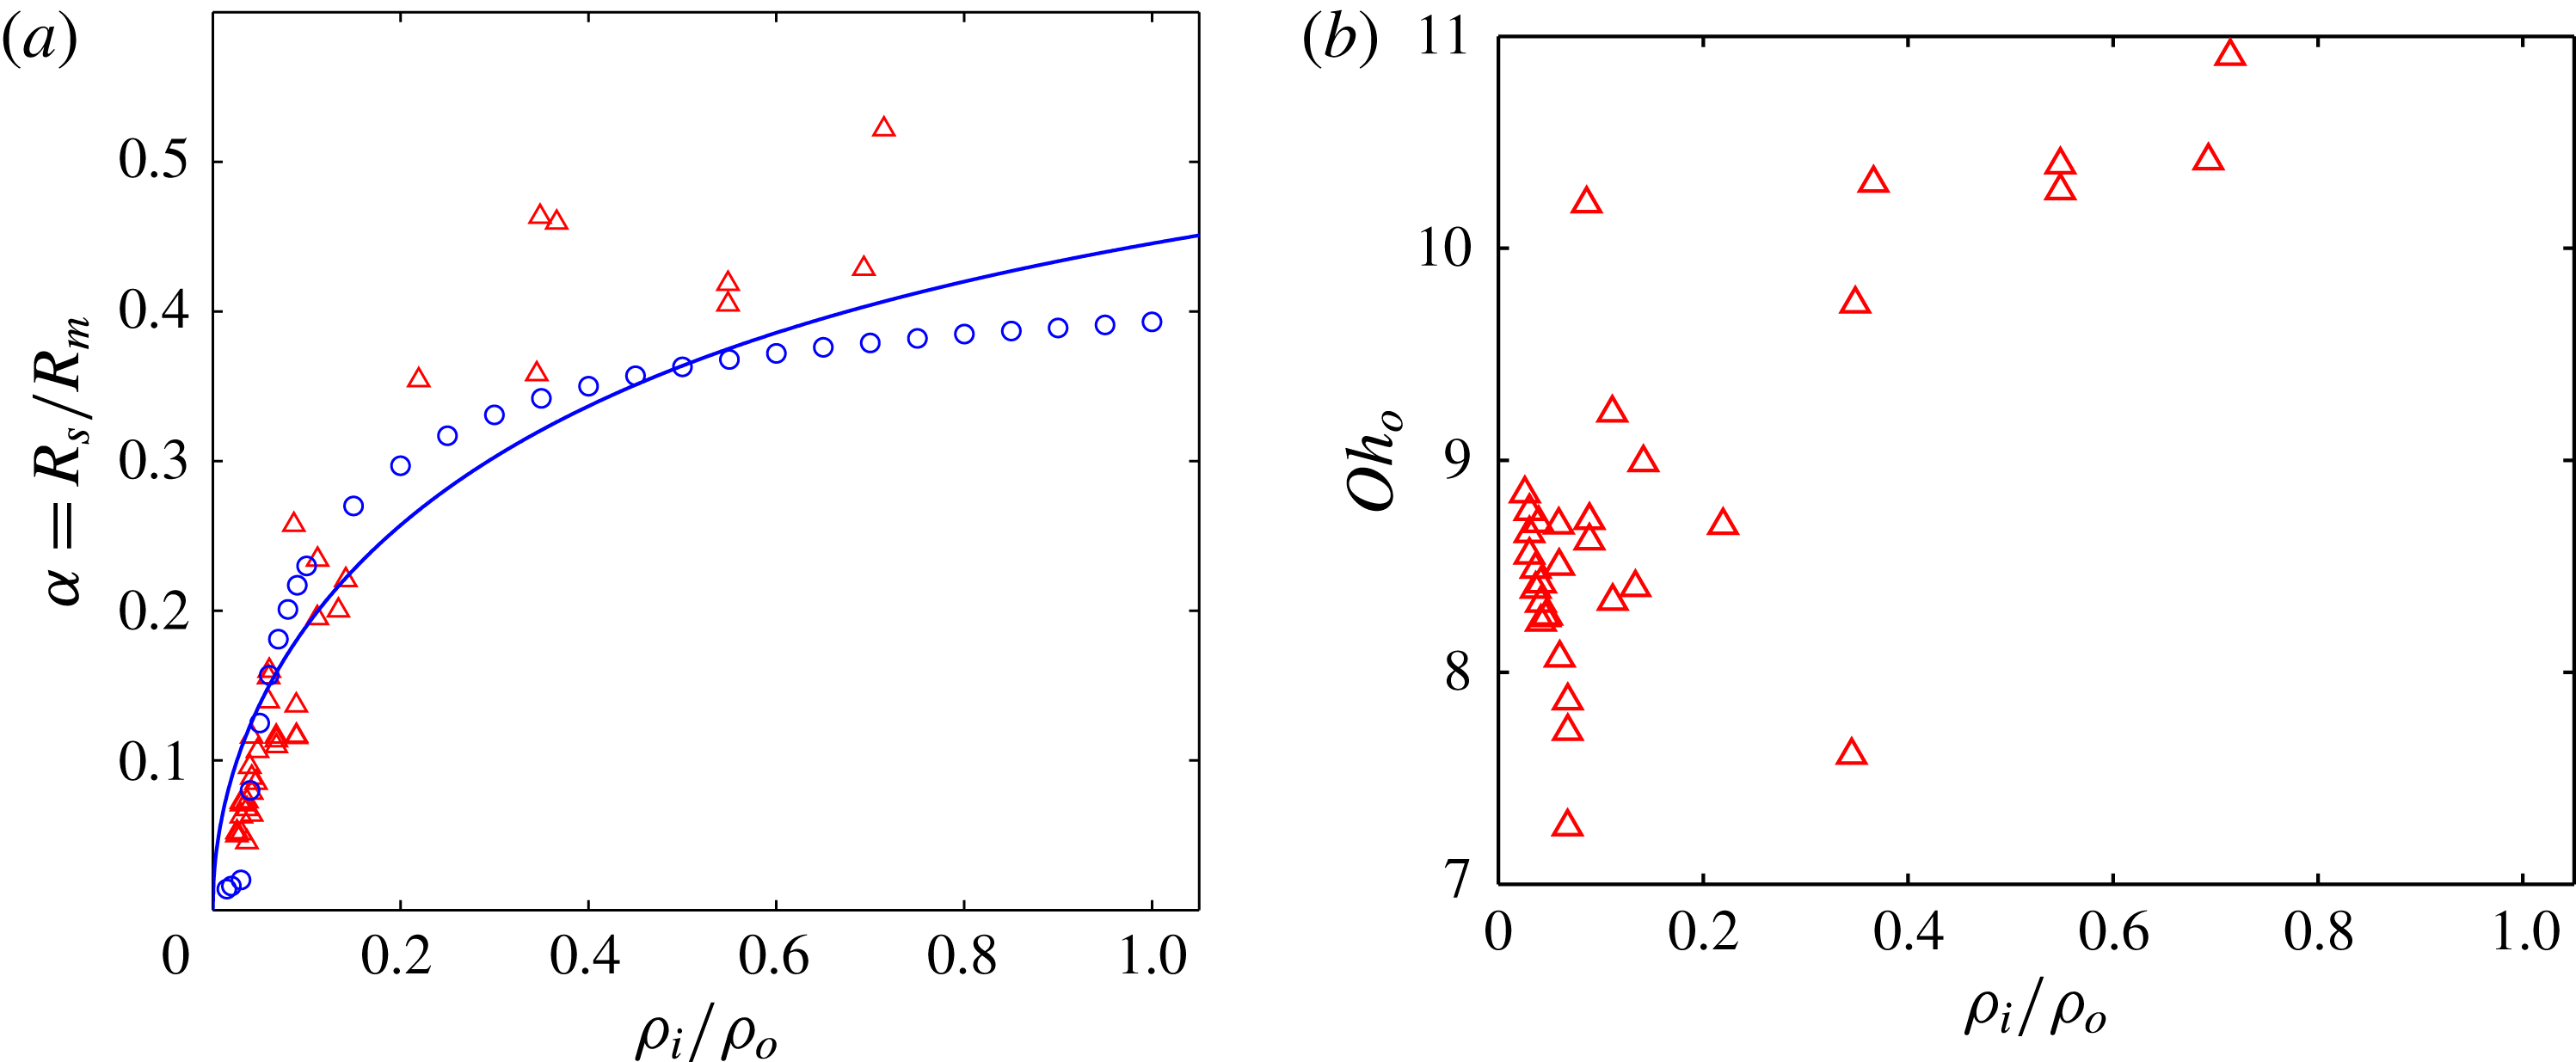
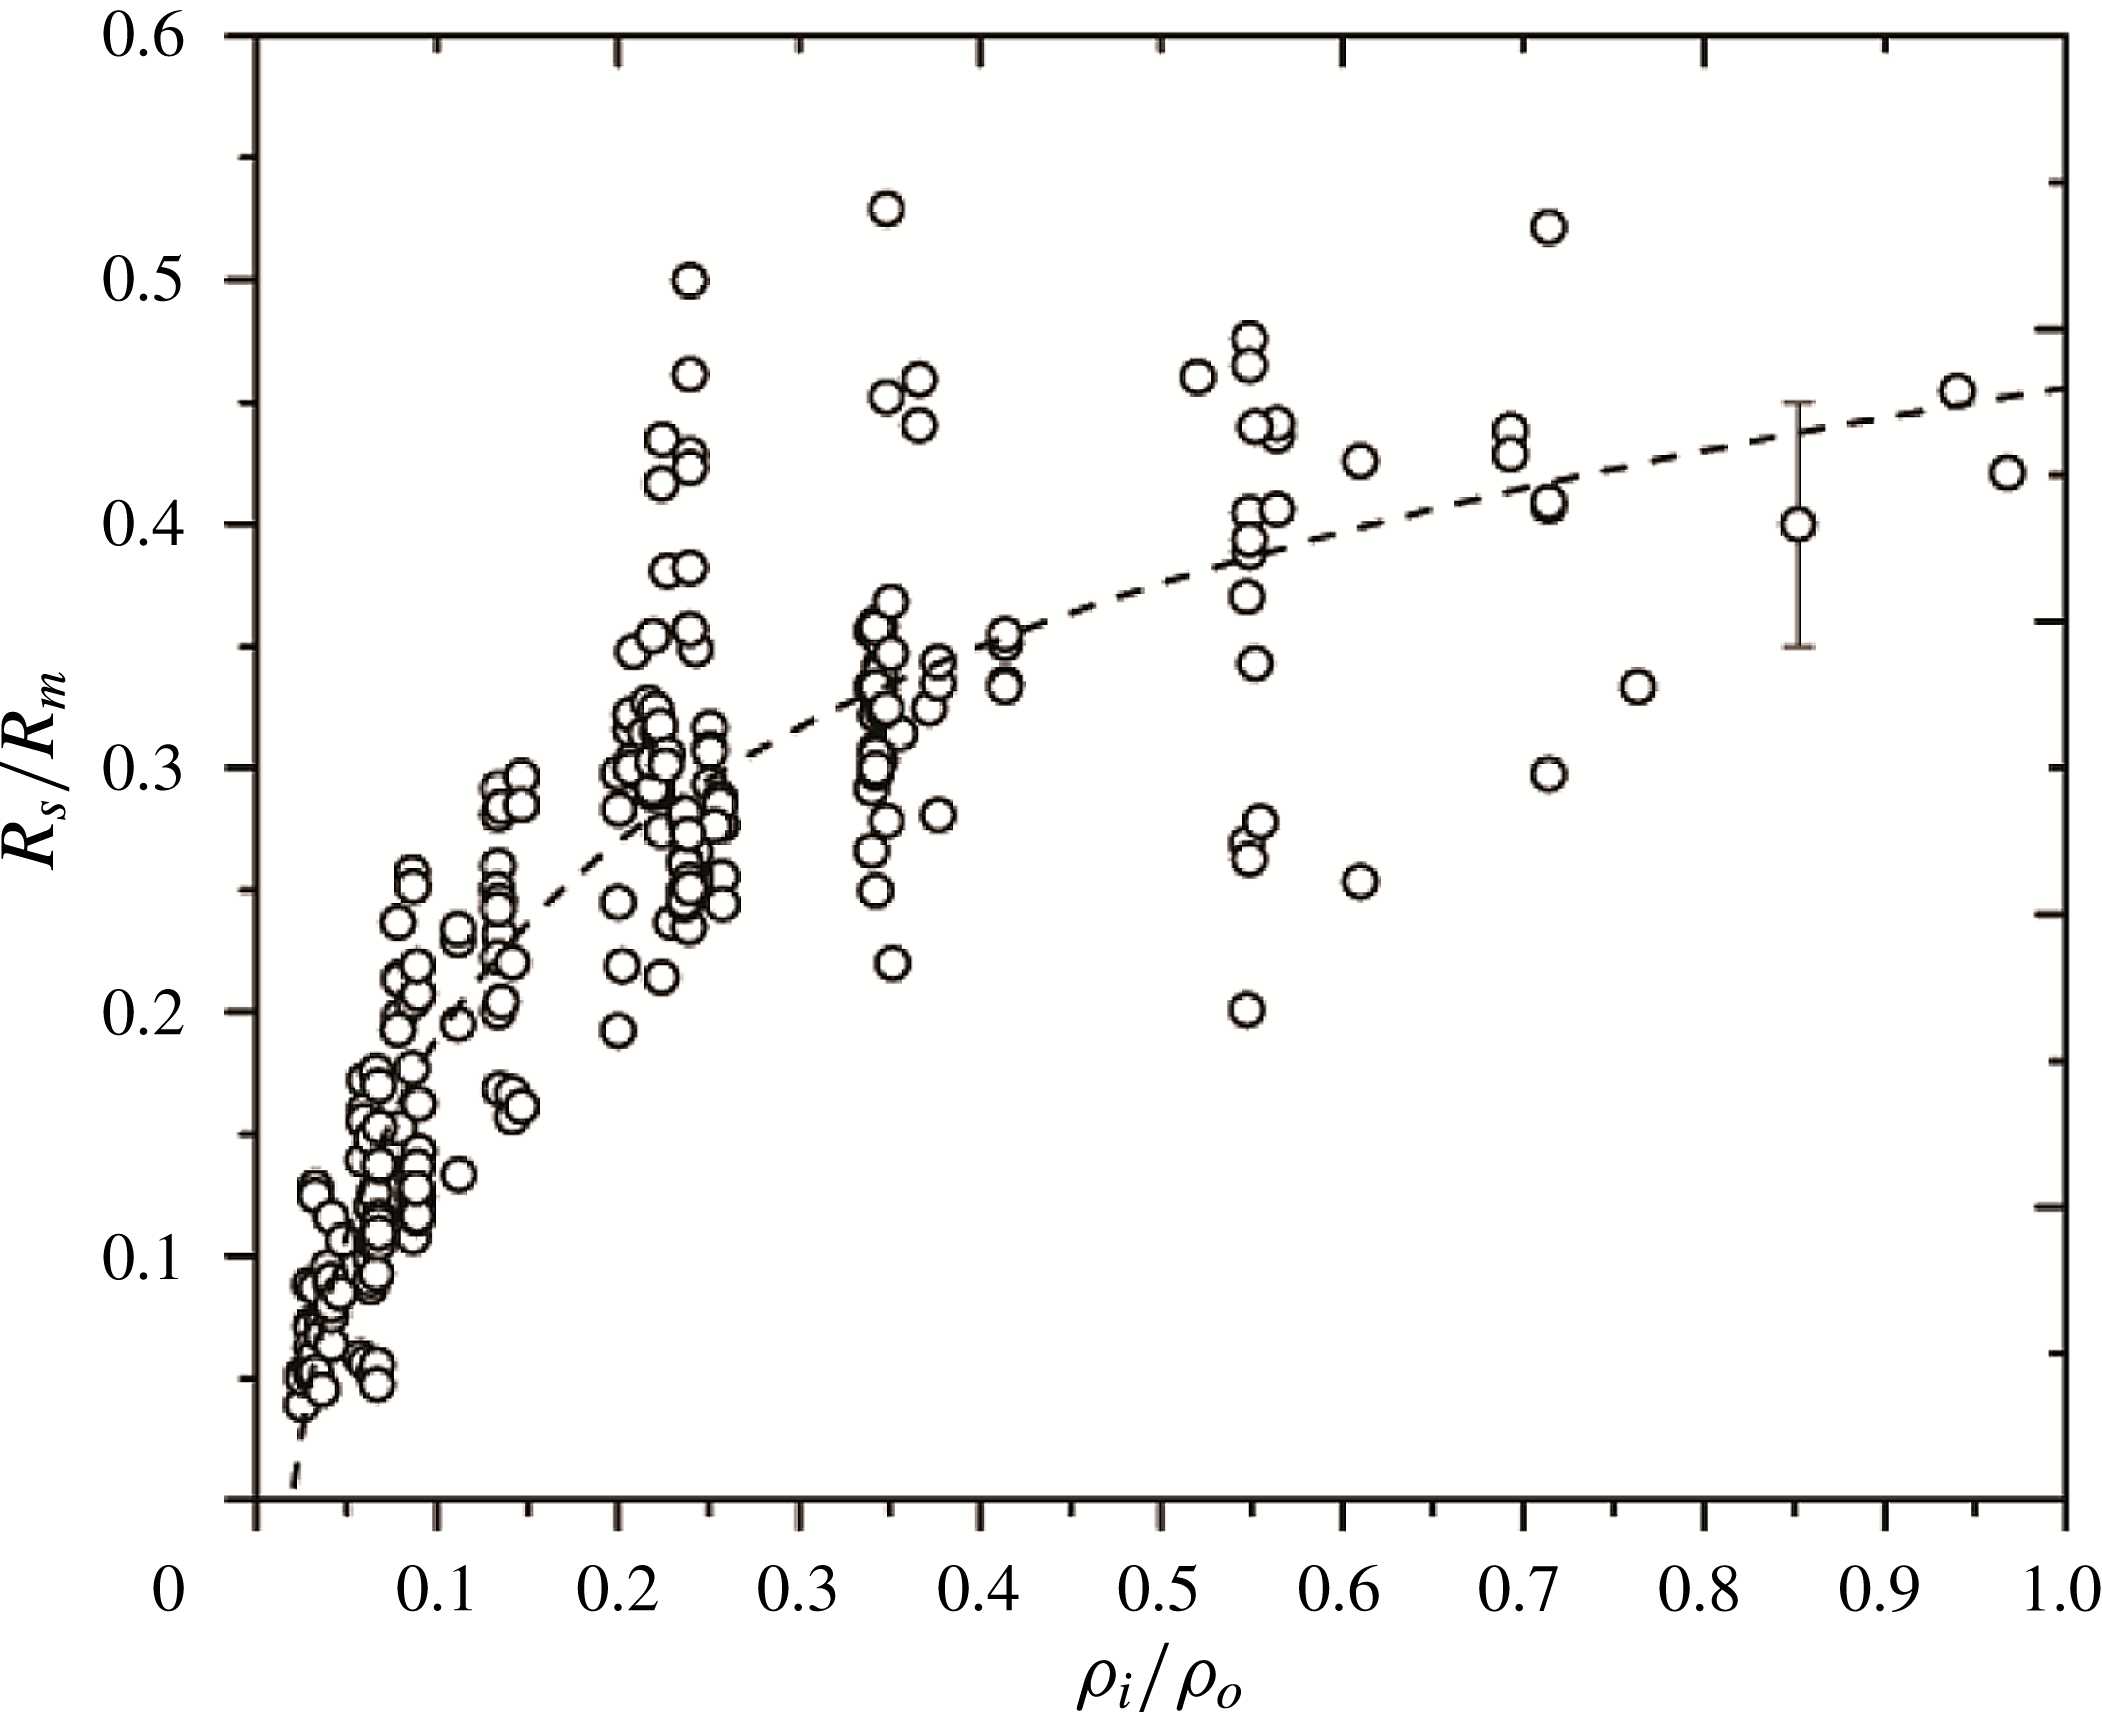
Figure 4(a) compares the normalized satellite size
 ${\it\alpha}=R_{s}/R_{m}$
for a set of experimental and numerical data under similar conditions. The smallest inner densities were only studied with numerical simulations. When the density ratio is smaller than 0.015, there is no satellite bubble but strong inner jetting of outer fluid into the bubble, which breaks into fine droplets (Duchemin et al.
Reference Duchemin, Popinet, Josserand and Zaleski2002; Zhang & Thoroddsen Reference Zhang and Thoroddsen2008). As
 $D$
increases from approximately 0.015 to 0.15, the satellite size quickly increases from 0 to
 ${\sim}0.3$
. Then as
 $D$
increases from 0.15 to 1,
 ${\it\alpha}$
slowly increases from approximately 0.30 to
 $0.45\pm 0.05$
, approaching the typical values for the drop case, of 0.50.
(a) Transition from bubble-like to drop-like behaviour of partial coalescence, when the density ratio is increased. Size ratio of the satellite to the mother. Experimental data (▵) shown are under conditions of
 $7\times 10^{-3}<\mathit{Oh}_{o}<11\times 10^{-3}$
and
 $25<R_{f}/R_{m}<35$
, and numerical data (○) are under similar conditions of
 $\mathit{Oh}_{o}=9\times 10^{-3}$
and
 $R_{f}/R_{m}=30$
. The solid curve shows the prediction of our model of (4.11) from § 4.4. (b) Plot of
 $\mathit{Oh}_{o}$
of the experimental data in (a).

Owing to the experimental limitations explained earlier, it was not possible to change the density of the inner fluid independently of the other parameters. This is the reason for the range of parameters gathered in figure 4, as described in the caption. The large scatter in the experimental data is mostly due to the spread in the sizes of mother bubbles used in the plot, while a systematic deviation is expected due to the changes in fluid properties with pressure (see figures 2 and 4 b). A non-zero relative velocity of the parent bubbles at the onset of coalescence could also influence the satellite size (see figure 7 of Zhang & Thoroddsen Reference Zhang and Thoroddsen2008). However, we do not expect this effect to be significant here, as we have verified that this velocity was always small. The size of the father bubble probably also plays a negligible role in this scatter due to the large size ratio (see also § 5.1 to quantify this effect).
The ratio of dynamic viscosity between the inner and outer fluids in the present study is always small, i.e. around
 ${\it\mu}_{i}/{\it\mu}_{o}\simeq 0.05$
. This differs significantly from the numerical work of Yue et al. (Reference Yue, Zhou and Feng2006), where
 ${\it\mu}_{i}/{\it\mu}_{o}=1$
. Their figure 10(a) revealed qualitatively similar growth of the satellite size
 ${\it\alpha}=R_{s}/R_{m}$
from approximately 0.3 to 0.5 in a smaller range of density ratio when
 $D={\it\rho}_{i}/{\it\rho}_{o}$
increases from 0.1 to 1, for partial coalescence of a drop with its flat bulk surface, which can be seen as a father drop of infinite radius.
3.3. Dynamics of coalescence
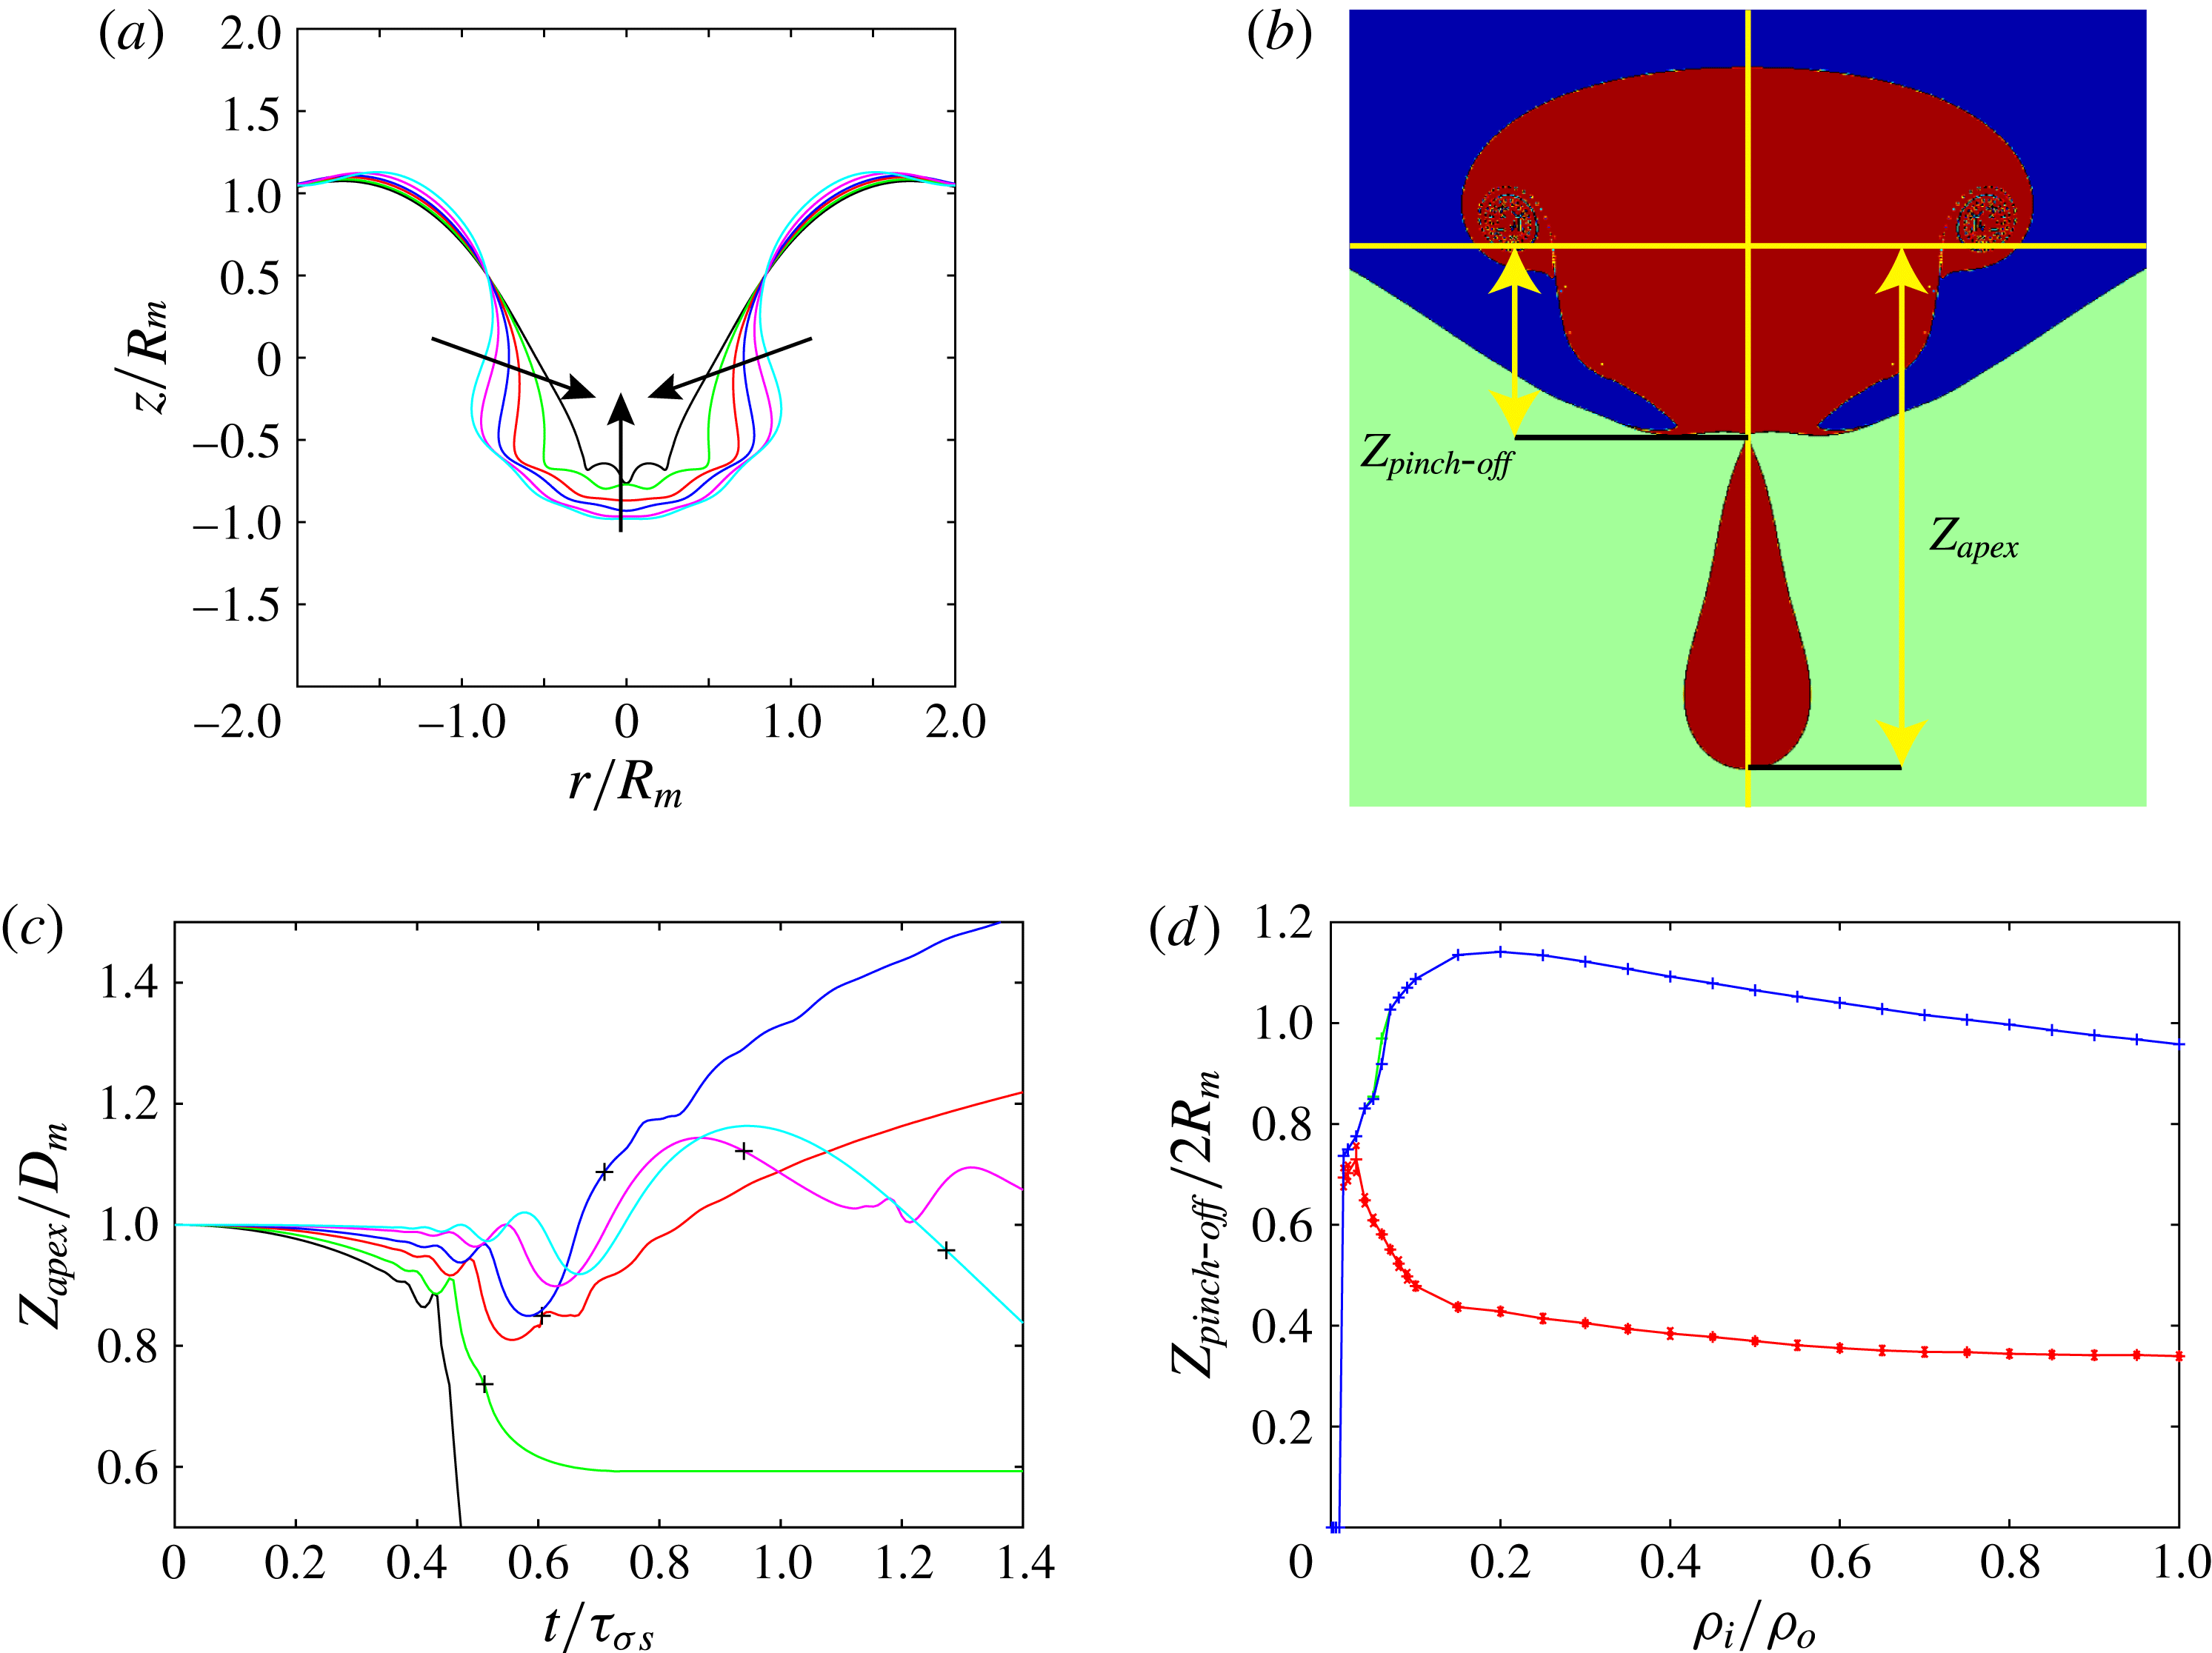
The effect of the density ratio on the dynamics is best revealed in figure 5(a) and the supplementary movie 7, where we combine the surface shapes for
 ${\it\rho}_{i}/{\it\rho}_{o}=D=0.001$
, 0.015, 0.05, 0.1, 0.3 and 1.0, and show their evolution in time. It demonstrates large qualitative differences, with much larger overall deformations for the bubble case, where the apex approaches a cone-like shape. This can be quantified by the width at the original centreline of the mother bubble,
 $z=R_{m}/2$
, which at this particular instant is
 $0.9R_{m}$
for equal inner and outer densities, but only
 $0.3R_{m}$
for the bubble case. The three times larger deformation for the bubble case suggests enhanced drainage from the mother bubble into the father.
Effect of the density ratio on the interface dynamics from the simulations. (a) Superposition of the interface shapes at normalized time
 $t/{\it\tau}_{{\it\sigma}s}=0.43$
, for six different density ratios
 $D={\it\rho}_{i}/{\it\rho}_{o}=0.001$
(black), 0.015 (green), 0.050 (red), 0.100 (blue), 0.300 (magenta) and 1.000 (cyan). The arrows show the main surface motions due to the drainage flow. (b) Height definitions. (c) Time evolution of the mother bubble apex height on the axis of symmetry, as defined in (b), for the same density ratios as in (a). The first oscillations show the passage of smaller and thus faster capillary waves. The
 $+$
symbols indicate the time of satellite pinch-off. (d) Axial elevation of the neck (lower curve) and the mother apex (upper curve) relative to the initial contact level, as defined in (b), measured at time of the pinch-off, as a function of the density ratio.

Another even clearer indication of the change in dynamical character, from bubble- to drop-like behaviour, is the motion of the apex of the mother bubble, and the resulting velocity of the satellite at pinch-off. The wave focusing distorts the pole surface and imparts vertical momentum to the local VOF at the apex. This can be observed qualitatively in figure 3 and the supplementary movies 1–7, but also quantitatively in figure 5(c) where we track the vertical position of the mother bubble apex in time. The apex first sees smaller waves of increasing amplitude, before the last wave may produce a satellite. A faster drainage at lower density ratios leads to a mean downward deviation of the curves.
The rate of drainage of the mother bubble into the father bubble plays a critical role here in selecting the time of pinch-off relative to the arrival time of the last wave. When the density ratio is small (between approximately 0.040 and 0.2), the overall deformation is fast so that the pinch-off occurs when the protrusion is still being stretched away from the bubble centroid. Consequently, the satellites move apart from the mother after the pinch-off. However, when the density ratio is large (between approximately 0.2 and 1.0), the overall deformation slows down, so that surface tension pullback of the protrusion has time to reverse this momentum of the protrusion and drives it to move back towards the mother, before pinch-off. Therefore, after pinch-off the satellite has a velocity towards the mother. However, this usually does not lead to a second partial coalescence event immediately. The daughter droplet tends to bounce off the surface, delaying the next stage in the coalescence cascade (Thoroddsen & Takehara Reference Thoroddsen and Takehara2000; Honey & Kavehpour Reference Honey and Kavehpour2006).
The case of density ratio 0.015 seems to contradict this trend, as the satellite is detaching with a velocity towards the mother bubble. This can be explained by a different pinch-off mechanism for a few density ratios at the transition between complete and partial coalescence. The satellite is produced not by the last wave, but by the smaller capillary wave preceding it. This pinch-off by earlier waves can be observed in figure 20(a). The same pinch-off mechanism is observed for density ratios 0.020 and 0.030. Their peculiar dynamics appears also in the numerical results of figures 4(a), 5(d) and 8.
The concurrent effects of the drainage of the mother bubble and the convergence of capillary waves also appears in the shape of the satellite, as shown in figures 5(d) and 20. Figure 5(d) shows that, when
 $D$
increases from 0.015 to 0.2, the axial elevation of the mother apex at the time of the pinch-off increases while that of the pinching neck decreases. However, as
 $D$
increases from approximately 0.2 to 1, they both decrease. Thereby, a clear transition from bubble-like to drop-like partial coalescence occurs at
 $D\simeq 0.15$
, with the maximal vertical elongation of the satellite. This critical density ratio is similar to the pinch-off transition observed by Burton & Taborek (Reference Burton and Taborek2008), for the gravity-driven pinch-off of bubble/drop from a nozzle.
In the following section we construct a model describing the interplay between the propagation of the capillary–inertial waves and the drainage, to predict the satellite size as a function of the density ratio.
4. Wave and drainage models
4.1. The mechanism of partial coalescence
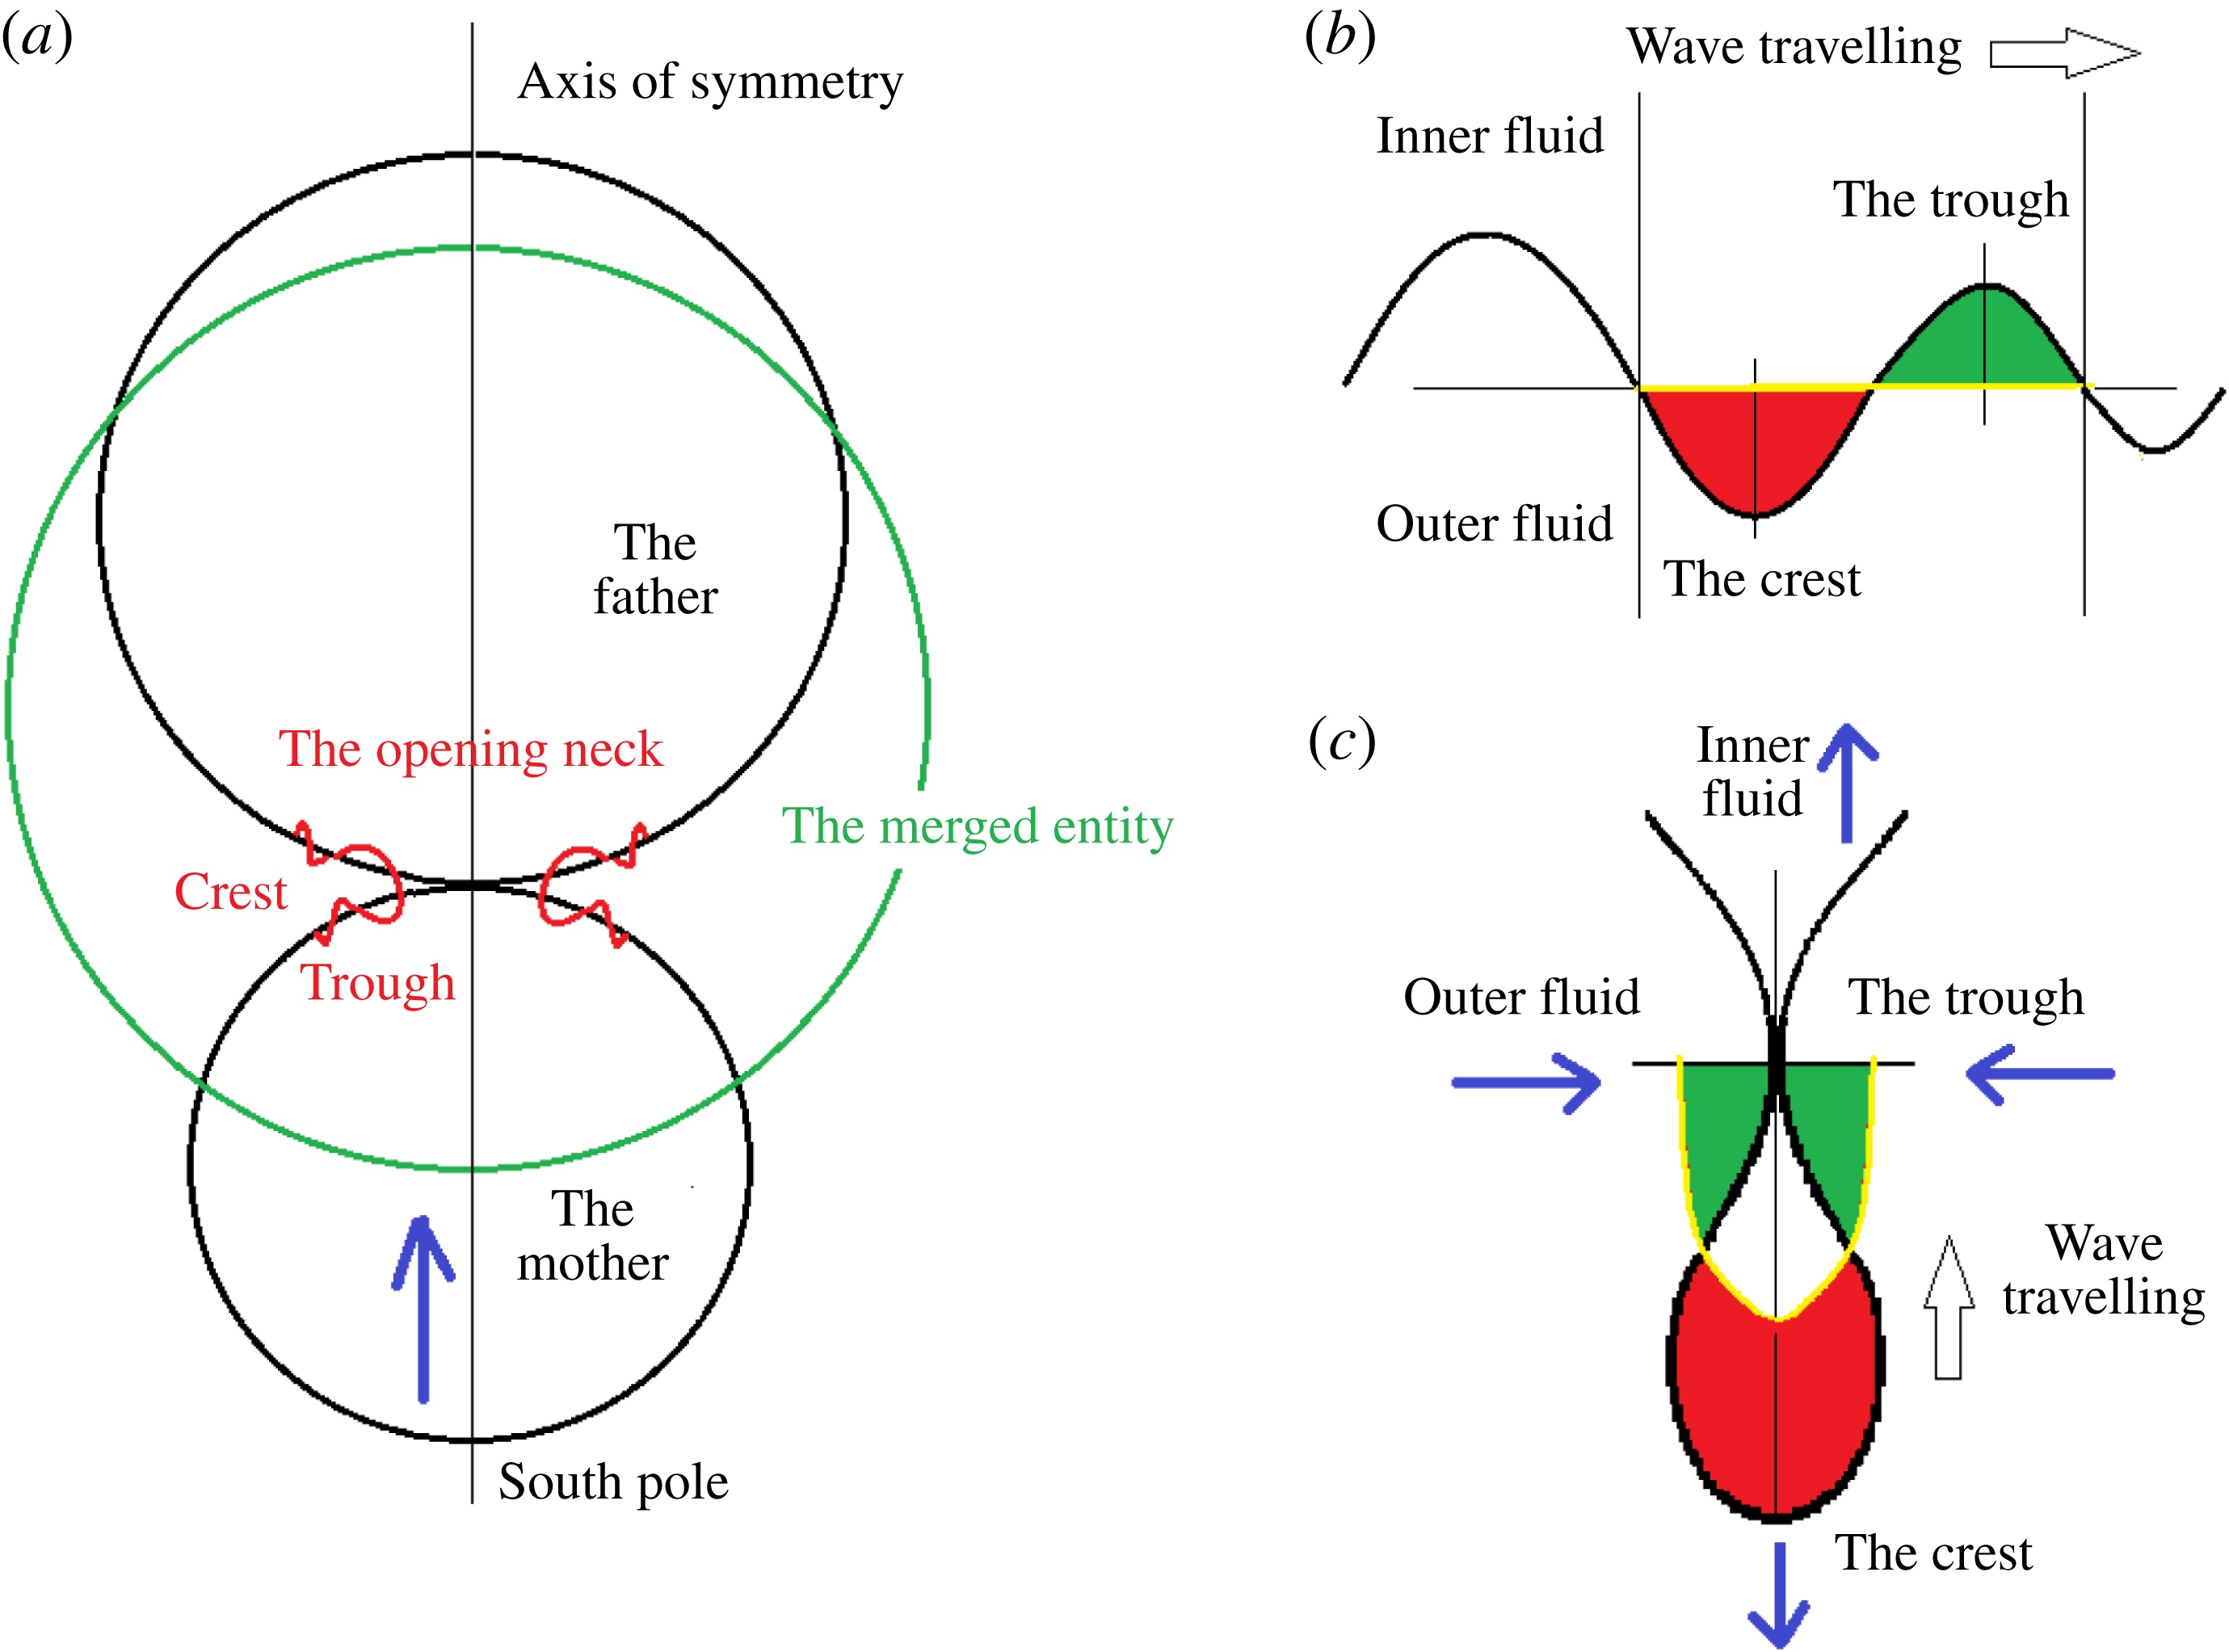
During the coalescence of two bubbles or drops, as shown schematically in figure 6(a), a neck opens connecting the two masses. This neck produces capillary waves, which propagate around the drops towards the poles. At the same time the capillary forces at the far ends, i.e. the south pole of the mother and the north pole of the father, drive them to retract towards the centre of mass to form a merged sphere. This is the overall deformation of the mother and father induced by the coalescence. During the focusing of the capillary waves on the apex, the amplitude of each wave increases due to the concentration of wave energy in a smaller surface area (Zhang & Thoroddsen Reference Zhang and Thoroddsen2008).
(a) Schematic of the generation of capillary waves during the start of coalescence; (b) the propagation of the unwrapped wave along a flat interface; and (c) focusing of the waves at the mother apex inducing the pinch-off.

The magnitude of the concentration and amplitude amplification depends on the local surface geometry, which in turn varies by the overall deformation, as evident in figure 5. Therefore, the deformation of the mother and the father during the coalescence corresponds to superposition of the overall deformation and the wave motion.
Figure 6(b) shows a schematic wave travelling on a flat interface, while figure 6(c) shows a schematic wave travelling asymmetrically along the mother surface and focusing on its south pole. While the crest of a wave arrives at and stretches downwards (bottom vertical arrow) the south pole, thus producing a local downward protrusion (Blanchette & Bigioni Reference Blanchette and Bigioni2006), the trough of the wave travels already upwards and imparts momentum towards the centre of the protrusion, thus inducing a neck (two horizontal arrows) on the protrusion surface. On the other hand, the south cap of the mother ascends (as pointed out by the arrow in figure 6
a and the upper vertical arrow in figure 6
c) due to the overall drainage and merging of the mother and the father. This motion stretches upwards the base of the protrusion; consequently, it further thins the minimum neck of the protrusion. If the amplitude of the wave is large enough so that this combined effect of stretching and thinning can induce self-intersection of the trough, or form a capillary-unstable neck, then the protrusion is truncated with a satellite of radius
 $R_{s}$
pinched off from the mother. Otherwise, this wave passes by, reflecting at the pole, and a wave of longer wavelength and thus lower travelling speed undergoes a similar process at the south pole; so on and so forth till finally the mother is drained into the father, which has a larger size, thus a lower capillary pressure, than the mother. The sequence of waves arriving at the pole have increasing wavelengths and amplitudes, as was shown by Zhang & Thoroddsen (Reference Zhang and Thoroddsen2008) (their figures 2 and 3) and Gilet et al. (Reference Gilet, Mulleners, Lecomte, Vandewalle and Dorbolo2007a
) (their figure 8).
Blanchette & Bigioni (Reference Blanchette and Bigioni2006) showed for drops that the induced velocity is necessary for the pinch-off, while pure capillary-driven instability is not sufficient for the pinch-off of the protrusion. This they demonstrated by suddenly turning off the velocities in their simulations, when the apex was stretched to its maximum. The subsequent motions, when starting from rest, do not pinch off a satellite.
4.2. Satellite size from the wavelength
The focusing of which wave is most important for satellite formation? To answer this, we need to analyse the wave speeds and wavelengths of the different modes that contribute to the pinch-off. First we connect the volume of the satellite to the wavelength of this primary wave
 ${\it\lambda}_{p}$
. We define mode
 $n$
as the ratio of the mother perimeter to the wavelength
 ${\it\lambda}$
, i.e.
 $n=2{\rm\pi}R_{m}/{\it\lambda}$
. In figure 6, providing that the crest and trough of the wave in figure 6(b) have similar amplitudes, the volume of the red section approximately equals that of the green section. Thus in figure 6(c) the axisymmetric volume of the pinched off satellite approximately equals that of the half-ellipsoid between the yellow curve of length
 ${\it\lambda}$
and the black horizontal line at the pinch-off point. We estimate this volume as that of a hemisphere with the same circumference, and therefore of radius
 ${\it\lambda}/{\rm\pi}$
. We can thereby connect the wavelength of the mode to the satellite size, i.e.
 $(2/3){\rm\pi}({\it\lambda}/{\rm\pi})^{3}=(4/3){\rm\pi}R_{s}^{3}$
. Therefore, we connect the mode to the normalized satellite size by
 $$\begin{eqnarray}n=4^{1/3}\frac{R_{m}}{R_{s}}.\end{eqnarray}$$
In other words,
 $R_{s}\simeq 0.25{\it\lambda}$
, which means that the number
 $n$
can be calculated from the size ratio between the satellite and its mother. As expected, the larger satellites are pinched off by the focusing of longer waves. This leads to
 $n\simeq 16$
for the typical case of air bubbles in water with
 ${\it\alpha}=R_{s}/R_{m}=0.1$
, while
 $n\simeq 3$
or 4 for the typical case of a water drop in air with
 ${\it\alpha}$
between 0.40 and 0.53. This result differs significantly from that of Gilet et al. (Reference Gilet, Mulleners, Lecomte, Vandewalle and Dorbolo2007a
), where they find the most prominent Legendre mode for a drop to be
 $n=11$
, calculated from the phase velocity along the drop.
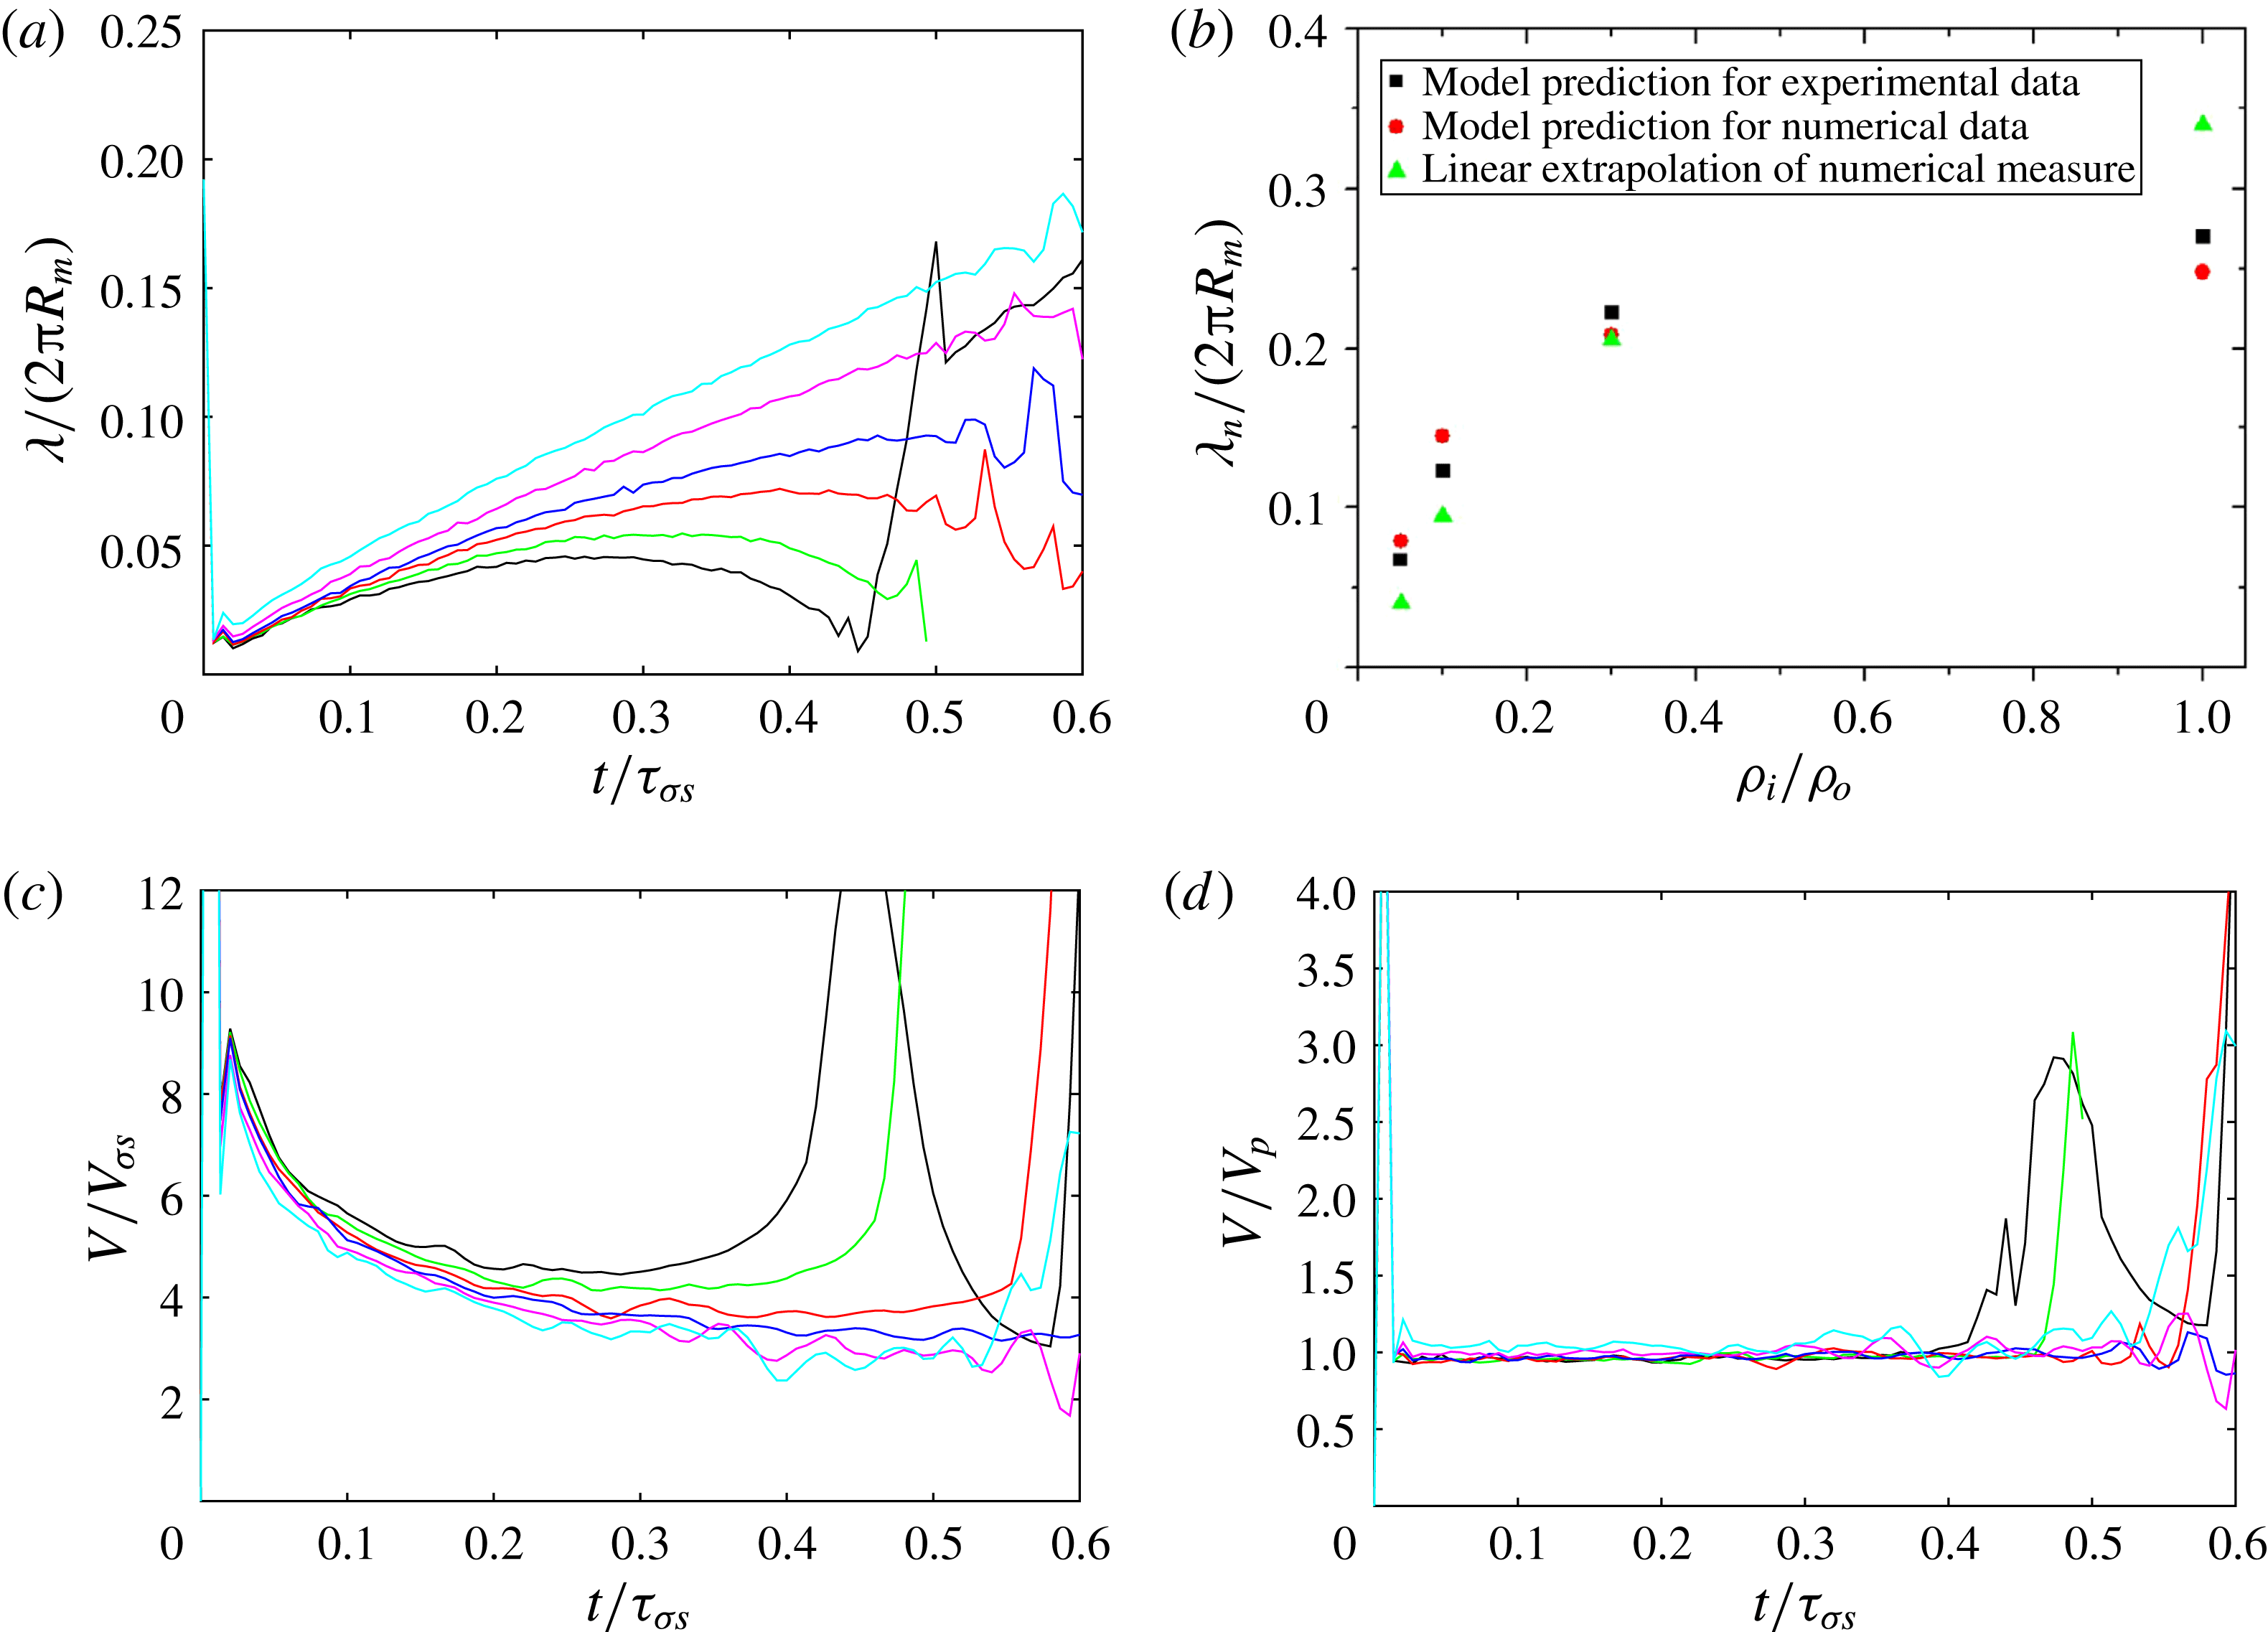
Wavelength and propagation velocity of the primary wave from numerical simulations, for six different density ratios
 $D={\it\rho}_{i}/{\it\rho}_{o}=0.001$
(black), 0.015 (green), 0.050 (red), 0.100 (blue), 0.300 (magenta) and 1.000 (cyan). (a) The measured non-dimensional wavelength
 ${\it\lambda}/2{\rm\pi}R_{m}$
. (b) Comparison of this estimated wavelength (triangles) with those predicted by our model of (4.1) using data of satellite/mother size ratio from experiments (squares) and simulation (circles). (c) The measured wave propagation velocity. (d) Ratio of the local wave velocity as in (c) but now normalized by the local phase velocity
 $V_{p}=V_{{\it\sigma}s}\sqrt{2{\rm\pi}R_{m}/{\it\lambda}}$
calculated from the measured non-dimensional wavelength from (a).

To check this model, we have, with the aid of the high spatial resolution of our simulations, traced the wavelength of the primary wave, i.e. the wave that pinches off during its focusing at the apex. The primary wave can be identified in the simulations as the crest connecting the opening neck and the undisturbed mother bubble south pole. The length of this crest therefore gives half of the wavelength of the primary wave, as it contains only half of an oscillation. It is defined formally with the curvature of the interface in a vertical plane. The wave propagates around the mother bubble, with curvature
 $1/R_{m}$
if it is undisturbed. The length of the crest is therefore defined as the distance between the two points of curvature
 $1/R_{m}$
, around the point of local maximum curvature corresponding to the highest point of the crest. Figure 7 shows the results for a set of typical density ratios. It reveals that the wavelength of the primary wave is not constant, but can lengthen or shorten during the propagation. Even though the wavelengths start from a similar value, for the various density ratios, they grow during the propagation at lower rate when the density ratio is smaller. The growth is due to the dispersion of the capillary waves, with phase velocity
 $$\begin{eqnarray}V_{p}=\sqrt{\frac{2{\rm\pi}{\it\sigma}}{{\it\lambda}({\it\rho}_{i}+{\it\rho}_{o})}}\end{eqnarray}$$
on a flat surface (Lamb Reference Lamb1975, § 266) where shorter waves travel faster. The smaller density ratio renders slightly faster neck opening for bubbles than drops (see Thoroddsen et al.
Reference Thoroddsen, Etoh, Takehara and Ootsuka2005a
). The bubble case can thus generate shorter, higher-frequency waves than the drop. However, surprisingly, at later times we observe qualitatively different behaviour, with decreasing wavelength for the lower density ratios, while continuing growth in
 ${\it\lambda}$
for higher density ratios.
Thereby, the waves have very different wavelengths when they focus at the apex. This method of tracking the wavelength of the propagating wave, using the numerics, stops working when the wave advances close to the apex. This is because of the rebounding of earlier waves from the apex, hindering a clear definition of the wavelength of the advancing wave. To get a rough estimate of the wavelength when it arrives and focuses at the mother apex, we apply a linear extrapolation until the pinch-off time for each of the typical density ratios in figure 7(a). Figure 7(b) shows that (4.1) is a good predictor of the wavelength of the primary mode, i.e.
 $n=4^{1/3}/{\it\alpha}$
.
Why does the wavelength decrease at later times for those small density ratios? When the last wave travels across the equator and approaches the apex, the surface on which it is travelling has been deformed away from being spherical, owing to the drainage flow from the mother to the father. As shown by the arrows in figure 5(a), the deformation of the surface squeezes the wave, inducing a decrease of the wavelength. When the density ratio is smaller, the drainage is faster, and the wave feels this affect earlier. In the next section we look into and model the drainage flow, which will allow us to construct a model to find the primary pinch-off wavelength and thereby predict the variation in the satellite size with density ratio.
4.3. Pinch-off time from the wave velocity
The pinch-off time can also be estimated from the travelling time of the corresponding primary wave from the bottom to the top of the mother, i.e. over a path length of
 ${\rm\pi}R_{m}$
. The phase velocity of a capillary wave of wavelength
 ${\it\lambda}$
is
 $$\begin{eqnarray}V_{p}=\sqrt{\frac{2{\rm\pi}{\it\sigma}}{{\it\lambda}({\it\rho}_{i}+{\it\rho}_{o})}},\end{eqnarray}$$
and after normalization by the capillary–inertial velocity
 $V_{{\it\sigma}s}$
it becomes
 $$\begin{eqnarray}\frac{V_{p}}{V_{{\it\sigma}s}}=\sqrt{\frac{2{\rm\pi}R_{m}}{{\it\lambda}}}=\sqrt{n}.\end{eqnarray}$$
From the simulations, we have above traced the non-dimensional wavelength
 ${\it\lambda}/(2{\rm\pi}R_{m})$
and non-dimensional propagation velocity
 $V_{p}/V_{{\it\sigma}s}$
of the primary wave, as was shown earlier in figure 7(a) and (c), respectively. The method to extract this primary wavelength was explained in § 4.2. Figure 7(d) showed that the capillary wave does propagate at its local phase velocity. Therefore, the dimensional speed of the primary wave changes in time (figure 7
c), as its wavelength changes during the propagation (figure 7
a). For a simple estimate of the pinch-off time, we use the phase velocity of the wave according to its estimated wavelength at the top of the mother (figure 7
b), and add an empirical prefactor
 $C$
to this velocity to represent the average velocity during the whole period. The estimated pinch-off time then becomes
 $$\begin{eqnarray}t_{est}=\frac{{\rm\pi}R_{m}}{CV_{p}}=\frac{{\rm\pi}}{C\sqrt{n}}\sqrt{\frac{({\it\rho}_{i}+{\it\rho}_{o})R_{m}^{3}}{{\it\sigma}}}=\frac{{\rm\pi}}{C\sqrt{n}}{\it\tau}_{{\it\sigma}s}.\end{eqnarray}$$
As was shown in figure 4, the satellite/mother size ratio
 ${\it\alpha}$
increases with density ratio. Thus the corresponding mode number
 $n=4^{1/3}/{\it\alpha}$
decreases with increasing density ratio
 $D$
. Therefore, the estimated non-dimensional pinch-off time
 $t_{est}/{\it\tau}_{{\it\sigma}s}={\rm\pi}/(C\sqrt{n})$
increases with
 $D$
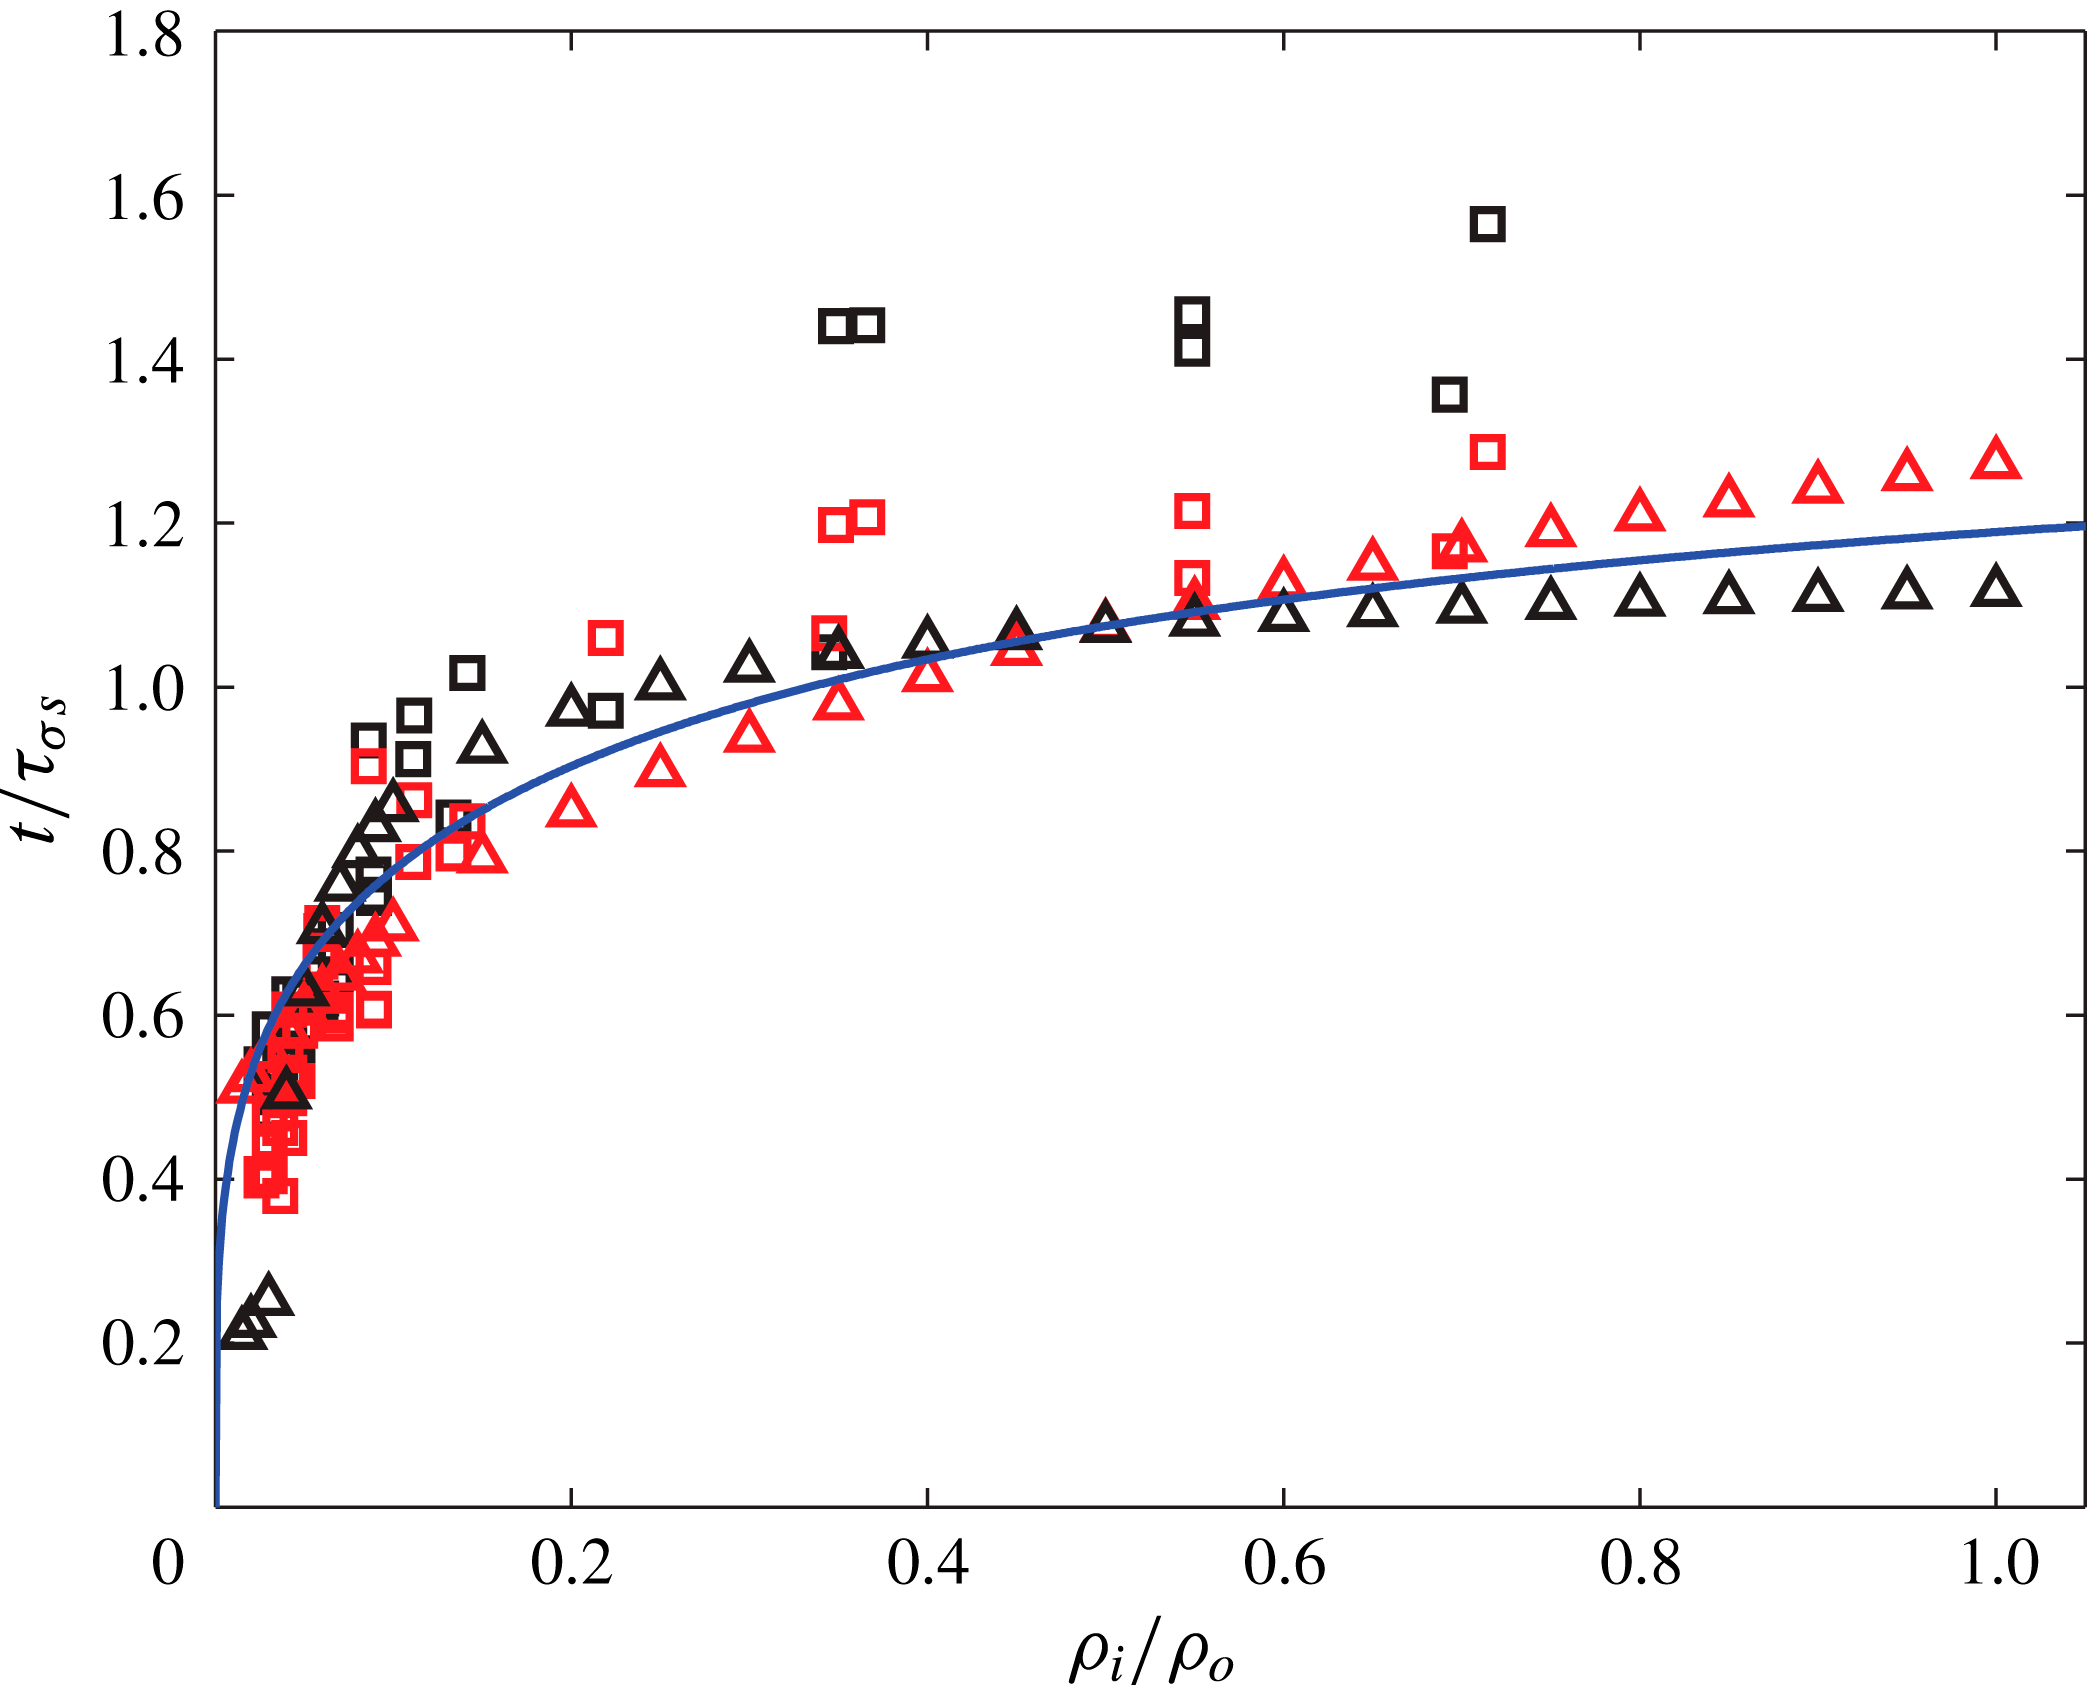
. Figure 8 shows the observed
 $t_{p}/{\it\tau}_{{\it\sigma}s}$
for the set of data in figure 4. It indeed increases with the density ratio and is close to
 $t_{est}/{\it\tau}_{{\it\sigma}s}$
when we set
 $C\simeq 1.4$
. The values observed here for the lowest bubble density of
 $t_{p}/{\it\tau}_{{\it\sigma}s}\simeq 0.5$
(black squares in figure 8) are a little smaller than that in our previous experiments with air, He and SF6 under atmospheric pressure at room temperature, which give this value of approximately 0.68 when
 $R_{f}/R_{m}\simeq 1$
(figure 5 in Zhang & Thoroddsen Reference Zhang and Thoroddsen2008). This difference is likely to be due to the larger
 $R_{f}/R_{m}=30$
used herein.
Comparison between the observed pinch-off time
 $t_{p}$
(black symbols), and those estimated from the wave model of (4.5) (red symbols) or the drainage model of (4.10) (full curve), normalized by the capillary time
 ${\it\tau}_{{\it\sigma}s}$
. In (4.5) we need the satellite size through (4.1). The squares and triangles correspond to results of experiments and simulations, respectively.

4.4. Drainage model
The capillary pressure in a bubble or drop is inversely proportional to its size, through the Young–Laplace law
 ${\rm\Delta}p=2{\it\sigma}/R$
. When the father and mother bubbles make contact, it creates a vertical pressure gradient. This gradient comes from the difference of capillary pressures of the mother and father bubbles, but also from the highly curved region in the neck. We focus here on the case where the father bubble is significantly larger than the mother bubble. We can thus neglect the capillary pressure of the father bubble, and consider that the flow is driven from the mother to the father bubble. Therefore, during the coalescence, as shown in the panels of simulations in figure 3, the inner fluid is drained from the mother through the neck connecting them at the initial contact level. This rate of drainage will depend on both the size of the neck as well as the average vertical flow velocity through the opening, the first of which is a strong function of time.
The neck expands radially driven by the unbalanced surface tension force and retarded by the inertial forces of the inner and outer fluids, which is known to induce the neck radius
 $r_{h}$
to follow a power law (Eggers et al.
Reference Eggers, Lister and Stone1999; Wu, Cubaud & Ho Reference Wu, Cubaud and Ho2004; Thoroddsen et al.
Reference Thoroddsen, Takehara and Etoh2005b
; Gilet et al.
Reference Gilet, Mulleners, Lecomte, Vandewalle and Dorbolo2007a
; Paulsen et al.
Reference Paulsen, Burton, Nagel, Appathurai, Harris and Basaran2012) of the form
 $$\begin{eqnarray}r_{h}\simeq \left[\frac{{\it\sigma}R_{m}}{{\it\rho}_{i}+{\it\rho}_{o}}\right]^{1/4}t^{1/2}.\end{eqnarray}$$
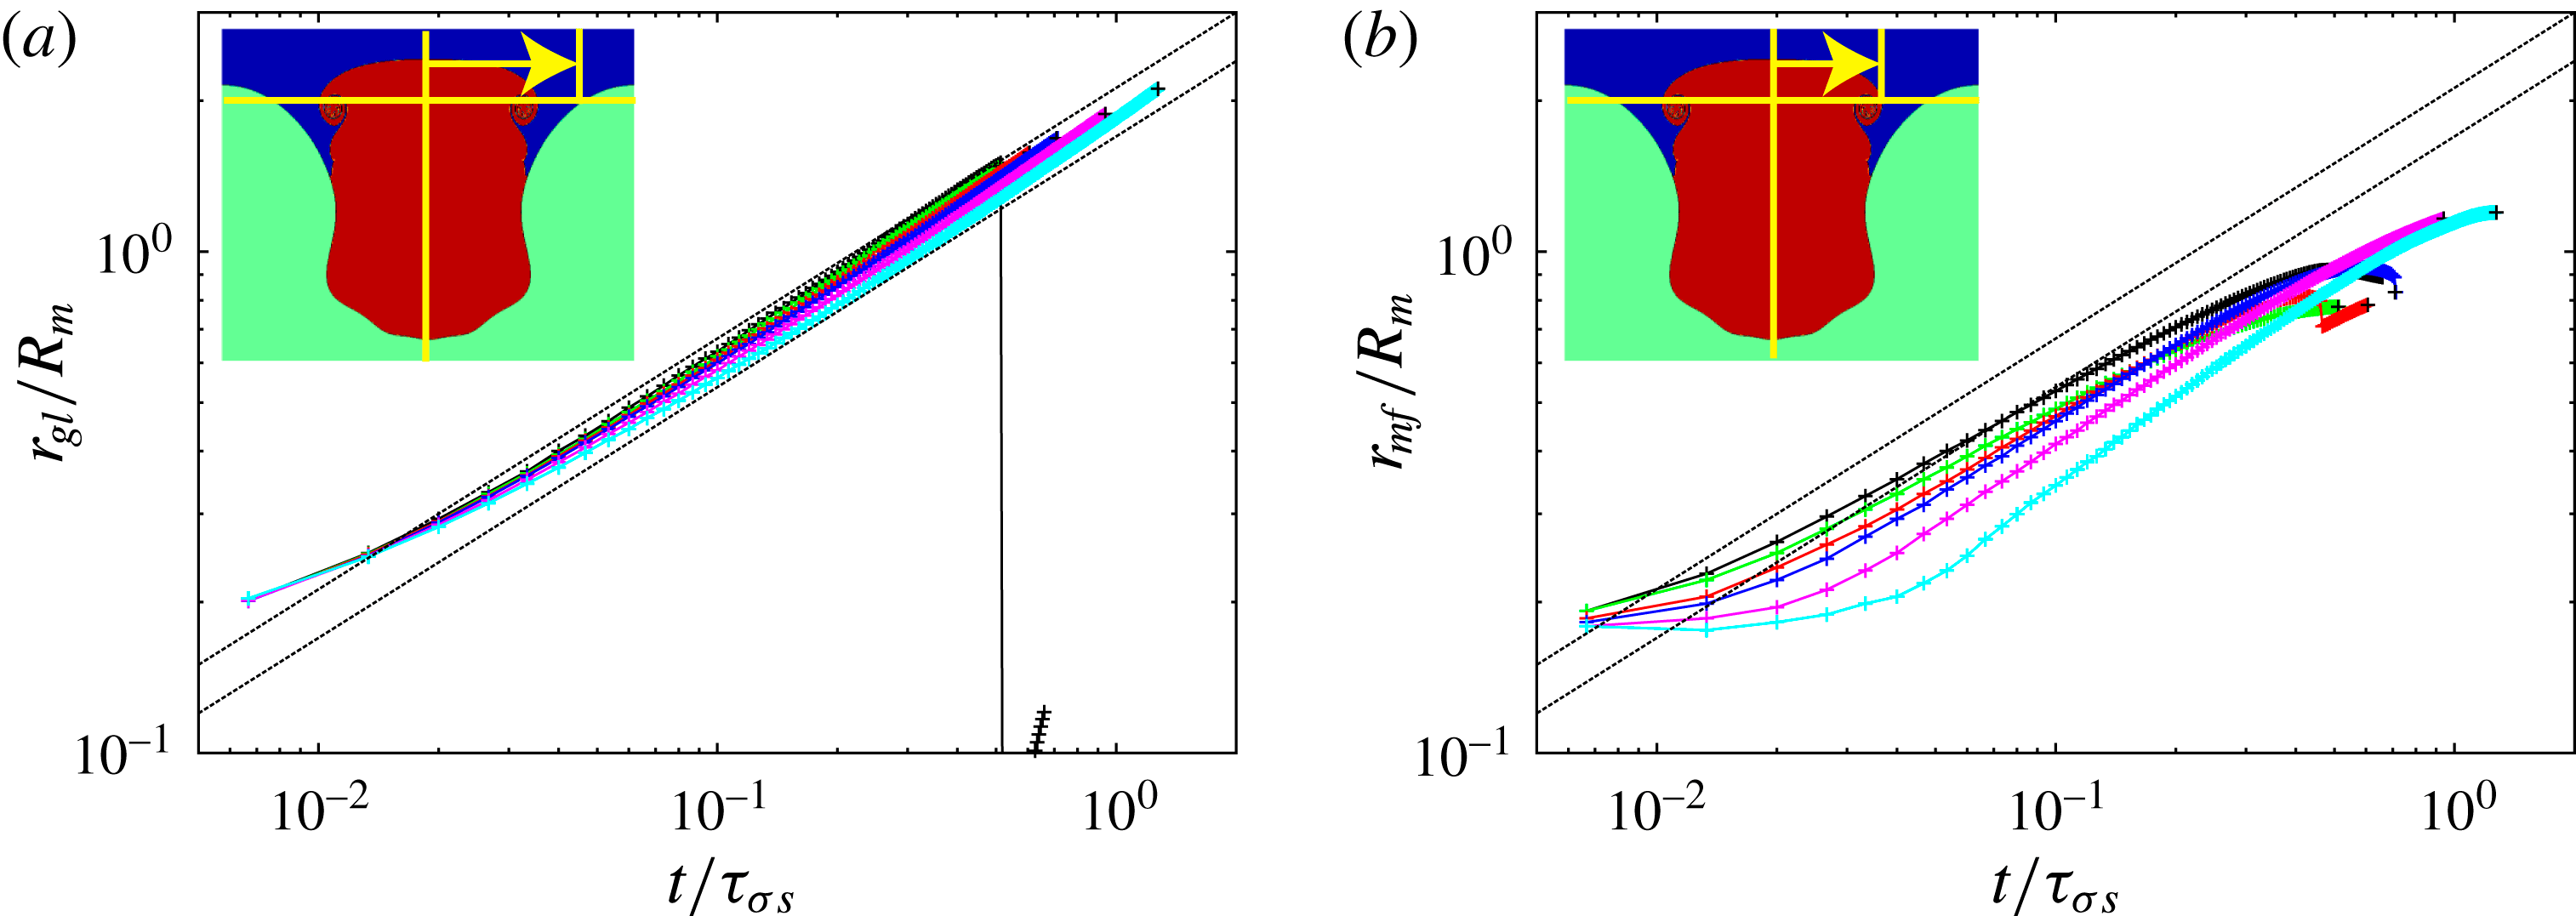
Our simulation data are consistent with such a scaling, as shown in figure 9.
Evolution of the neck radii, from the numerical simulations, at the initial contact level (orange horizontal line in the insets) for (a) the gas–liquid interface
 $r_{gl}$
or (b) the interface between the gas initially in the mother or the father bubble
 $r_{mf}$
. The six representative density ratios are 0.001 (black), 0.015 (green), 0.050 (red), 0.100 (blue), 0.300 (magenta) and 1.000 (cyan). The dotted lines have a slope of
 $1/2$
.

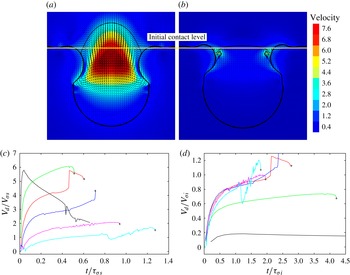
(a,b) Example simulation results of velocity distribution normalized by
 $V_{{\it\sigma}s}$
for
 $D=0.001$
(a) and 1 (b). The drainage velocity
 $V_{d}$
is defined as the average vertical velocity of the fluid initially in the mother bubble (up to
 $r_{mf}$
defined in figure 9
b), across the initial contact level (orange line) into the father. (c,d) Evolution of the average drainage velocity
 $V_{d}$
: (c) normalized by
 $V_{{\it\sigma}s}$
and time by
 ${\it\tau}_{{\it\sigma}s}$
, both based on the summation of the densities; (d) normalized by the values based only on the inner density. The selected six representative density ratios are 0.001 (black), 0.015 (green), 0.050 (red), 0.100 (blue), 0.300 (magenta) and 1.000 (cyan). The
 $+$
symbols indicate the satellite pinch-off time.

The drainage velocity is not uniform within the cross-section at the initial contact level, as is clear from figure 10(a,b). However, for simplicity of modelling, we define an average drainage velocity
 $V_{d}$
at this cross-section. Figure 10(c,d) shows that
 $V_{d}$
depends primarily on the inner density
 ${\it\rho}_{i}$
. This becomes clear by contrasting the two normalizations shown in the figure. It shows the drainage velocities over the entire range of density ratios of 0.001, 0.015, 0.05, 0.1, 0.3 and 1. In figure 10(c) we normalize the axes by the capillary–inertial velocity
 $V_{{\it\sigma}s}$
and time
 ${\it\tau}_{{\it\sigma}s}$
based on the summation of the inner and the outer densities, which does not collapse any of the data. In figure 10(d) we normalize using velocity and time scales based only on the inner bubble density, i.e.
 $$\begin{eqnarray}V_{{\it\sigma}i}=\sqrt{\frac{{\it\sigma}}{{\it\rho}_{i}R_{m}}},\quad {\it\tau}_{{\it\sigma}i}=\sqrt{\frac{{\it\rho}_{i}R_{m}^{3}}{{\it\sigma}}},\end{eqnarray}$$
which shows good collapse of the data for all but the lowest bubble densities. It is not surprising that the scaling fails for the lowest density ratios (smaller than 0.05), as it would predict an infinite drainage velocity. In other words, when the inner density becomes negligible, the inertia of the outer liquid takes over. For the larger density ratios, the scaling correctly gives a velocity of order one. See also results from numerics of Chen et al. (Reference Chen, Mandre and Feng2006). After the initial rapid acceleration,
 $V_{d}$
increases slowly during most of the time, indicating that we can approximate it as a constant. Note that, even though
 $V_{d}$
increases rapidly during the earliest times, the hole radius is small then. Consequently, our approximation renders only a small error in the total drainage volume. For the density ratios larger than 0.05, our results in figure 10(d) roughly lead to
 $$\begin{eqnarray}V_{d}=0.8\sqrt{\frac{{\it\sigma}}{{\it\rho}_{i}R_{m}}}.\end{eqnarray}$$
In other words, since the drainage flow of the inner fluid is driven by the capillary force and is retarded mainly by the inertia of the inner fluid, the drainage velocity, averaged across the initial contact level within the enlarging hole, should scale with the inner density as
 $V_{d}\simeq 0.8\sqrt{{\it\sigma}/({\it\rho}_{i}R_{m})}$
, where the prefactor is derived from the numerical simulations. Therefore, the drained volume
 $W_{drained}$
of the inner fluid, normalized by its initial mother volume
 $W_{m}$
, scales as
 $$\begin{eqnarray}\frac{W_{\mathit{drained}}}{W_{m}}=\frac{1}{\frac{4}{3}{\rm\pi}R_{m}^{3}}\int _{0}^{t}{\rm\pi}r_{h}^{2}V_{d}\,\text{d}t=0.3\sqrt{1+\frac{{\it\rho}_{o}}{{\it\rho}_{i}}}\left(\frac{t}{{\it\tau}_{{\it\sigma}s}}\right)^{2}.\end{eqnarray}$$
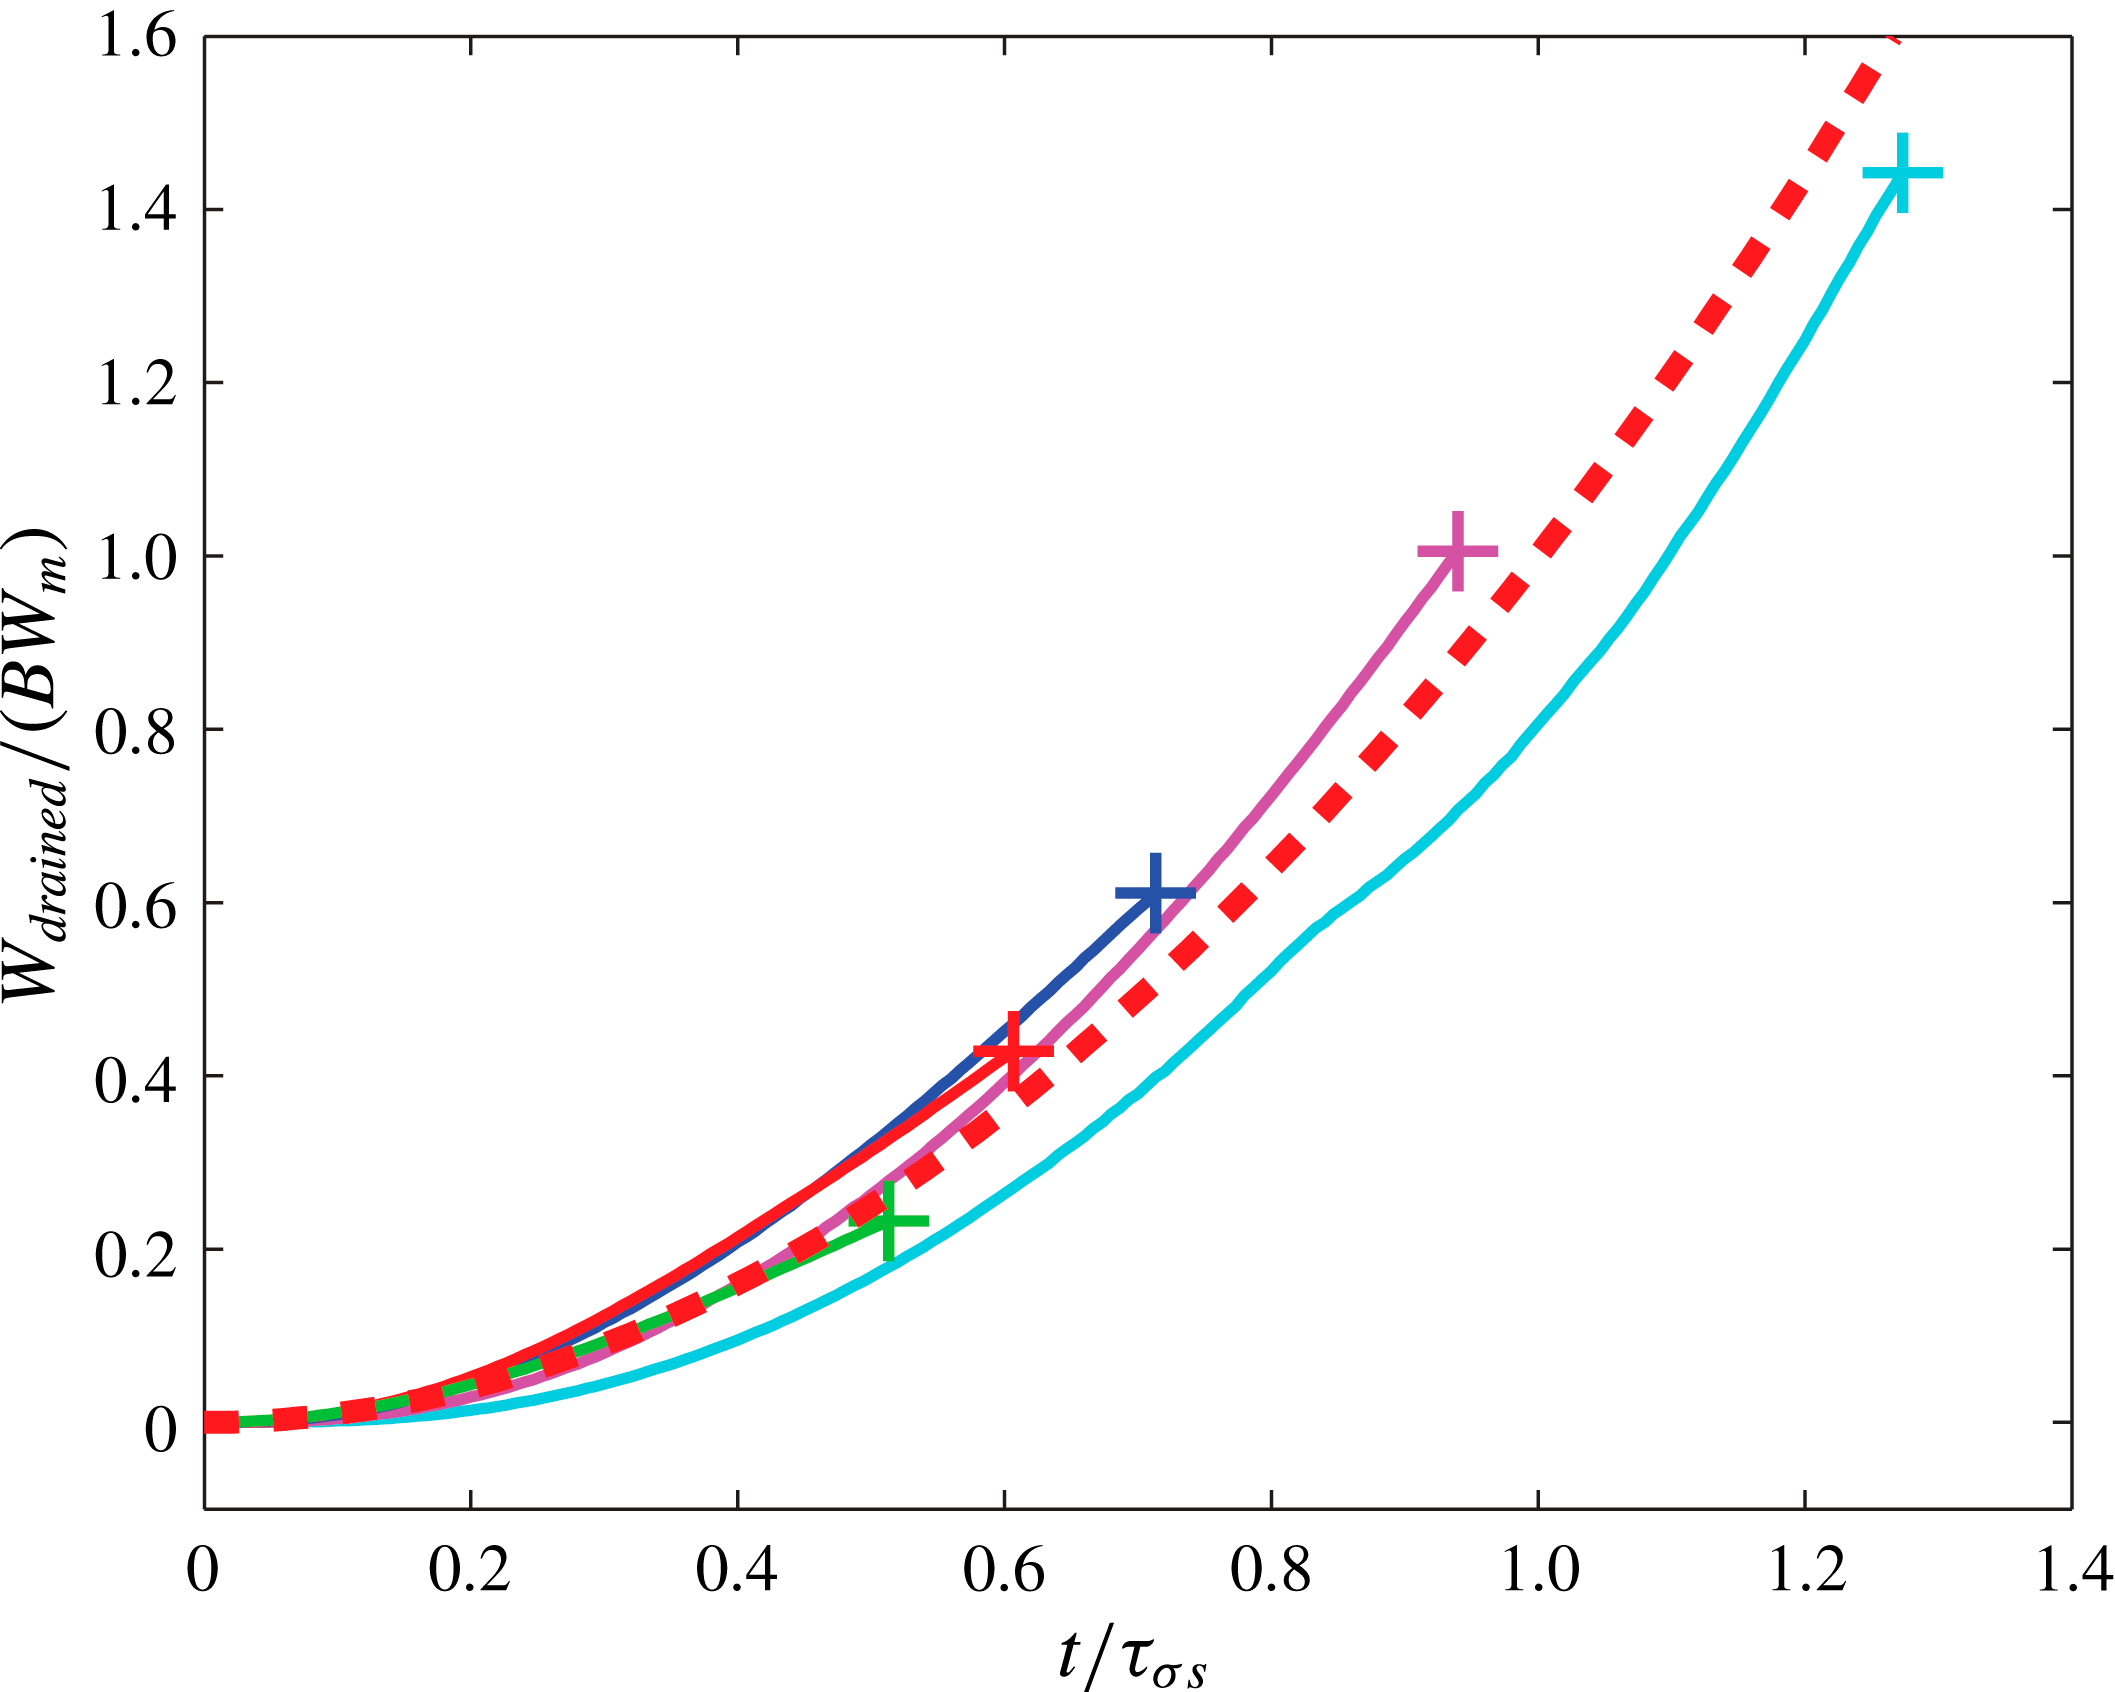
The numerical simulations in figure 11 confirm roughly this drainage law of power 2 with respect to time, for all the density ratios.
The drainage flow from the mother to the father. The selected six density ratios are 0.001 (black), 0.015 (green), 0.050 (red), 0.100 (blue), 0.300 (magenta) and 1.000 (cyan). The plot shows the evolution of the drained volume (measured from our simulation) of the fluid initially inside the mother across the initial contact level into the father, normalized by the initial volume of the mother. Comparison between the function
 $y=x^{2}$
(dashed curve) and the curves after including the prefactor
 $B=0.3\sqrt{1+{\it\rho}_{o}/{\it\rho}_{i}}$
from (4.9).

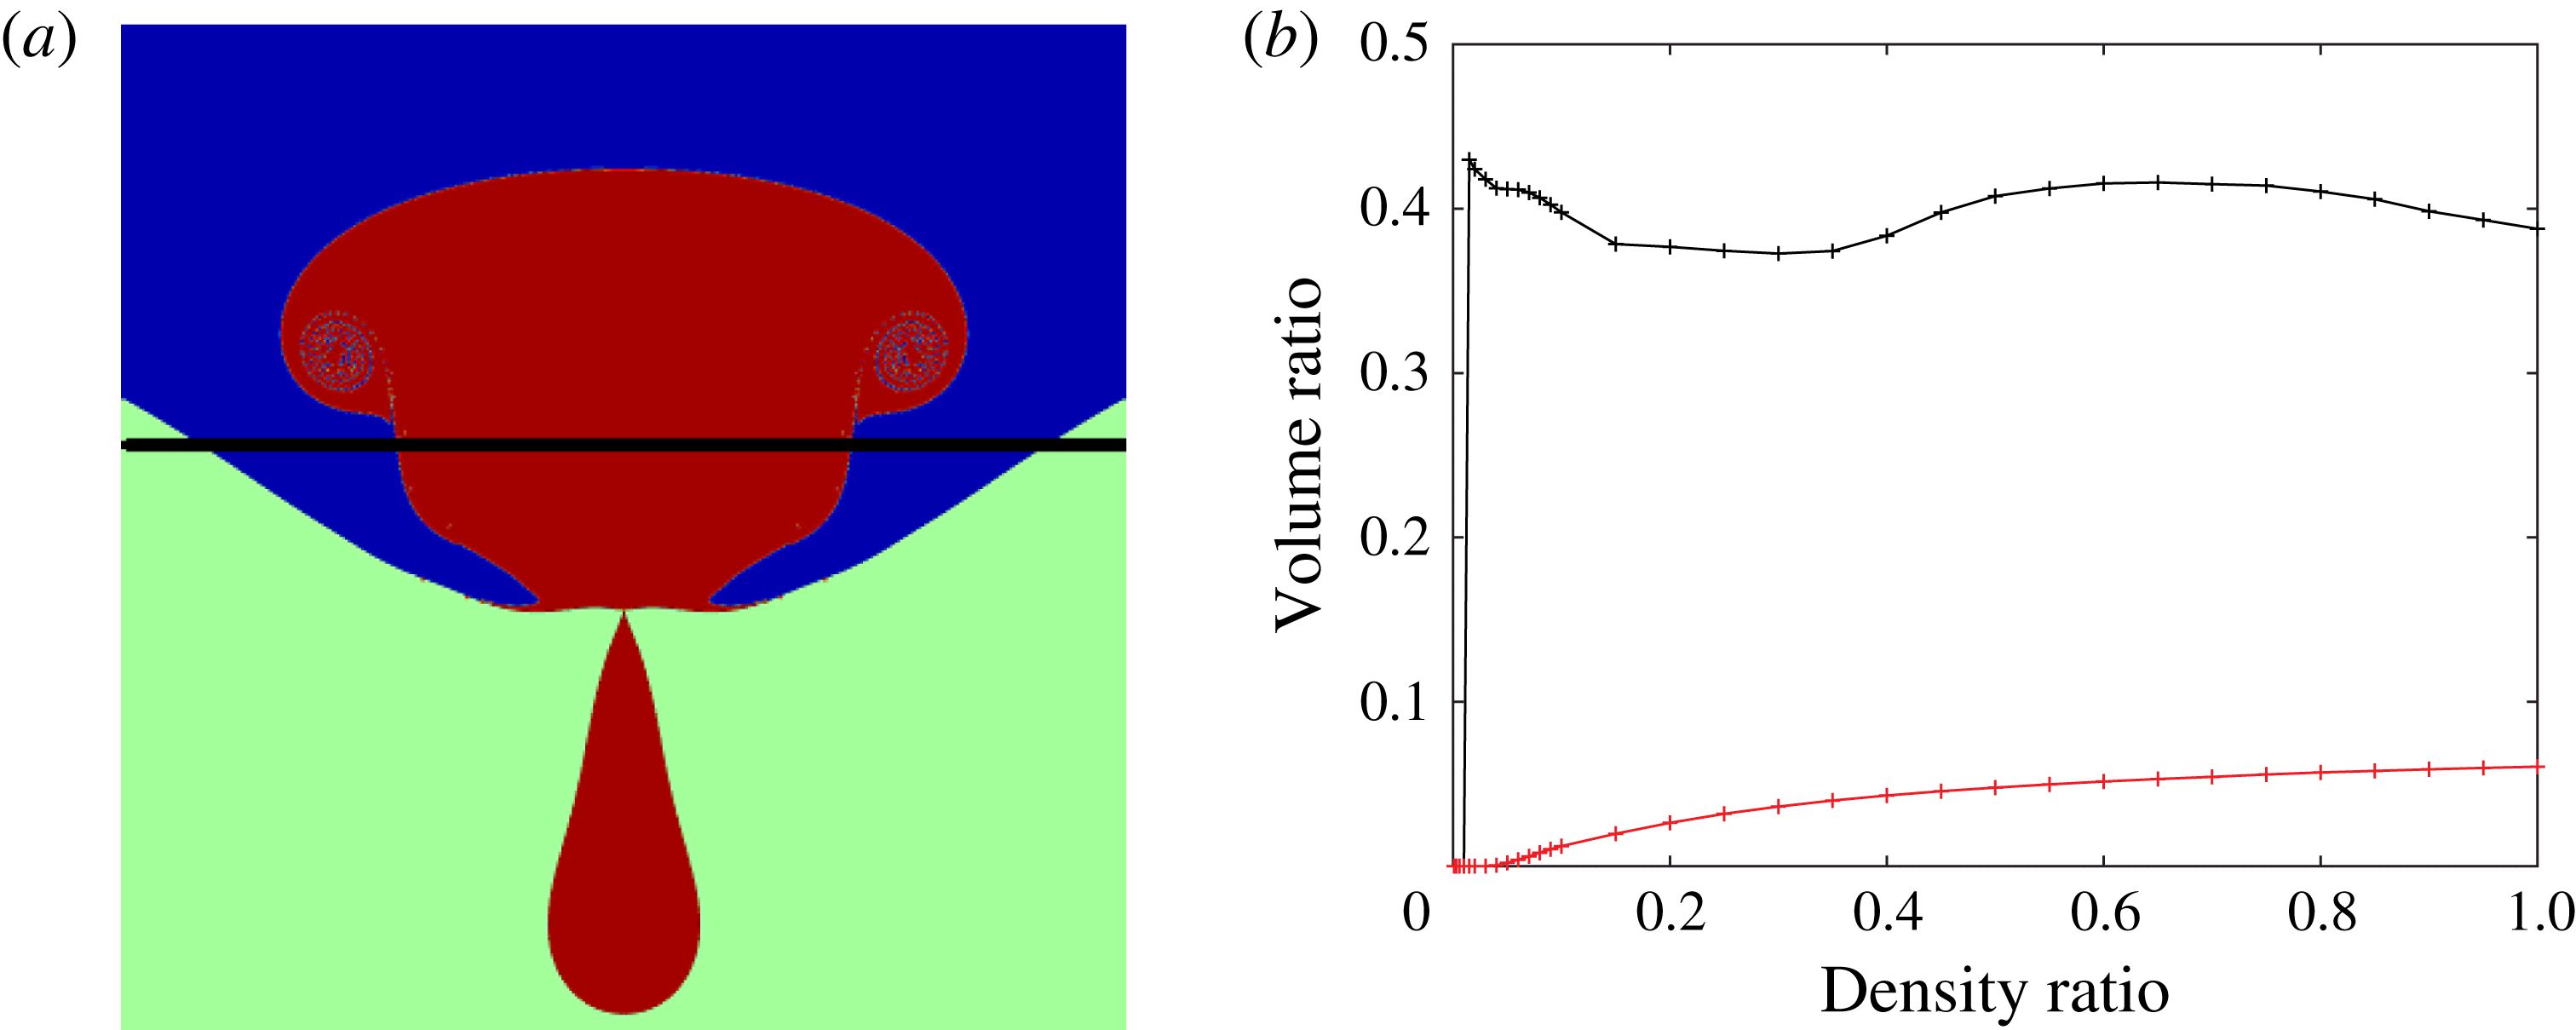
(a) A snapshot of the gas distribution (red region) at the time of pinch-off. The black line marks the initial contact level. (b) The characteristic drained volume at the time of the pinch-off versus the density ratio, from numerical simulations. The black curve shows the fraction of volume of mother fluid remaining behind the initial contact level, i.e. the red part below the black line in (a). The red curve shows the satellite/mother volume ratio, versus the density ratio.

As shown in figure 12, our simulations reveal that approximately 60 % of the volume of the fluid originally in the mother has been driven across the initial contact level at time of the pinch-off. This holds for all the density ratios, for
 $R_{f}/R_{m}=30$
. However, the volume of the satellite grows continuously with the density ratio, shown for reference in the lower curve in figure 12(b). Therefore, the satellite size is not directly determined by the volume of inner fluid drained before the pinch-off time.
The time
 $t_{p}$
from first contact of the drops to the satellite pinch-off is an unambiguous and readily determined quantity. It is therefore often used to characterize the dynamics during partial coalescence. Unexpectedly, figure 12(b) showed that the satellite pinch-off occurs when the drained volume of the inner fluid is approximately 60 % of the initial volume for all the density ratios for
 $R_{f}/R_{m}=30$
. Therefore, substituting
 $W_{\mathit{drained}}/W_{m}=0.6$
and
 $t=t_{p}$
into the above drainage model (4.9), we can express the satellite pinch-off time
 $t_{p}$
by
 $$\begin{eqnarray}\frac{t_{p}}{{\it\tau}_{{\it\sigma}s}}=\sqrt{2}\left(1+\frac{{\it\rho}_{o}}{{\it\rho}_{i}}\right)^{-1/4},\end{eqnarray}$$
which shows good agreement with both our experiments and simulation results, in figure 8.
By combining (4.1), (4.5) and (4.10), we can now predict the satellite size directly from the density ratio, as
 $$\begin{eqnarray}\frac{R_{s}}{R_{m}}\simeq 0.63\left(1+\frac{{\it\rho}_{o}}{{\it\rho}_{i}}\right)^{-1/2}.\end{eqnarray}$$
Figure 4 shows a reasonably good agreement between this formula and both the experimental and numerical observations.
5. A more complex process
The dominant physics behind partial coalescence has been described above with simple scaling arguments in the limit of low Ohnesorge and Bond numbers. The production of the satellite is due to the convergence and focusing of capillary waves on the surface of the mother bubble, combined with the drainage of the mother bubble into the father bubble. The density ratio affects the drainage velocity, and therefore the wave propagation and the size of the satellite. The model has been validated by comparing the experimental and numerical size of the satellite and the pinch-off time. The different hypotheses involved in the model have been further compared with the numerical simulations to quantitatively understand the limits of the models.
In this section, we describe some more complex dynamics not captured by the simple model.
5.1. Effect of the parent size ratio
The experimental pressure chamber allowed for data collection mostly for cases where
 $R_{m}\ll R_{f}$
. This is limited by the alignment inside the chamber and the dynamics of the bubble release. While we were focusing on the case of a father bubble much larger than the mother bubble in previous sections, we show in figure 13 the satellite size ratio for all our experimental observations. Therefore it includes a wider range of parent size ratios. This leads to a wider spread in the data than in figure 4, where
 $R_{f}/R_{m}\simeq 30$
.
Experimental measurement of the size ratio of the satellite to the mother. Collection of all experimental data spanning conditions for
 $0.003<\mathit{Oh}_{o}<0.034$
and
 $1<R_{f}/R_{m}<185$
.

However, it is not clear how much the spread of the data is due to the father/mother size ratio, or due to the changes in the other non-dimensional parameters as a result of the range of mother bubble sizes. To investigate the sensitivity of the results to the parent size ratio, we turn to the numerics. We change the size of the parent size ratio
 $R_{f}/R_{m}$
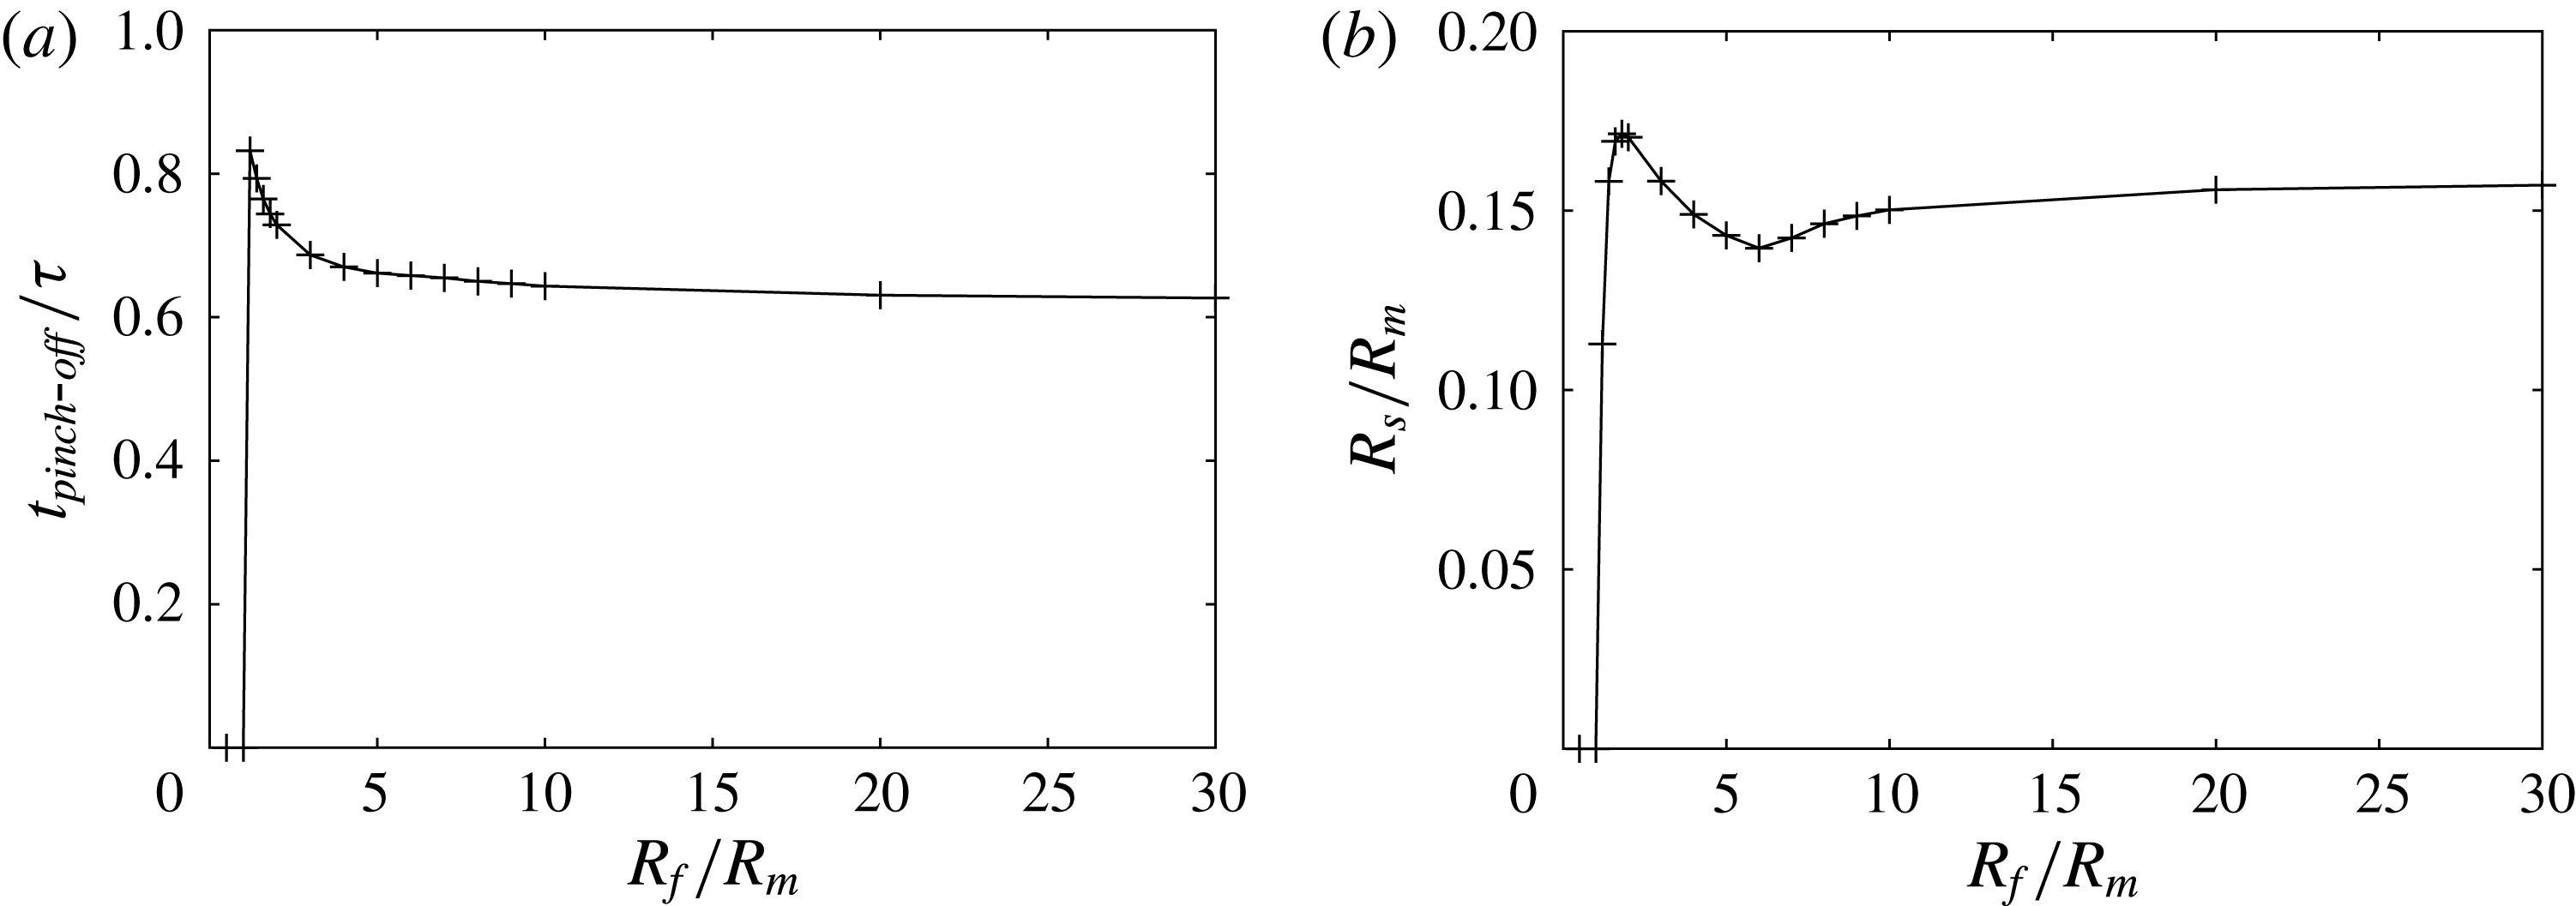
by changing the size of the father, thus keeping the other non-dimensional parameters fixed. Our simulations show that changing the parent size ratio does not significantly change the satellite size and the pinch-off time, but only weakly alters them when
 $R_{f}/R_{m}$
is small and close to the critical value below which no pinch-off occurs, as shown in figure 14. This is expected since the pressure difference between the mother and the father, which drives the drainage flow, is related to the parent size ratio as
 $$\begin{eqnarray}{\rm\Delta}p=\frac{2{\it\sigma}}{R_{m}}\left(1-\frac{1}{R_{f}/R_{m}}\right),\end{eqnarray}$$
which becomes independent of size ratio for large values. The asymptotes for a flat pool surface, corresponding to
 $R_{f}/R_{m}\rightarrow \infty$
, are
 $t_{\mathit{pinch}\text{-}\mathit{off}}/{\it\tau}_{{\it\sigma}s}=0.620$
(compared to 0.627 at
 $R_{f}/R_{m}=30$
) and
 $R_{s}/R_{m}=0.159$
(compared to 0.157 at
 $R_{f}/R_{m}=30$
).
Effect of the parent size ratio on the pinch-off time (a) and the size (b) of the satellite, determined from the numerical simulations. The effect is weak and appears only near the critical parent size ratio below which there is no formation of satellites. For
 ${\it\rho}_{i}/{\it\rho}_{o}=0.060$
.

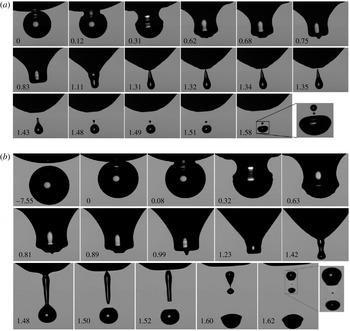
Experiments showing formation of multiple satellites. (a) Sub-satellites generated during retraction of single over-stretched protrusion during focusing of the last wave. Listed times are in milliseconds relative to the onset of coalescence in the first panel. The diameter of the mother bubble is
 $871~{\rm\mu}\text{m}$
. The last panel is magnified three times, showing the three satellites. The outer fluid is deionized water under a pressure of 49.5 atm. The inner fluid, xenon here, has a density of 34.6 % and dynamic viscosity of 4.7 % those of water. The father/mother size ratio is 5.6 (smaller than other cases studied herein). (b) Four-satellite generation from the pinch-off of an extended protrusion. Listed times are in ms. The diameter of the mother bubble is 1.20 mm. The first five panels in the third row, are magnified by a factor of two, with the last one by a factor of 4. Same fluids as in (a), but under a 23.4 atm pressure. The inner density is 13.5 % and dynamic viscosity is 4.1 % that of water. The father/mother size ratio is 3.2.

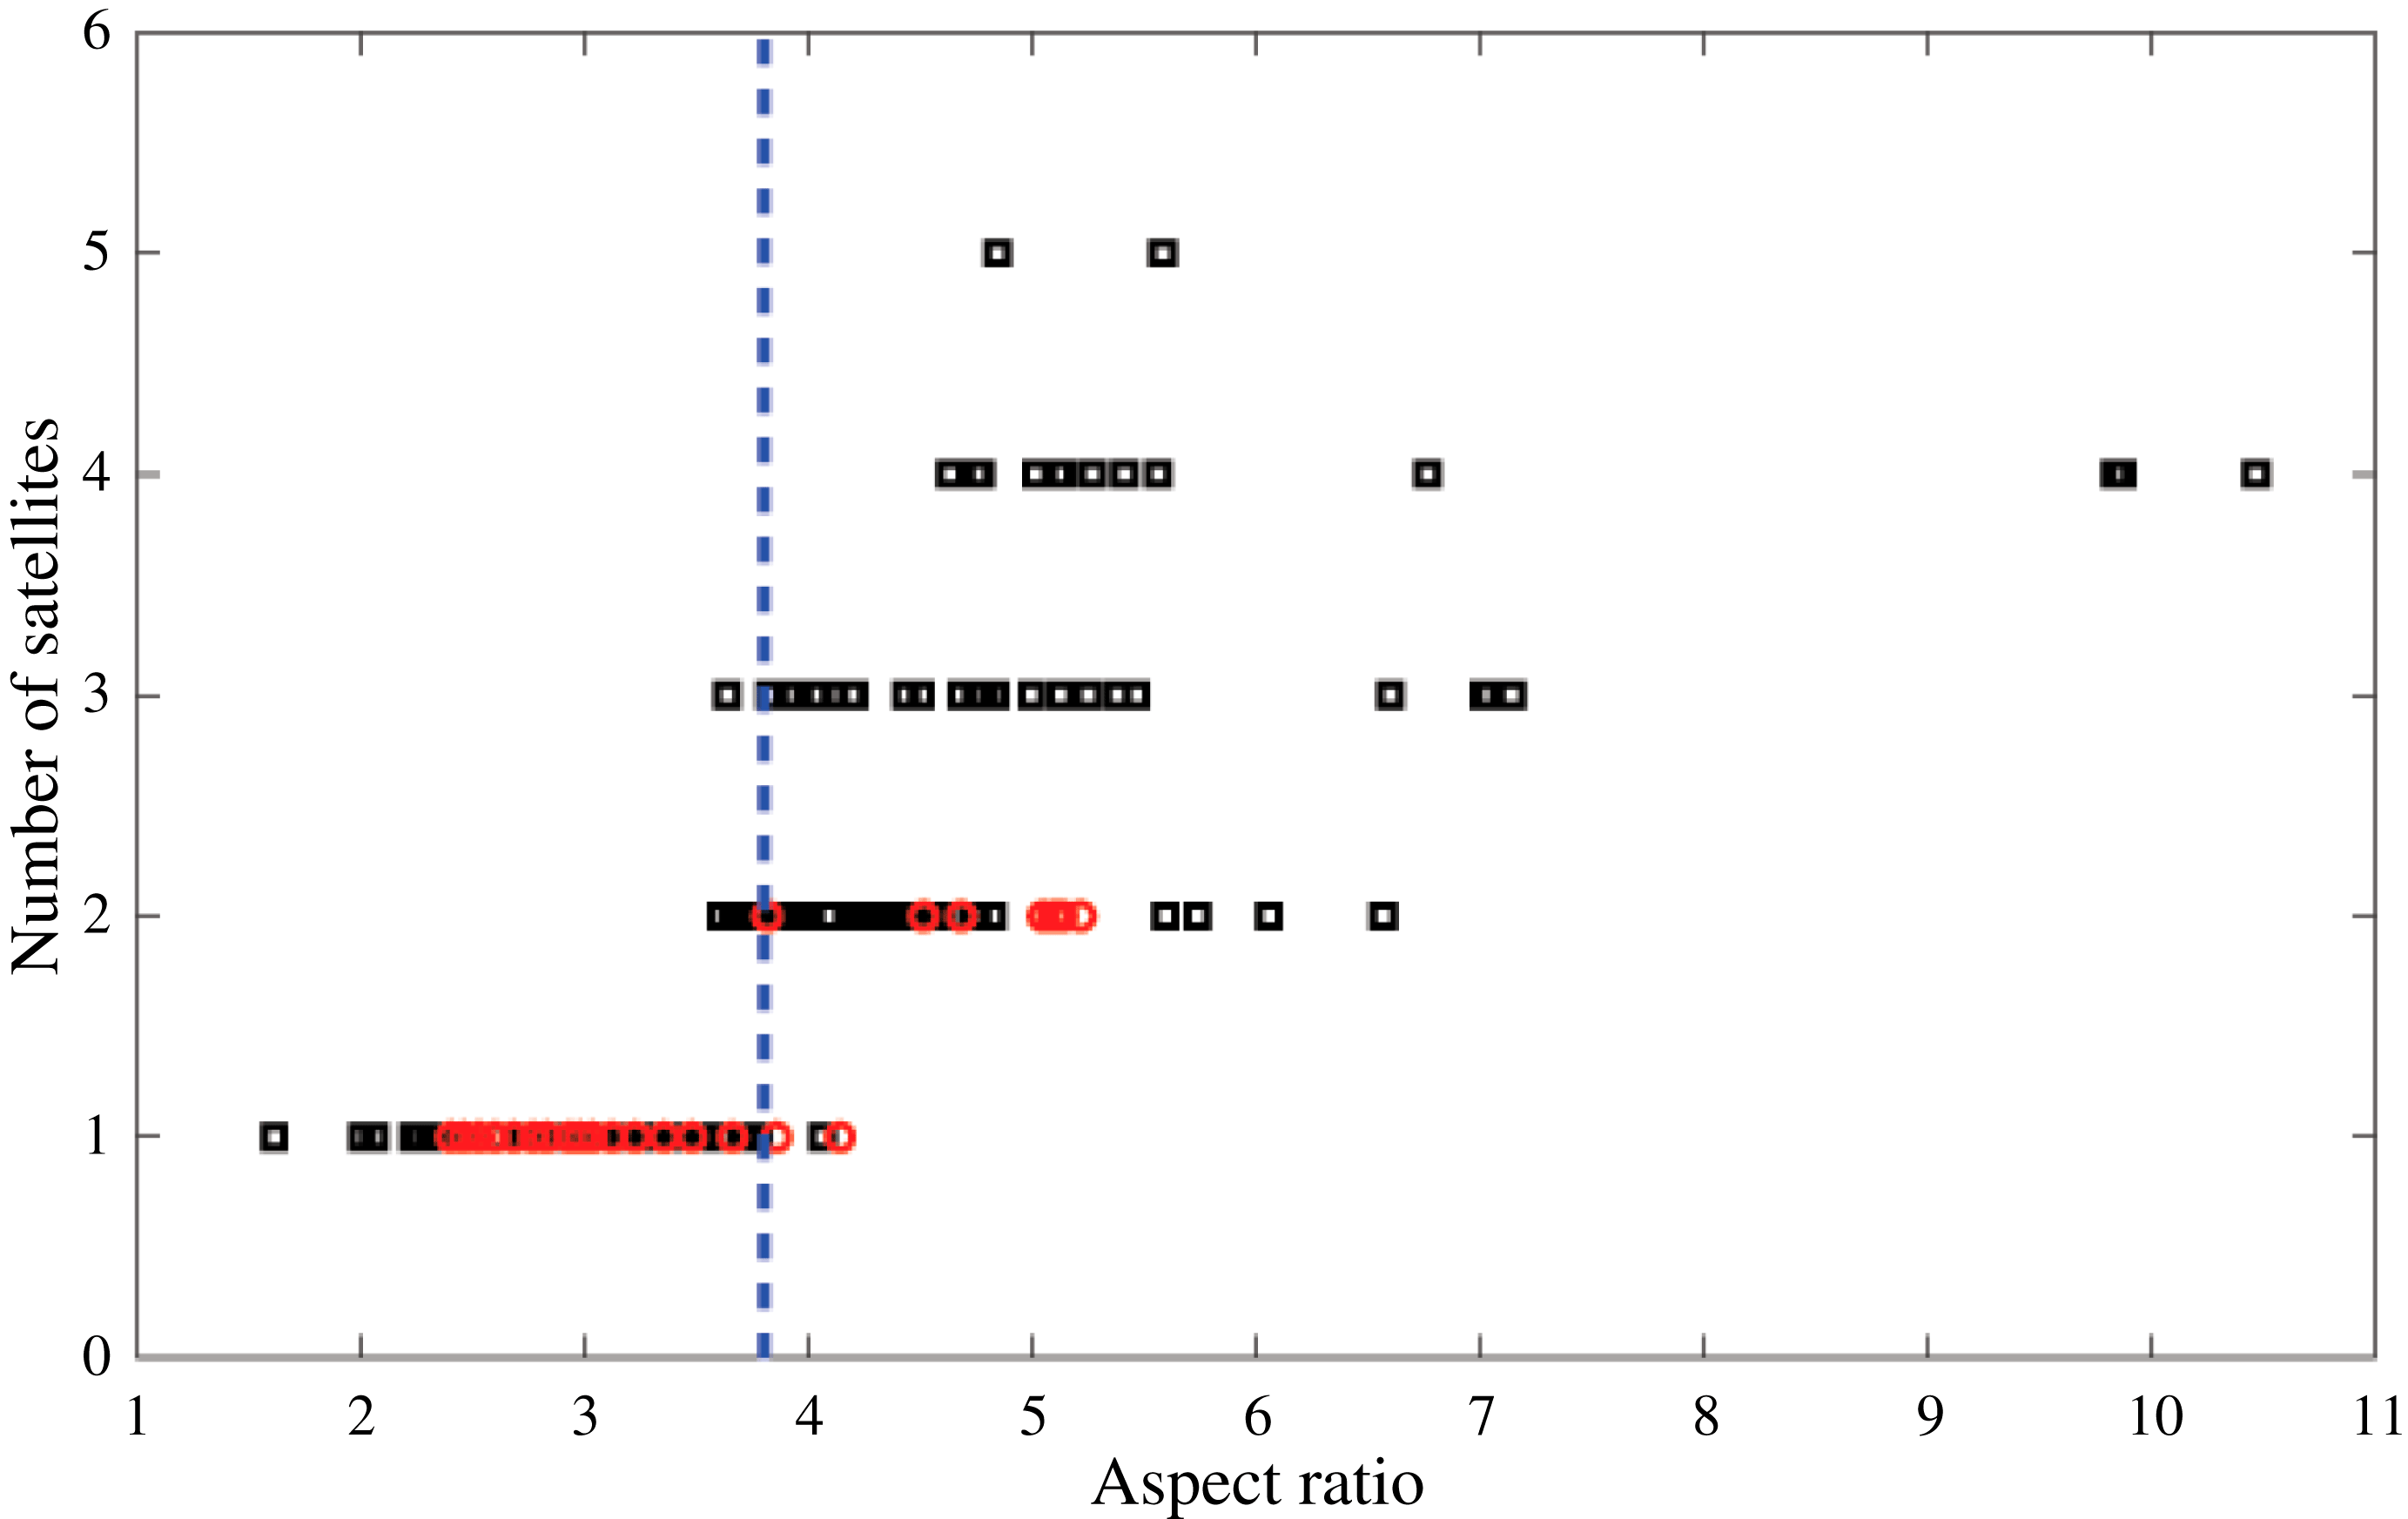
Conditions for the formation of sub-satellites. The dashed line marks the critical aspect ratio above which sub-satellites form, based on both our experiments (black squares) and simulations (red circles). The simulation data are under the condition of
 $R_{f}/R_{m}=30$
, while the experimental data are for a wide range of parent size ratios.

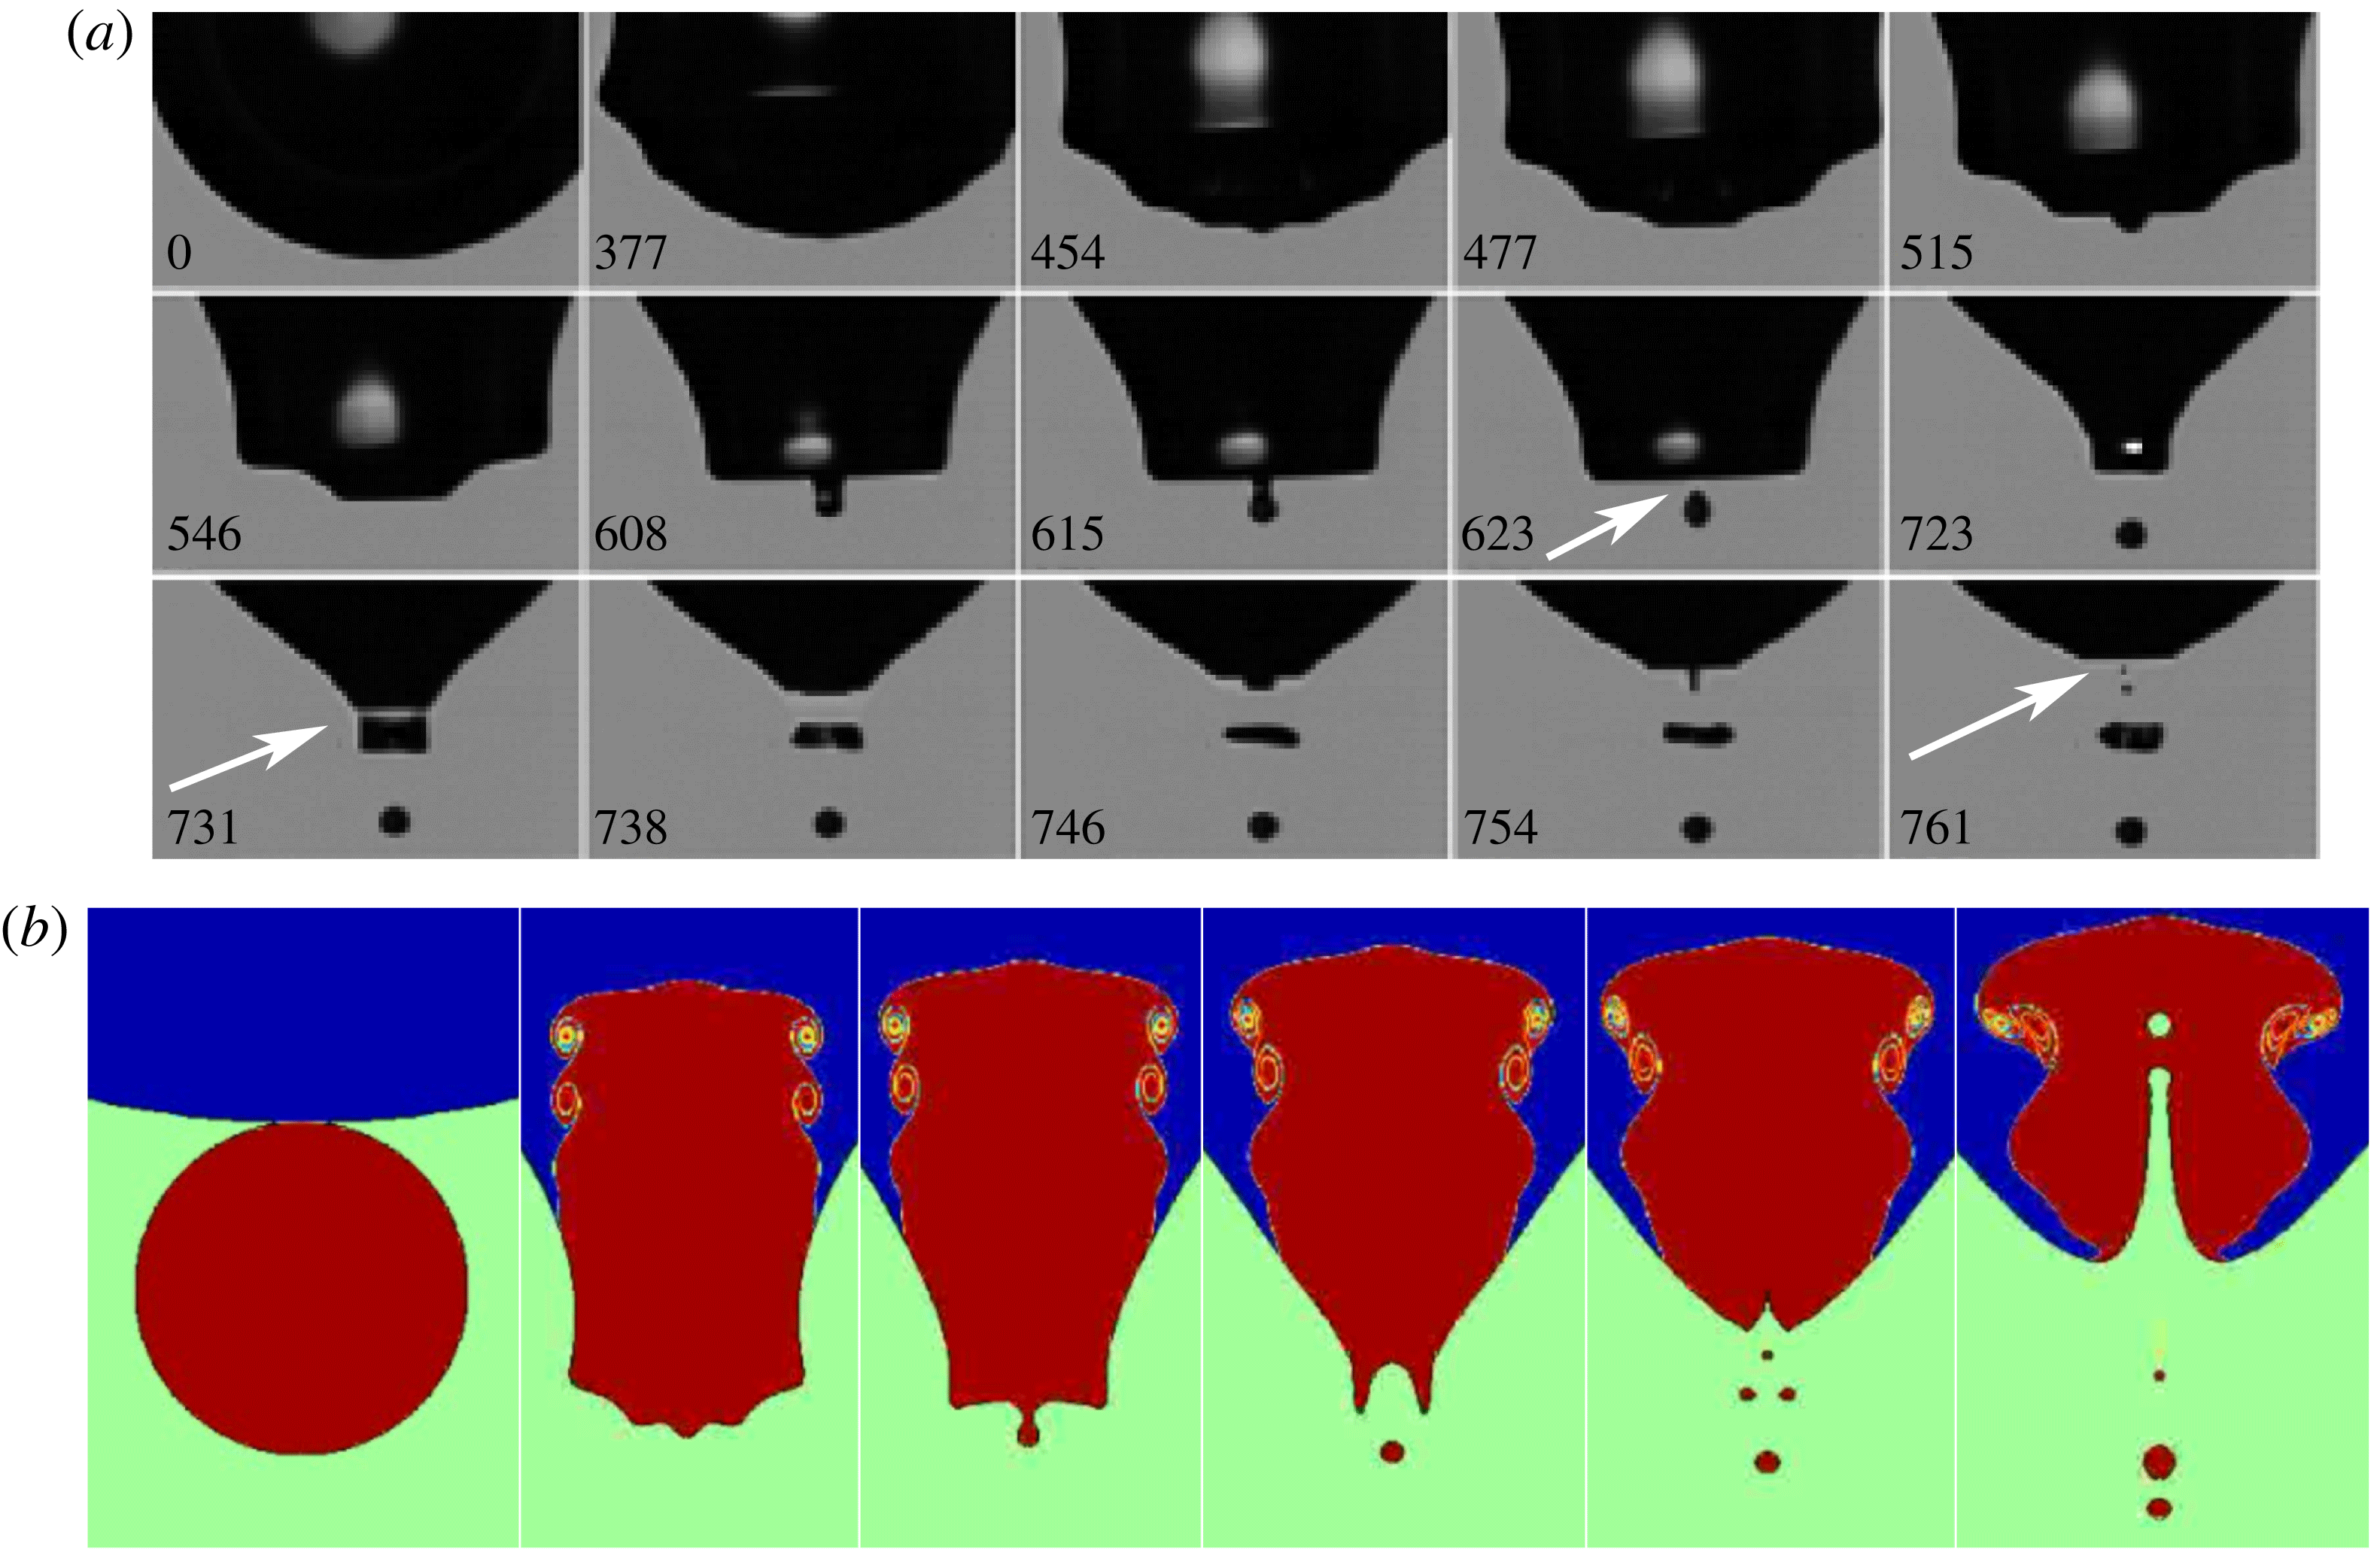
Formation of multiple satellites, from focusing of different waves. (a) Satellite generation from pinch-off of multiple protrusions during the focusing of different waves. Listed times are in microseconds relative to the onset of coalescence in the first panel. The satellite at the bottom is
 $62~{\rm\mu}\text{m}$
in diameter. The outer fluid is deionized water under a pressure of 6.2 atm. Here the inner fluid, xenon, has a density of 3.3 % and dynamic viscosity of 3.9 % those of water. Other parameters are
 $R_{f}/R_{m}=5.9$
and
 $\mathit{Oh}_{o}=3.4\times 10^{-3}$
. (b) Numerical simulations of the same conditions as in part (a).

5.2. Formation of sub-satellites
In addition to the main satellite analysed above, sub-satellites (Burton, Waldrep & Taborek Reference Burton, Waldrep and Taborek2005; Blanchette & Bigioni Reference Blanchette and Bigioni2006) are frequently generated during retraction of over-stretched protrusions, as shown in figure 15 (supplementary movie 8) for two realizations where
 $R_{f}/R_{m}<6$
. We have captured sub-satellites as small as
 $4~{\rm\mu}\text{m}$
in the experiments (the smallest optical resolution) and
 $2~{\rm\mu}\text{m}$
in the simulation. We find that sub-satellites form when the length of the protrusion just after the pinch-off is more than
 $3.8\pm 0.3$
times its average diameter. This average diameter is determined by volume conservation, i.e. the diameter of a slender uniform cylinder that has the same volume and length as the protrusion just after the pinch-off. According to Rayleigh–Plateau instability, if the length/diameter ratio exceeds
 ${\rm\pi}$
, disturbance waves can grow and break the cylinder into pieces, consistent with our observations. Therefore, we conclude that the formation of sub-satellites is basically due to Rayleigh–Plateau instability (Ray et al.
Reference Ray, Biswas and Sharma2010), while the primary satellite is due to the coupling of the wave focusing and the overall deformation, detailed in earlier subsections.
Figure 16 shows the number of satellites as a function of this aspect ratio, with more sub-satellites appearing as the aspect ratio increases, in both the experiment and the numerical simulations. This is again consistent with Rayleigh–Plateau instability of a liquid column.
5.3. Pinch-off by multiple waves
In principle there is nothing prohibiting the possibility that the focusing of more than one wave can pinch off a satellite. We can infer from the above analysis that this may occur for more than one wave if the downward stretching at the neck is strong enough and also the amplitudes of the capillary waves are large enough. This requires that the drainage flow be fast enough and the viscous dissipation weak, which is most likely to occur at some small density ratio
 $D$
, large parent size ratio
 $R_{f}/R_{m}$
and small
 $\mathit{Oh}$
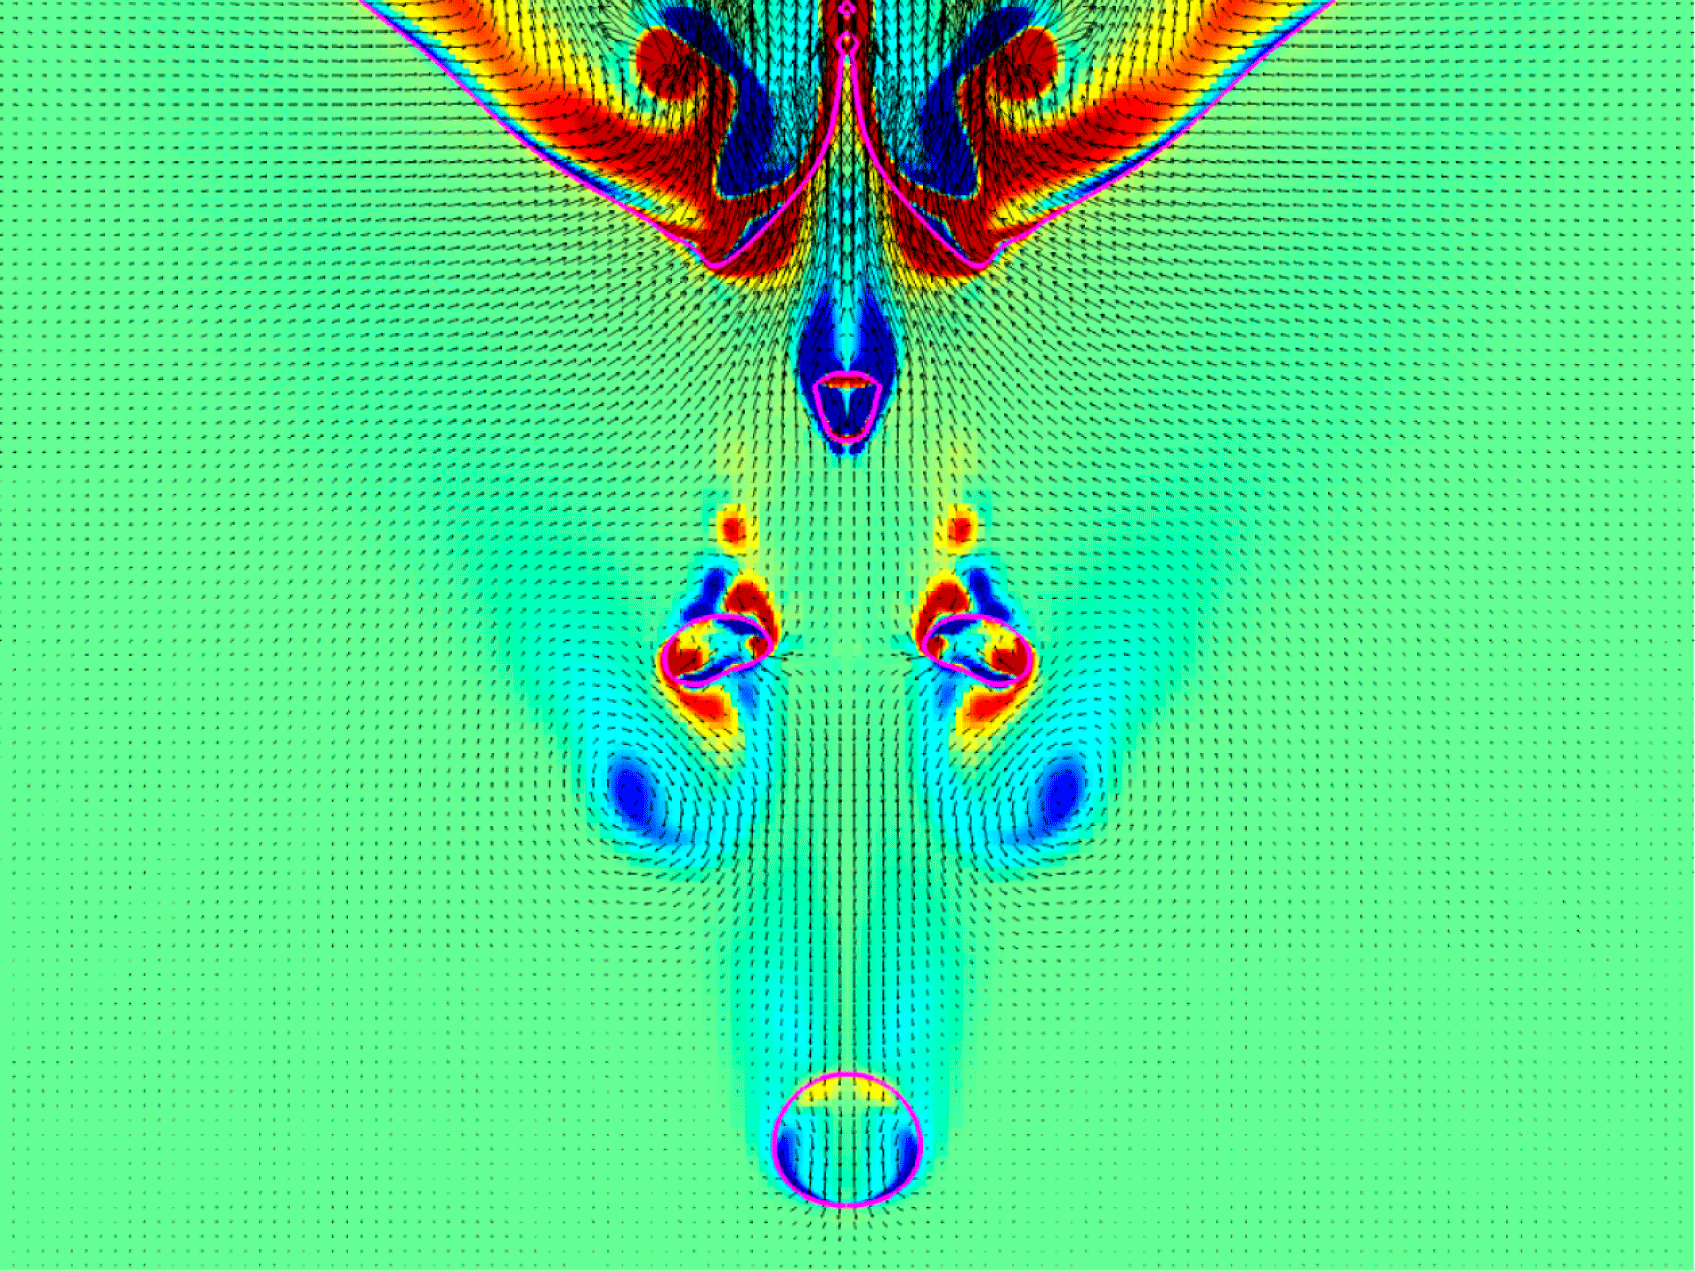
. This scenario is indeed observed under some conditions. Figure 17(a) (supplementary movie 9) shows such an example, where the three consecutive waves pinch off satellites. The second of these waves pinches off a toroidal satellite bubble. The numerical simulations reproduce exactly the same dynamics, except that the toroidal bubble contracts into one large bubble, as mandated by the axisymmetry. This may affect the pinch-off of the third wave, which shows one small bubble in the numerics, whereas the experiments show two small bubbles. The toroidal bubble does not break up immediately, which is perhaps due to the presence of a nearby vortex, which we highlight in figure 18, which shows the velocity and vorticity fields for this case. The simulations also reveal strong internal jetting, which is obscured in the experimental imaging, but would be accessible through the use of X-rays (Zhang et al.
Reference Zhang, Toole, Fezzaa and Deegan2012). We have observed many events of this kind when
 $D<0.088$
,
 $R_{f}/R_{m}>2.5$
and
 $\mathit{Oh}<0.004$
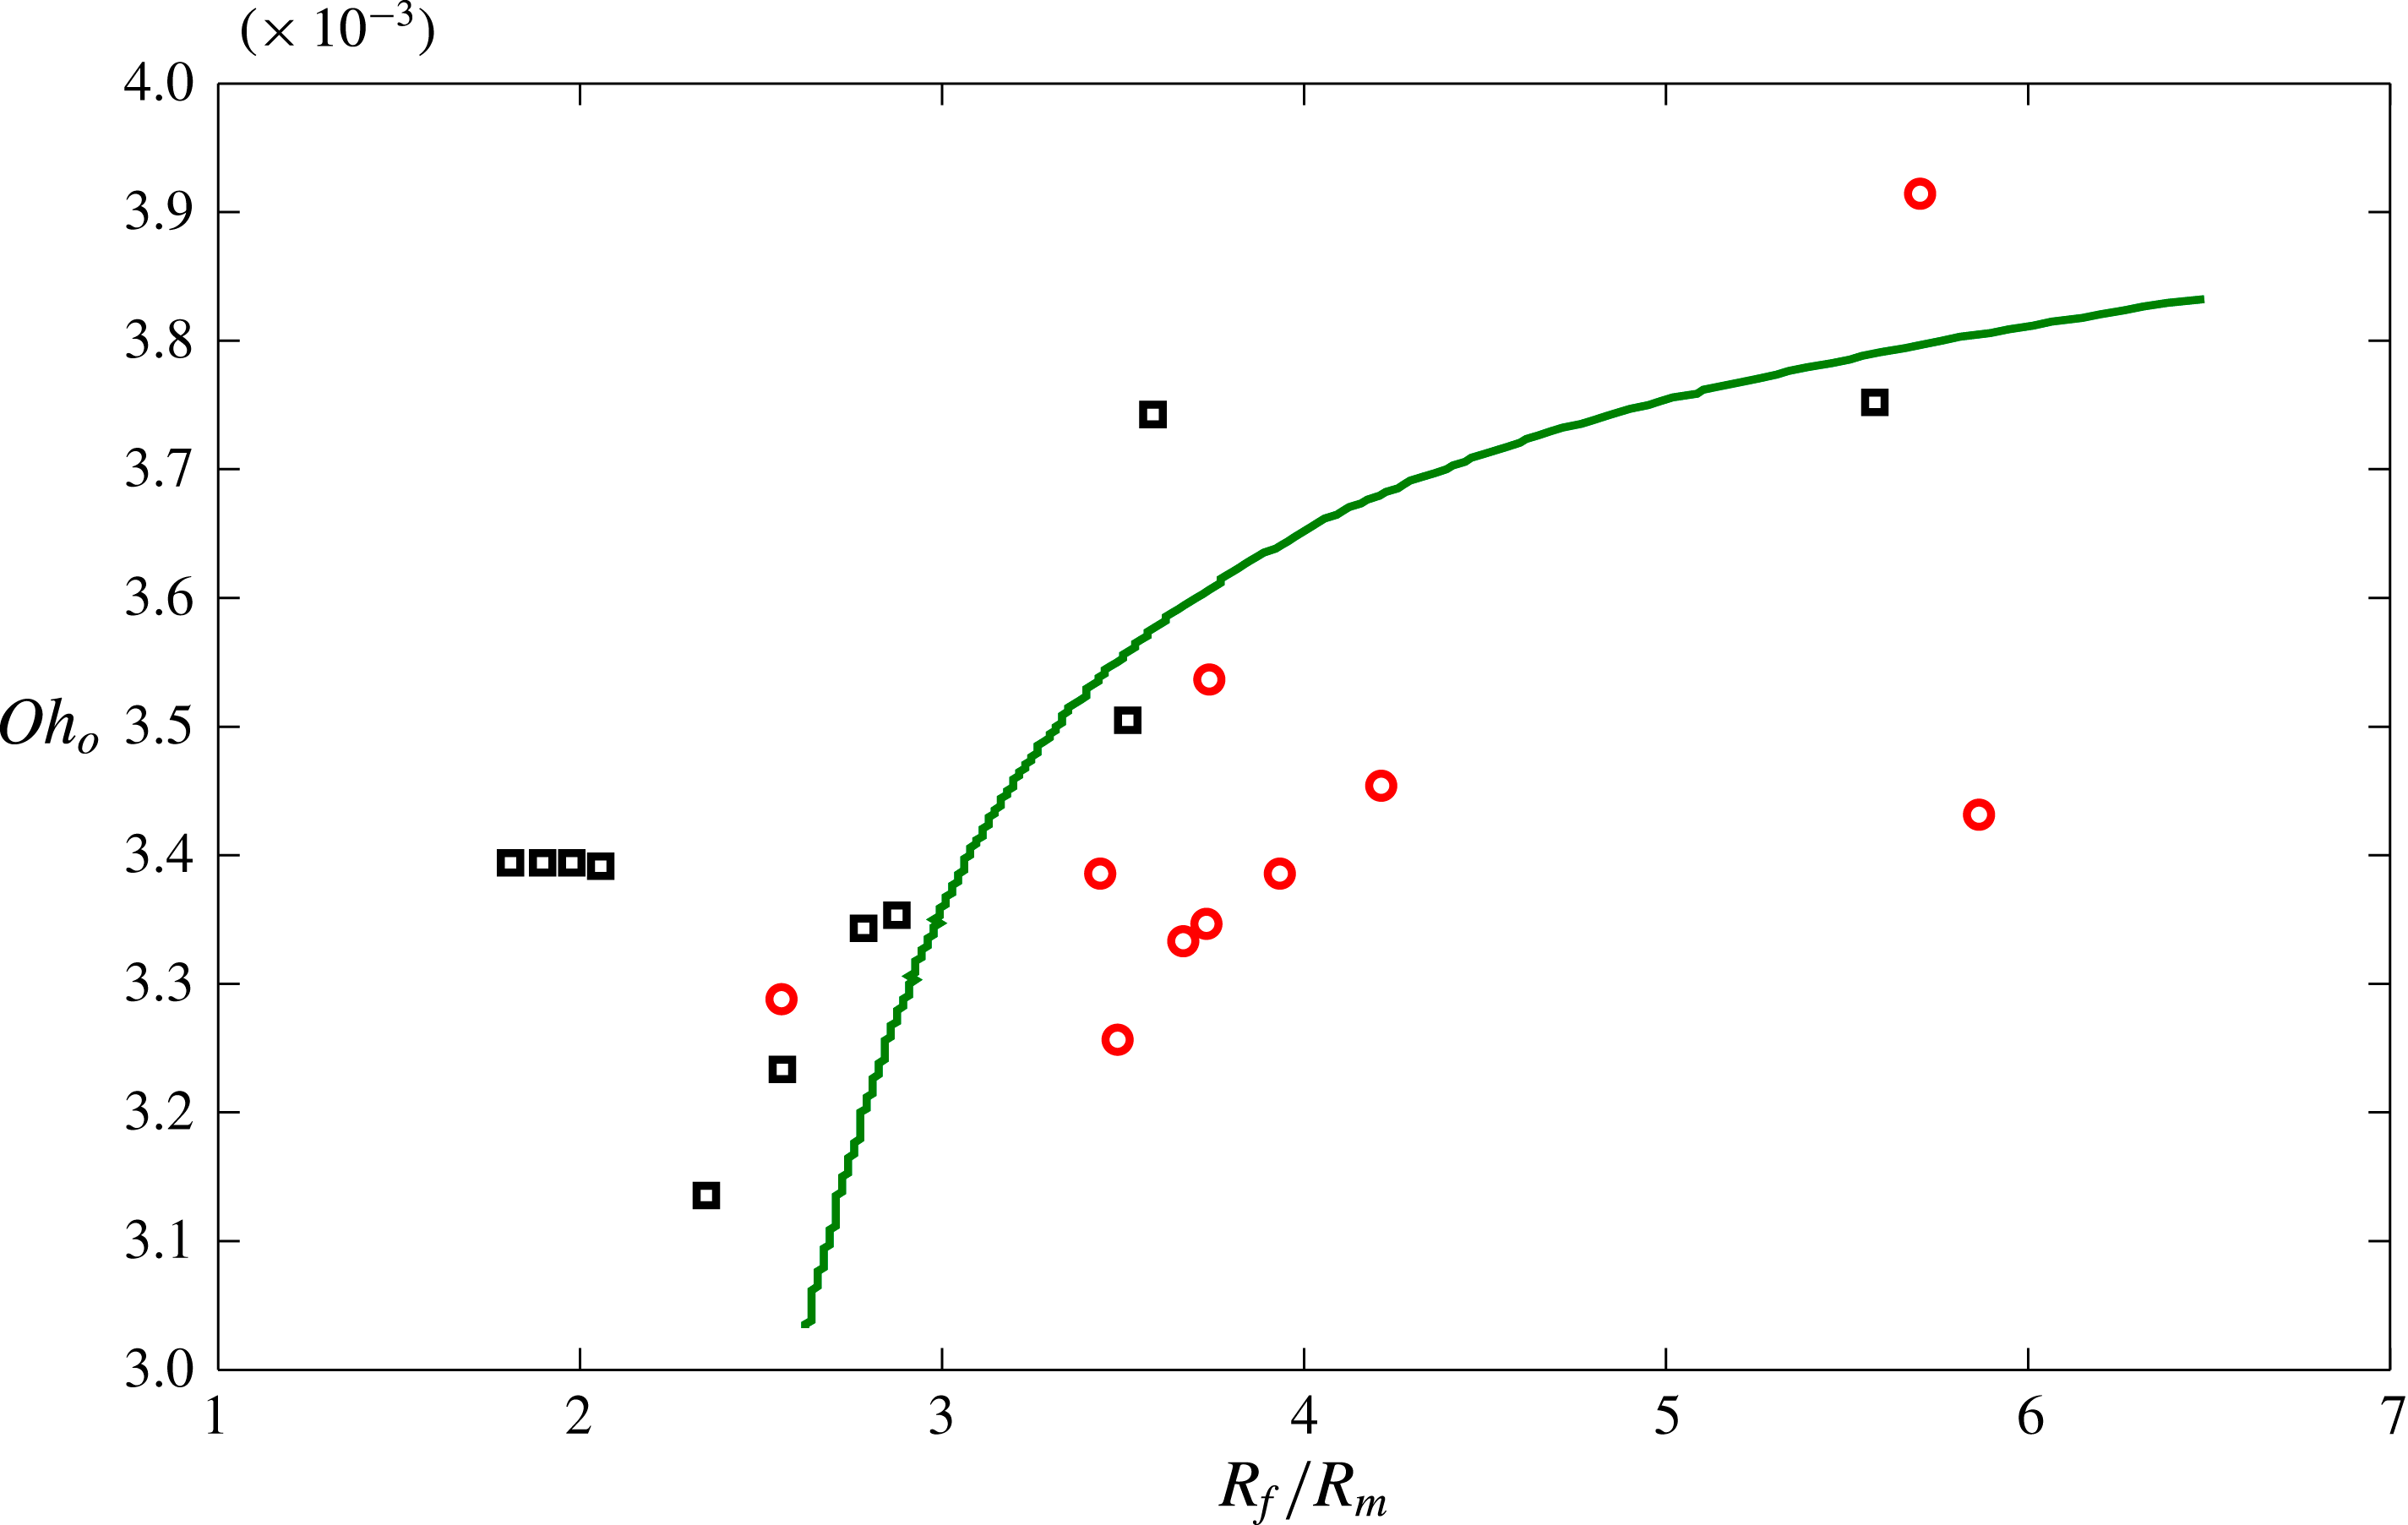
, as is shown in the approximate phase diagram of Figure 19.
Formation of multiple satellites. The vortical structure near the toroidal bubble. The pink line corresponds to the bubble interfaces.

The experimental phase diagram identifying the parameter regime where the pinch-off at multiple waves are observed (red circles), in
 $\mathit{Oh}_{o}$
versus parent size ratio
 $R_{f}/R_{m}$
. This phenomenon only occurs for small density ratios
 ${\it\rho}_{i}/{\it\rho}_{o}<0.088$
. The curve roughly represents the boundary of the two regimes of pinch-off. Multiple-wave pinch-off occurs below the line.

5.4. Simulations over wider range of density ratios and second stage pinch-off
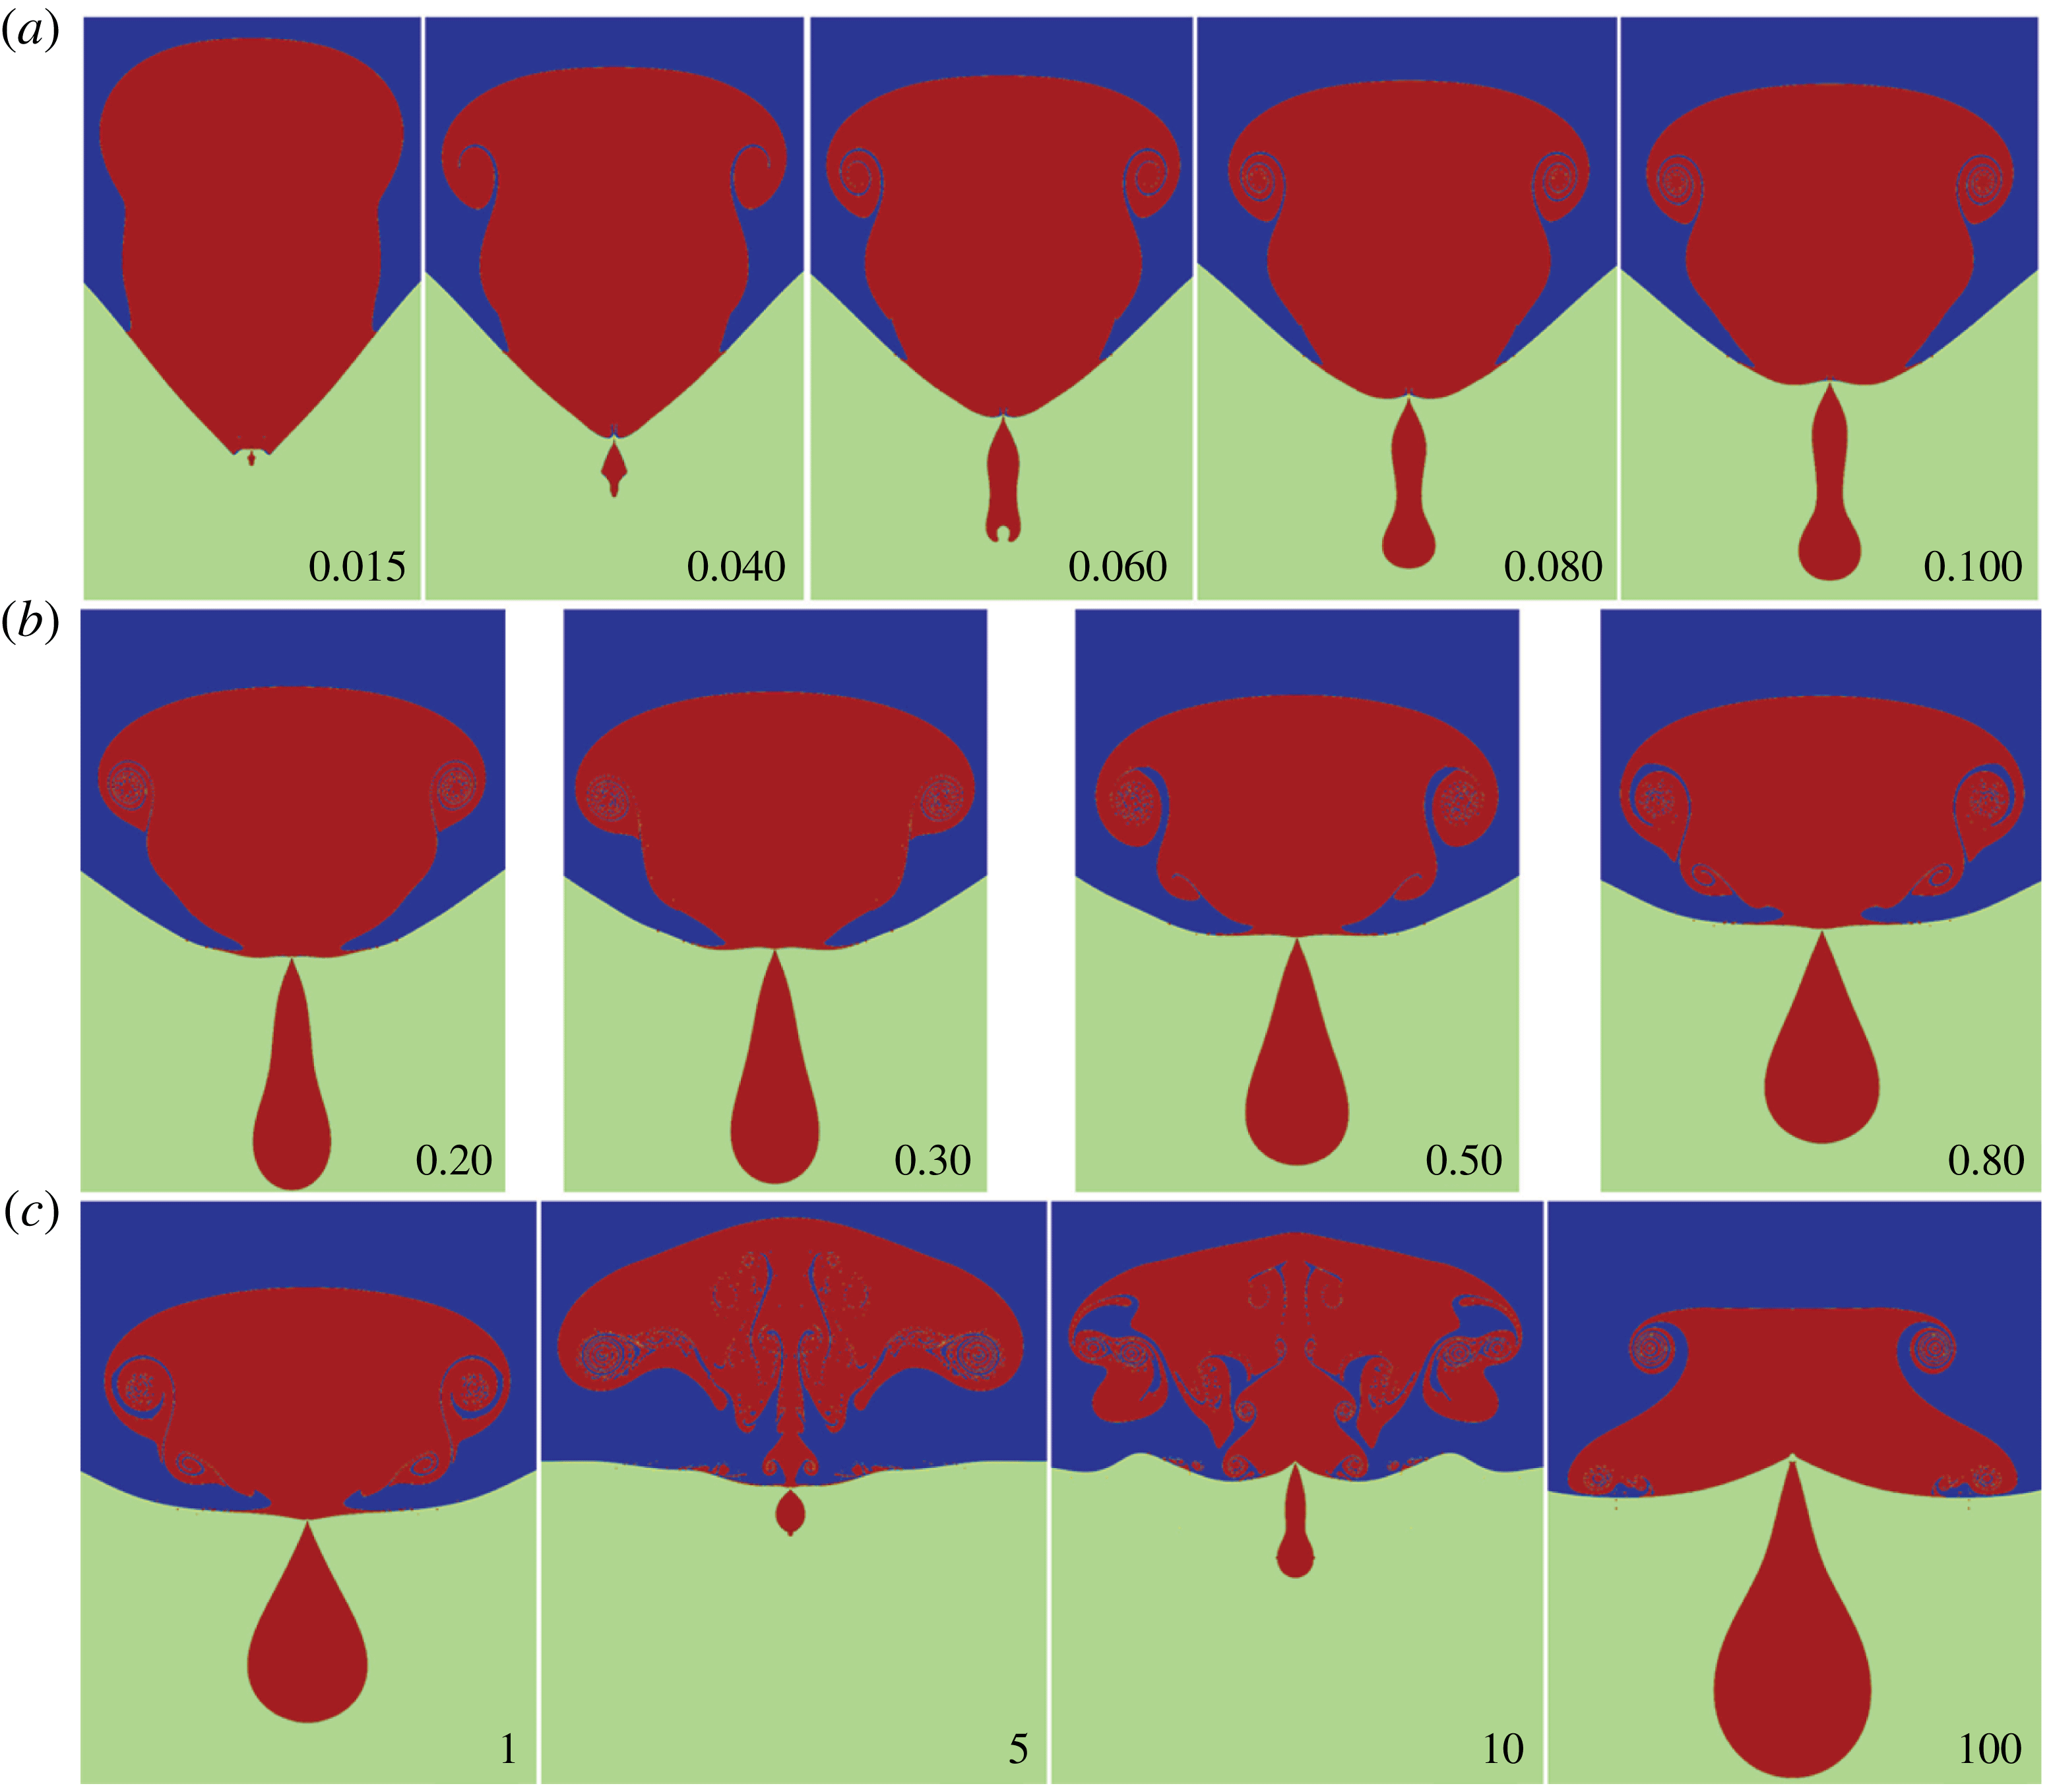
In the experiments, we are limited to pressures that make the inner density the same as the outer density. However, in the numerics we can extend this to the case of heavier inner fluid, approaching the drop-in-air configuration. Figure 20 shows the interface shapes over this greater range of density ratios than are accessible in the current experiments.
Interface shapes over a wide range of density ratios, from numerical simulations, shown at the instant of satellite pinch-off. The inset numbers identify the value of the density ratio,
 ${\it\rho}_{i}/{\it\rho}_{o}$
.

It is interesting that for
 ${\it\rho}_{i}/{\it\rho}_{o}=100$
the satellite size becomes
 $R_{s}/R_{m}\simeq 0.532$
, larger than observed for the water–air case, where
 ${\it\rho}_{i}/{\it\rho}_{o}\simeq 710$
.
For
 ${\it\rho}_{i}/{\it\rho}_{o}=5$
and 10, the interface shows enhanced stirring, which arises due to this being a second-stage pinch-off first observed in the drop case by Zhang et al. (Reference Zhang, Li and Thoroddsen2009). The second-stage motions induce separation of two or more vortex rings, which interact to produce the intricate interface shapes. The satellite is of course much smaller in this case. Anilkumar, Lee & Wang (Reference Anilkumar, Lee and Wang1991) observed a simpler vortex stirring inside coalescing emulsion droplets.
5.5. Energy considerations
The coalescence motions are driven by the release of surface energy of the mother drop
 $E_{s}={\it\sigma}4{\rm\pi}R_{m}^{2}$
, some of which ends up in the surface energy of the satellite. The dynamics are determined by the transfer of this energy into the kinetic energy of the motions, which eventually get dissipated by viscous stress. The partition of the kinetic energy into the minimal energy of the corresponding potential motions and the part transformed into vortical motions will influence the wave formation at the interface. Figure 21(a,b) shows close-up views of the coalescing neck for typical cases. The bubble case (a) shows a near-circular interface shape in the neck (Thoroddsen et al.
Reference Thoroddsen, Takehara and Etoh2005b
) and vorticity still attached to the interface, whereas for the drop case (b) there is a sharper corner in the neck and a thinner separated vortex sheet, which has rolled up into a vortex ring. This qualitative difference persists at a later stage, as shown in figure 21(c,d).
Comparison of simulation cases with and without the formation of a vortex ring. (a,b) Close-up of the neck region at non-dimensional time of 0.12. (c,d) Overall flow field later on, at non-dimensional time of 0.40. (a,c) For a bubble case with
 ${\it\rho}_{i}/{\it\rho}_{o}=0.001$
and (b,d) for a drop case with
 ${\it\rho}_{i}/{\it\rho}_{o}=1.00$
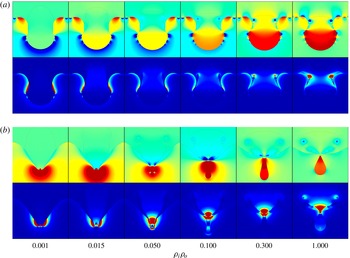
. Colour coding indicates the strength of the azimuthal component of vorticity.

Numerical simulations showing comparison of pressure (upper rows) and kinetic energy (lower rows) over a range of density ratios (columns from left to right) of
 ${\it\rho}_{i}/{\it\rho}_{o}=0.001$
, 0.015, 0.050, 0.100, 0.300 and 1.000. Shown at
 $t/{\it\tau}_{{\it\sigma}s}=0.27$
in (a) and slightly before pinch-off (or internal jetting for the lowest density) in (b).

Figure 22 compares the distribution of pressure and kinetic energy over a range of density ratios. There is clearly a qualitative difference, with the vortex ring taking a prominent role, for denser inner liquid. However, the transition for the appearance of the vortex ring is approximately
 ${\it\rho}_{i}/{\it\rho}_{o}=0.05$
and not at 0.15, as deduced from the satellite size in figure 4. The influences of the vortical component on the capillary waves and pinch-off dynamics are therefore more subtle. The kinetic energy at early times is concentrated in different regions of the flow (lower row of figure 22
a), whereas at times closer to the pinch-off (figure 22
b), the kinetic energy concentrates near the apex for all density ratios. This supports our view that pinch-off can only be understood by considering both the capillary waves and the overall drainage from the mother drop or bubble.
6. Conclusions and discussion
6.1. Summary
Herein, we have used experiments and numerical simulations to probe the differences in the dynamics of partial coalescence between bubbles and drops. We have specifically focused on understanding why the satellite size changes from 10 % for bubbles to 50 % for drops. Here we have bridged the gap in density ratio between these two cases, using xenon bubbles in water under high pressure. We have successfully modelled the change in satellite size in a unified way, allowing us to predict their relative size for any density ratio in the capillary–inertial regime; see (4.11). We identify a transition from bubble- to drop-like behaviour when the inner density reaches 15 % of the outer density (figure 4). The same model predicts the variation in the pinch-off time of the satellite, measured from initial contact. We show that both the focusing of capillary waves as well as the drainage from the mother droplet play a role in the partial coalescence. The speed of drainage is determined by the inner density. We use the numerical simulations for detailed tracking of the primary capillary wave, which is responsible for the satellite pinch-off. The wavelength of this primary wave changes as it travels across the equator (figure 7). For the bubble case, the mother bubble has deformed greatly into a cone-shaped form, thereby influencing the evolution of the wave converging at the apex.
Our results are important for modelling the coarsening of emulsions, used in many industrial processes, from salad dressings to water–oil–gas separation in petrochemicals. Satellite formation can slow down or stop this separation process, by introducing smaller droplets, which must coalesce in additional steps. Smaller droplets can be more stable through changes in surfactant coverage or require more time for film drainage between the droplets, which are now further away from the capillary length. Smaller droplets also take longer to approach or separate when driven by buoyancy. Predicting the resulting daughter size distributions is therefore a significant challenge. Owing to the ‘current limited understanding of these underlying processes we still have to resort to empirical correlations’ (Liao & Lucas Reference Liao and Lucas2010). Our results can be helpful in this respect, for guiding model development. For example, our results predict fewer very small gas bubbles if the separation takes place within pressurized vessels, where the partial coalescence is more drop-like. Our formula could also be applied locally within reservoirs, where the pressure varies with depth and the daughter size distribution could become history-dependent.
6.2. Future directions and remaining questions
In this work we have kept viscosity low, to remain inside the capillary–inertial regime, where partial coalescence is most likely to occur. Viscosity dampens the capillary waves and stops the pinch-off, for Ohnesorge numbers above some critical value (Blanchette & Bigioni Reference Blanchette and Bigioni2006; Paulsen et al. Reference Paulsen, Carmigniani, Kannan, Burton and Nagel2014). This critical value for pinch-off has been studied for drops and bubbles, but not at the intermediate densities, the study of which remains for future work. It should be noted that very small satellites can be pinched off even when the waves are highly damped by viscosity, as shown by Zhang & Thoroddsen (Reference Zhang and Thoroddsen2008) in their figures 9 and 10.
Our experimental set-up required a large size ratio between the two bubbles and it has been kept around 30 during most of the experiments (except in figure 15). To quantify the effect of the size ratio, we performed separate simulations where this ratio is systematically reduced towards unity (figure 14). The results are qualitatively similar over the whole range of size ratios, but this was only tested for
 ${\it\rho}_{i}/{\it\rho}_{o}=0.060$
.
The large spread in the experimental data in figures 4 and 13 could be reduced by additional experiments where the bubble sizes are better controlled within an improved high-pressure chamber. Future experiments with different gases and over a range of liquid properties would be beneficial to pin down the critical Oh values for the different density ratios.
Surfactants reduce the strength of surface tension, but additionally introduce dynamic interface effects, which may alter the converging waves and interfere with the satellite formation (Dai & Leal Reference Dai and Leal2008). In addition, Marangoni effects may be introduced by changing the physical properties of the two merging masses, using different liquids, or via addition of solutes or temperature, applied to only one of the masses. Marangoni effects are known to increase the amplitudes of capillary waves produced in the coalescing neck (Thoroddsen et al. Reference Thoroddsen, Qian, Etoh and Takehara2007; Blanchette et al. Reference Blanchette, Messio and Bush2009). It remains to be seen whether this can promote additional pinch-off, outside of the regular regime.
Partial coalescence in a three-component emulsion introduces many new dimensions to the parameter space and may be of interest in some industrial processes, such as water–oil–gas separation at the well head. Such configurations have been explored by Li et al. (Reference Li, Al-Otaibi, Vakarelski and Thoroddsen2014).
Other factors that can influence the dynamics are the shape deformations of the drops at the onset of coalescence. This can arise in the quiescent state for large Bond numbers (Blanchette & Bigioni Reference Blanchette and Bigioni2006), or owing to the approach or separation velocity of the two masses at the start of coalescence (Baldessari & Leal Reference Baldessari and Leal2006; Zhang & Thoroddsen Reference Zhang and Thoroddsen2008). Multiphase emulsions in continuous petrochemical processing often flow in pipelines and are in a state of vigorous motion, which introduces relative shear during the approach of individual masses of the disperse phase. This will break the axisymmetry of the problem, reduce the amplification of the waves at the pole and perhaps reduce the propensity for pinch-off.
Acknowledgements
The research reported in this publication was supported by King Abdullah University of Science and Technology (KAUST). P.T. acknowledges support from NSF DMR-0907495.
Supplementary movies
Supplementary movies are available at http://dx.doi.org/10.1017/jfm.2015.533.