Implications
According to the census and the genetic variability results, Turkish Arab horse population is not at an imminent risk. The effective size computed using paired increases in coancestries and the effective population size based on individual increases in inbreeding for the reference population (RP) was virtually equal. Further, the analysed population has a steady increase of inbreeding coefficient and average relatedness (AR) (with AR being almost twice F). In this study, the particularity of the pedigree analysis in this breed showed that it was not subdivided as occurred in others.
Introduction
The Arab horse is one of the most influential horse breeds in the world and has played a major role in shaping other famous varieties including the Thoroughbred and Lipizzan (Zechner et al., 2002). In particular, the Turkish Arabian horses have a significant historical background in Turkey. The records kept in horse breeding was reconstructed in 1925. Later, some large breeding farms were founded with the adoption of the ‘Law on Animal Breeding’ in 1926 (WAHO, Reference Wright2014).
Analysing of the pedigree information is an important tool for the identification of genetic diversity and changes that occur from generation to generation (Bokor et al., Reference Bokor, Jonas, Ducro, Nagy, Bokor and Szabari2013). Genetic variability in a population can be defined in terms of the variability of current alleles and genotypes (Boichard et al., Reference Boichard, Maignel and Verrier1997). Moreover, the results of pedigree analysis give expected values of the increase in homozygosity and decrease in heterozygosity for the whole genome (Falconer and Mackay, Reference Falconer and Mackay1996). These data may reveal appropriate strategies for managing mating programmes and illustrating genetic variability (Valera et al., Reference Valera, Molina, Gutiérrez, Gómez and Meuwissen2005). In addition, pedigree analyses may enable us to assess the structure of a population and levels of inbreeding (Gutiérrez et al., Reference Gutiérrez and Goyache2005), which are important for populations under high selection pressure and closed stud books for many years. Indeed, using pedigree analyses, it is possible to determine the extent of genetic loss in small, closed breeding populations because inbreeding coefficients, and other parameters defining populations can be predicted. Evaluation of the genetic variability of a population, its structure and gene flow, and the appropriate management of genetic stock in order to enlarge the genetic basis of selection are required throughout selection programmes. Pedigree information can be used to identify these issues (Głażewska and Jezierski, Reference Głażewska and Jezierski2004). Moreover, demographic analyses may also help us to understand the important factors affecting the genetic history of a population (Zechner et al., 2002; Valera et al., Reference Valera, Molina, Gutiérrez, Gómez and Meuwissen2005). In recent years, a number of studies have been carried out on the population structure and genetic variability of horse breeds (Zechner et al., 2002; Głażewska and Jezierski, Reference Głażewska and Jezierski2004; Gutiérrez et al., Reference Gutiérrez and Goyache2005 and Reference Gutiérrez, Marmi, Goyache and Jordana2008; Valera et al., Reference Valera, Molina, Gutiérrez, Gómez and Meuwissen2005; Hamann and Distl, Reference Hamann and Distl2008; Cervantes et al., Reference Cervantes, Molina, Goyarche, Gutiérrez and Valera2008b; Druml et al., Reference Druml, Baumung and Sölkner2009; Teegen et al., Reference Teegen, Edel and Thaller2009; Álvarez et al., Reference Álvarez, Royo, Pérez-Pardal, Fernández, Payeras and Goyache2010; Bartolomé et al., Reference Bartolomé, Cervantes, Valera and Gutiérrez2011; Pjontek et al., Reference Pjontek, Kadlečík, Kasarda and Horný2012; Vicente et al., Reference Vicente, Carolino and Gama2012; Siderits et al., Reference Siderits, Baumung and Fuerst-Waltl2013; Stephens and Splan, Reference Stephens and Splan2013; Maciel et al., Reference Maciel, Bertoli, Braccini, Cobuci, Paiva and McManus2014; Medeiros et al., Reference Medeiros, Bertoli, Garbade and McManus2014). The purpose of this study was to evaluate the pedigree information of the Turkish Arab horses to measure existing population genetic variability in terms of inbreeding levels and the relative contributions of founder to the current population.
Material and methods
Study data
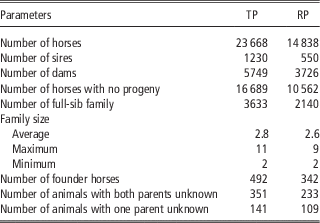
In this study, pedigree information from a total of 23 668 Turkish Arab horses was analysed from 1904 to 2014. Animal material studied is given in Table 1. In Turkey, Arab horse breeding and development activities are carried out either by the Ministry of Agriculture or the Jockey Club of Turkey, whereas the Studbook are recorded by the ministry. All pedigree data were compiled in the Turkish Arab Horse Herdbook (Volumes 1 to 5), and animals with one or two unknown parents were accepted as the founders, or base population. The analyses carried out for the population are listed below; all parameters were computed for the RP, because this population represents the last generation, composed of 14 838 animals born between 2003 and 2014, and also it includes animals that can potentially contribute to the next generation. All analyses were carried out using the software Endog 4.8 (Gutiérrez and Goyache, Reference Gutiérrez, Cervantes, Molina, Valera and Goyache2005).
Pedigree structure used for analysis of the Turkish Arab horse population

TP=total population; RP=reference population.
Demographic parameters
To characterise the depth of the pedigree, the following values were calculated: (a) the average complete generation, computed as the maximum of average traced generations for each animal; (b) the maximum of fully traced generations, computed as the value separating the offspring from the farthest generation where the two ancestors of the individual are known; (c) the number of equivalent complete generations computed as the sum of (1/2) n where n is the number of generations separating the individual from each of the known ancestors (Boichard et al., Reference Boichard, Maignel and Verrier1997). The pedigree completeness level (PCL), was defined by computing for the whole pedigree as the proportion of ancestors known per generation for each offspring. The generation interval (GI) was defined as the average age of parents at the birth of progeny subsequently used for reproduction, as well as the average age of the parents of all foals (James, Reference James1977).
Genetic variability parameters
To estimate genetic variability the following values were calculated:
-
a. The individual inbreeding coefficient (F) and the AR coefficients, which correspond, respectively, to the probability that both alleles, randomly selected, are identical by descent (Malécot, Reference Malécot1948), and the mean relationship of each individual with the rest of the animals of the breed (Goyache et al., Reference Goyache, Gutiérrez and Cervantes2003).
-
b. Parameters characterising the probability of gene origin, such as the effective number of founders (f e), defined as the number of equally contributing founders (animals without known ancestors) expected to produce the same genetic diversity as in the studied population (Lacy, Reference Lacy1989); and the effective number of ancestors (f a) defined as the minimum number of ancestors (not necessarily founders) explaining the complete genetic diversity of the population and accounting for the loss of genetic variability caused by the unbalanced use of ancestors on reproduction, leading to genetic bottlenecks (Boichard et al., Reference Boichard, Maignel and Verrier1997; Gutiérrez and Goyache, Reference Gutiérrez, Cervantes, Molina, Valera and Goyache2005).
-
c. The ratio between f e and f a (i.e. f e/f a) can be used to illustrate the effect of a pedigree bottleneck (Boichard et al., Reference Boichard, Maignel and Verrier1997). Genetic variability lost due to a bottleneck can be predicted by using the 1/(2f a) equivalence (Lacy, Reference Lacy1989; Schurink et al., Reference Schurink, Arts and Ducro2012).
-
d. The number of founder genome equivalents (f g). Defined as the number of founders that would be expected to produce the same genetic diversity as in the population under study if the founders were equally represented and no loss of alleles occurred (Lacy, Reference Lacy1989; Caballero and Toro, Reference Caballero and Toro2000). And moreover, it is used to assess not only the unequal contributions of parents to their progeny and bottleneck in a pedigree, but also the random losses in genes that have passed from one generation to the next. Unlike f a, f g can explain all genes lost through segregation (Boichard et al., Reference Boichard, Maignel and Verrier1997).
-
e. The ratio between the effective number of founders (f e) divided by the effective number of founder genomes (f g) (f e /f g) was also calculated in order to determine the effect of genetic drift in the Turkish Arab horse population (Lacy, Reference Lacy1989; Schurink et al., Reference Schurink, Arts and Ducro2012).
-
f. The effective population size N e is defined as the size of an idealised population with the same amount of inbreeding or random gene frequency drift as the population under study (Wright, Reference Zechner, Sölkner, Bodo, Druml, Baumung, Achmann, Marti, Habe and Brem1931). In the present study, N e was estimated via an individual increase in inbreeding per generation
 $$\left( {\bar{N}_{{\rm e}} } \right)$$
, as proposed by Gutiérrez et al. (Reference Gutiérrez, Marmi, Goyache and Jordana2008); and also by an average increase in coancestry for all pairs of individuals
$\left( {\bar{N}_{{{\rm eC}}} } \right)$
(Cervantes et al., Reference Cervantes, Goyache, Molina, Valera and Gutiérrez2011). Both computations were made using animals born each year of RP. Other estimates of N
e were calculated by computing the regression coefficient of the individual inbreeding coefficient over dates of birth (Gutiérrez et al., Reference Gutiérrez, Altarriba, Díaz, Quintanilla, Cañón and Piedrafita2003), and (i) the number of full generations traced; (ii) the maximum number of generations traced and (iii) the equivalent complete generations (Boichard et al., Reference Boichard, Maignel and Verrier1997).


Results
Demographic analysis
Our results revealed that fewer than 100 Turkish Arab horses were recorded in the Herdbook between 1904 and 1980. However, logged horse numbers have shown an increase since the 1990s, exceeding 1000 after 2004. Between 2010 and 2014, an average of 1450.2 horses was recorded annually in the Herdbook, with 71.2% of all horses recorded after 2000. In the Herdbook the number of full-sib groups are 3633 and an average family size of 2.8. After 2010, 7251 foals were born from 378 sires and 2872 dams; in this period, the average number of foals per sires and dams, and SD were 19.2 (±29.7) and 2.5 (±1.2), respectively. Interestingly, 20.8% of these foals (1509) were the progeny of just 10 sires (i.e. 2.6% of the total sires in the Herdbook), whereas 50% were the foals of just 40 stallions (i.e. 10.6% of the total sires in the Herdbook).
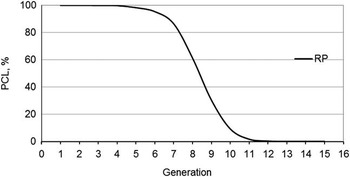
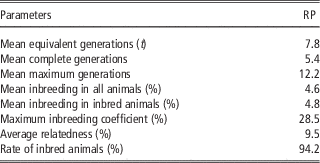
Values for the PCL are shown in Figure 1, one quality indicator for the pedigree. Results show that the PCL for the RP was 100% in both first and second generations, but decreased notably after the seventh. In the eighth generation, average PCL for the RP was 92.6%, whereas the mean equivalent generation (t), which indicates depth of pedigree, was 7.8 (Table 2). Calculations showed that the average complete generations of the mean full traced generations for the RP was 5.4, whereas the mean maximum generations of the number of known generations for the same population was 12.2. Results also demonstrate that the pedigree of 45 horses can be traced back 15 generations.
Pedigree completeness levels (PCL) for the reference populations (RP) per generation in the Turkish Arab horse population.

Results of pedigree analysis for the reference population of the Turkish Arab horse breed

RP=reference population.
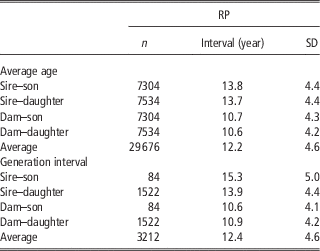
When the GI was calculated for all progeny along four different paths (i.e. sire–son, sire–daughter, dam–son and dam–daughter) (Table 3), average GI for the RP was 12.2 years. Calculations that GI for the RP were 10.7 and 10.6 years on the dam–son and dam–daughter lines, whereas they were 13.8 and 13.7 years on sire–son and sire–daughter lines. Based on these results, the GI on the sire line was higher; when just progeny used in breeding were taken into account, the GI on the sire line on the basis of average GI was also higher (Table 3).
Average ages and the generation intervals for the reference population in the Turkish Arab horse breed

RP=reference population; n=number of animals.
Inbreeding coefficient, average relatedness level
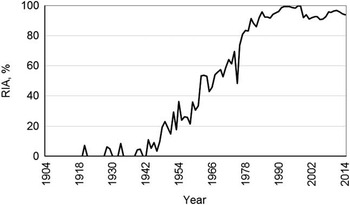
The annual rate of inbred animals (RIA) is shown in Figure 2. Results show that the RIA increased annually. This rate has exceeded 80% since 1977 and increased to 100% in 1997, and to 99.5% in 1998. Calculations show that population RIAs in 2005 and 2006 were 91.0%, whereas in 2013 and 2014 they were 94.4% and 93.7%, respectively. However, although 60.18% of all horses had an inbreeding coefficient of 5% or less, the percentage of inbred horses with this value at >10% was only 1.39%. The proportion of animals for inbreeding coefficient intervals were found 0 to 0.0325 (29.98%), 0.0325 to 0.0625 (56.98%), 0.0625 to 0.125 (12.73%) and upper 0.125 (0.31%), respectively. Results also show that the average F for the RP in all horses was 4.6% (Table 2), whereas the same value for inbred horses was 4.8%. The highest calculated individual F value for the RP was 28.5%.
Rate of annual inbred animals (RIA) in the Turkish Arab horse population.

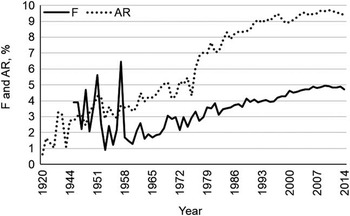
Annual changes in F and AR are shown in Figure 3, starting from 1920 as no inbred horses existed before this date. The mean inbreeding coefficient was found to be 25% in 1920, 1933 and 1940, but they are not shown in this figure as only one inbred animal existed in those years. Moreover, the number of mating between full sibs, half sibs and parent offspring in the population was found to be 1, 33 and 14, respectively. Apparently, the average F followed a remittent course between 1945 and 1960, but started to increase in particular after 1960. The average calculated F in 1961 was 2.1%, that in 1970 was 2.9%, that in 1980 was 3.5%, that in 1990 was 3.9%, that in 2003 was 4.7% and that in 2010 was 4.9%. Although the average F was 4.9% in 2013, this value reduced to 4.7% in 2014. The decreasing trend of F may be meaningful for the future, although very small in the last year.
Annual variation in the average inbreeding coefficient (F) and the average relatedness (AR) for the Turkish Arab horse population.

We found the calculated mean AR for the RP was 9.5% (Table 2); AR constantly increased over the years, as was the case with the inbreeding coefficient. ARs for 1970, 1980, 1990, 2000 and 2010 were 4.1%, 7.7%, 8.5%, 9.0% and 9.7%, respectively, whereas these values for 2013 and 2014 were 9.5% and 9.4%.
Genetic variability
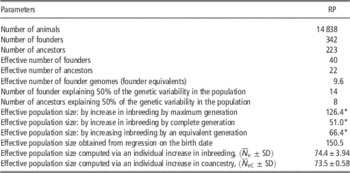
There are 136 stallions and 206 mares, totalling 342 founders in the RP. But, the effective number of founders for RP would have been just 40 according to our calculations (Table 4). Indeed, the genetic contributions of founders in the RP varied between 2.63%×10−7 and 7.4%, which shows that they did not make equal contributions to the gene pool. Data show that the founders of the RP were born between 1904 and 1990, which may explain the large differences in their relative contributions, although the first founder horse is in only 44th place with a 0.52% genetic contribution. The first 14 founders include eight stallions and six mares, with a horse called KÜHEYLAN CİETNİ* in the first place, making the greatest contribution (7.4%) to the RP gene pool. This horse breed had nearly one and a half times larger contribution than the horse breed in the second place, DEHMAN UMM AMR, being responsible for 4.8%. Overall, just 14 founder horses made a 50% genetic contribution to the RP.
Genetic variability parameters in the Turkish Arab horse breed

RP=reference population; *=total population.
There was a total of 223 ancestors (76 stallions and 147 mares) in the RP. The effective number of ancestors for the RP was 22 (Table 4), the value that shows the same genetic variability could have been obtained when there were at least 22 ancestors in the RP. Furthermore, this also means that there was large-scale inbreeding in the population; the genetic contributions of ancestors in the RP are between 2.0%×10−7 and 9.2%, besides 53.9% of the genetic variability in the RP can be explained by just eight ancestors.
The f e /f a ratio found in this study was 1.81 (40/22), which can be explained by the fact that some stallions became more popular after the 1990s and produced more progeny than others. Genetic variability, it was predicted by using 1/(2f a), lost due to a bottleneck found in the present study was 2.27%. In this study, as expected, calculated f g was lower than f e and f a; the value was 9.6 for the RP. A horse with one progeny leaves just half of its genes to posterity and loses at least half of its genetic variability in the process of genetic drift. In order to determine the amount of genetic variability lost to genetic drift, the f e /f g ratio was used. The percentage for RP in the present study was 4.16%.
In this study, N
e was predicted in a variety of different ways (Table 4). One way was by calculating the inbreeding coefficient by regression against the maximum, completed and average generation numbers for the total population. These values were found as 126.4, 51.0 and 66.4, respectively. Another way to calculate the N
e was to obtain from regression on the birth date was 150.5 for RP. Other methods included the effective population size realised by individual increase in inbreeding
 ${\rm (}\bar{N}_{{\rm e}} {\rm )}$
and the effective population size realised by the increase of coancestry
 $(\bar{N}_{{{\rm eC}}} )$
. Using these two approaches, respective values of 74.4±3.94 and 73.5±0.58 were obtained for the RP.
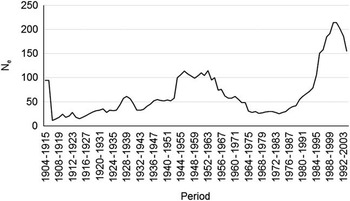
In order to ascertain historical bottlenecks in the population N e, tables can give estimates of N e by the period of birth of the reproductive individual, respectively. The period of birth was fitted by default by rounding the average GI, thus approaching successive generations in the pedigree. Periodical variation in the effective population size (N e) based on family size variance is shown in Figure 4. Until 1985, almost for all year periods N e was below 100 except for the period from 1940 to 1955 (N e>100); however, after 1985 it had increased rapidly up to 200, but then began to decline.
Periodical variation in the effective population size (N e) based on family size variance for the Turkish Arab horse population.

Discussion
Demographic analysis
The degree of pedigree information quality has an impact on the average inbreeding coefficient, and length of pedigree also has an important impact on the effective number of ancestors. Not only these two parameters, but also all the parameters that describe the probability gene origin are affected by the pedigree depth. Estimation of genetic variability largely depends on available and accessible pedigree information, measured by PCL. This study shows that PCL was over 70% until the seventh generation, contrasting with reports that this level in Spanish Arab horses was 74% and more until the fourth generation before subsequently decreasing (Cervantes et al., Reference Cervantes, Molina, Goyarche, Gutiérrez and Valera2008b). The PCL remained at 90% until the fourth generation in Andalusian horses (Valera et al., Reference Valera, Molina, Gutiérrez, Gómez and Meuwissen2005), until the tenth generation in Lipizzan horses (Zechner et al., 2002) and until the first generation in American Shire horses (Stephens and Splan, Reference Stephens and Splan2013). Looking at the mean of equivalent generations (7.8) for the RP in Turkish Arab horse, it can be said that this pedigree is of quality and depth. Some researchers reported that the mean of equivalent generations was 1.7 in Brazilian Sport horses (Medeiros et al., Reference Medeiros, Bertoli, Garbade and McManus2014), 5.7 in Spanish Arab horses (Cervantes et al., Reference Cervantes, Molina, Goyarche, Gutiérrez and Valera2008b), 5.9 in Slovak Sport Pony horses (Pjontek et al., Reference Pjontek, Kadlečík, Kasarda and Horný2012), 10.2 in Lipizzan horses (Pjontek et al., Reference Pjontek, Kadlečík, Kasarda and Horný2012), 8.2 in Shire horses (Stephens and Splan, Reference Stephens and Splan2013), 9.8 in Lusitano horses (Vicente et al., Reference Vicente, Carolino and Gama2012), 9.8 in Hanoverian horses (Hamann and Distl, Reference Hamann and Distl2008) and 15.2 in Lipizzan horses (Zechner et al., 2002). When the GI calculated for Turkish Arab horses was compared with other breeds, it proved to be longer largely because these horses are used for mating for a long period after their racing careers. This is particularly evident in the sire–son line. As reported in other relevant literature, because other breeds are mated earlier for production purposes their GI is lower, for example, 7.9 years in Austrian Noriker draught horses (Druml et al., Reference Druml, Baumung and Sölkner2009), 8.2 in Pantaneiro horses (McManus et al., Reference McManus, Santos, Dallago, Paiva, Martins, Braccini, Marques and Abreu2013), 8.6 in Dutch harness horses (Schurink et al., Reference Schurink, Arts and Ducro2012), 10.1 in Andalusian horses (Valera et al., Reference Valera, Molina, Gutiérrez, Gómez and Meuwissen2005), 10 in Hanoverian Warmblood horses (Hamann and Distl, Reference Hamann and Distl2008), 10.3 in Lusitano horses (Vicente et al., Reference Vicente, Carolino and Gama2012), 10.8 in Spanish Sport horses (Bartolomé et al., Reference Bartolomé, Cervantes, Valera and Gutiérrez2011), 11.4 in Hungarian Thoroughbred horses (Bokor et al., Reference Bokor, Jonas, Ducro, Nagy, Bokor and Szabari2013) and 11.5 in Brazilian Sport horses (Medeiros et al., Reference Medeiros, Bertoli, Garbade and McManus2014).
Inbreeding coefficient and average level of relatedness
According to our findings, about 89% of the Turkish Arab horse population and 94.2% of the RP were inbred. Bokor et al. (Reference Bokor, Jonas, Ducro, Nagy, Bokor and Szabari2013) reported that nearly 95% of the pedigree Hungarian horses in their study were inbred, and out of those horses 56% had an inbreeding coefficient >10%. The average F (4.6%) for the RP in present study is higher than values reported in the literature, for example, 0.5% in German Paint horses (Siderits et al., Reference Siderits, Baumung and Fuerst-Waltl2013), 0.6% in Spanish Sport horses (Bartolomé et al., Reference Bartolomé, Cervantes, Valera and Gutiérrez2011), 1.3% in Hanoverian horses (Hamann and Distl, Reference Hamann and Distl2008), 2.6% in Slovak Sport Pony horses, 3.9% in Shagya Arabian horses (Pjontek et al., Reference Pjontek, Kadlečík, Kasarda and Horný2012) and 2.4% in American Shire horses (Stephens and Splan, Reference Stephens and Splan2013). Some values from previous studies are similar, for example, 4% in Lipizzan horses (Pjontek et al., Reference Pjontek, Kadlečík, Kasarda and Horný2012), 4.1% in Brazilian Sport horses (Medeiros et al., Reference Medeiros, Bertoli, Garbade and McManus2014), 5% in Austrian Noriker horses (Druml et al., Reference Druml, Baumung and Sölkner2009) and 5.3% in the Dutch Racing horse (Schurink et al., Reference Schurink, Arts and Ducro2012), whereas it was lower than some others, for example, 6.2% in Hucul horses (Pjontek et al., Reference Pjontek, Kadlečík, Kasarda and Horný2012), 7% in Spanish Arab horses (Cervantes et al., Reference Cervantes, Molina, Goyarche, Gutiérrez and Valera2008b), 8.5% in Andalusian horses (Valera et al., Reference Valera, Molina, Gutiérrez, Gómez and Meuwissen2005), 9.6% in Hungarian Thoroughbred horses (Bokor et al., Reference Bokor, Jonas, Ducro, Nagy, Bokor and Szabari2013) and 9.6% in Lusitano horses (Vicente et al., Reference Vicente, Carolino and Gama2012). A similar explanation is possible for the AR as well. In addition, computation of inbreeding in the RP using recent generations can be useful to check if breeders are trying to avoid inbreeding or not. The average F could be protected at the same level, although fluctuated between 2003 and 2014. This shows that breeders also avoid the inbreeding since 2003.
Genetic variability
Factors that reduce genetic variability include the unequal contributions of founders, bottleneck in the pedigree and genetic drift. Reduction in genetic variability can be assessed by considering the effective numbers of founders and ancestors. The results of present study show that the effective numbers of founders and ancestors were lower than the real numbers, demonstrating a decrease in genetic variability. If the contributions of founders were equal, that is, they mated equally, then the numbers of real founders and effective founders would be equal. However, the results of this study yielded a large difference that demonstrates a decrease in genetic variability. Today, the number of founders responsible for 50% of the Turkish Arab population gene pool is 14, similar to the results of previous studies. For example, the genetic contribution of the first 10 founders in the Hungarian Thoroughbred horse population that had 1062 founders was 34.86% (Bokor et al., Reference Bokor, Jonas, Ducro, Nagy, Bokor and Szabari2013), and the genetic contribution of the first 14 horses in the Dutch Harness population that had 3568 founders was 75% (Schurink et al., Reference Schurink, Arts and Ducro2012). The fact that the number of ancestors (223) in the RP was lower than the effective number of ancestors (22) demonstrates that there was a bottleneck in the RP pedigree. The fact that f a was lower than the real number of ancestors indicates that this loss of genetic variability was passed from the parents to their progeny as a result of a bottleneck.
The rate of effective number of founders compared with the effective number of ancestors can be used to determine whether or not the Turkish Arab horse population has been affected by the bottleneck. If this ratio is 1, then the population is stable in terms of the contribution of the effective number of ancestors and the bottleneck has not played an important role. However, because this ratio (f e /f a=1.81) exceeds 1, the effect of the bottleneck is higher as a result of a decrease in the number of horses used for mating throughout the generations. In other words, the bottleneck has played an important role in shaping the Turkish Arab horse population, and the increasing difference between f e and f a means that the contribution of the founders throughout the generations is less. This particular situation may have occurred due to the fact that the selection intensity based on total earnings and conformation in the population is very high and that some breeders used only the best stallions for mating. Ideally, the least difference between f e and f a would mean that the f e /f a ratio is 1, or close to 1, and the contribution of founders is expected to be more balanced. In this case, it can be concluded that a special breed has not been created. Other studies have reported f e /f a ratios of 1.08 (Álvarez et al., Reference Álvarez, Royo, Pérez-Pardal, Fernández, Payeras and Goyache2010), 1.21 (Maciel et al., Reference Maciel, Bertoli, Braccini, Cobuci, Paiva and McManus2014), 1.70 (Medeiros et al., Reference Medeiros, Bertoli, Garbade and McManus2014), 2.34 (Vicente et al., Reference Vicente, Carolino and Gama2012), 3.7 (Stephens and Splan, Reference Stephens and Splan2013) and up to 8 in Shagya horses (Pjontek et al., Reference Pjontek, Kadlečík, Kasarda and Horný2012).
The effective number of founder genomes is nearly one-fourth of the effective number of founders, and the ratio (4.16%) reflects the loss of alleles over time due to genetic drift. Based on the genetic diversity parameters discussed so far, we can conclude that genetic diversity in the Turkish Arab horse population decreased due to a bottleneck and genetic drift (2.27%). f e /f g calculated in the present study is lower than that reported in previous studies, for example, 11 (Druml et al., Reference Druml, Baumung and Sölkner2009; Stephens and Splan, Reference Stephens and Splan2013), similar to the result of other studies, for example, 4, 4, 5 and 3 (Bartolomé et al., Reference Bartolomé, Cervantes, Valera and Gutiérrez2011; Vicente et al., Reference Vicente, Carolino and Gama2012; Siderits et al., Reference Siderits, Baumung and Fuerst-Waltl2013; Medeiros et al., Reference Medeiros, Bertoli, Garbade and McManus2014), and higher than some others, for example, 1 (Álvarez et al., Reference Álvarez, Royo, Pérez-Pardal, Fernández, Payeras and Goyache2010; Maciel et al., Reference Maciel, Bertoli, Braccini, Cobuci, Paiva and McManus2014).
The effective population size (N
e) is a key parameter for planning strategies to define and protect endangered animals. In other words, a population with low N
e has a higher probability of extinction. In population genetics, different tools are used to assess genetic diversity for conservation purposes and one of the most commonly used indicators is N
e. Different information sources (demographic information, pedigree or molecular data) can be used to estimate N
e. Using regression of inbreeding values based on a birth date or generation number to compute N
e can be useful when the aim is to know the influence of temporal mating policies in some reference subpopulations, because this method provides estimates that are highly depended on those policies (Cervantes et al., Reference Cervantes, Goyache, Molina, Valera and Gutiérrez2008a). According to the result of present study when we compare methods using regression on birth date with the equal
 $\bar{N}_{{{\rm eC}}} $
and
 $\bar{N}_{{\rm e}} $
methods, it can be said that
 $\bar{N}_{{{\rm eC}}} $
and
 $\bar{N}_{{\rm e}} $
methods give lower value than regression method. Moreover, as the increase in the inbreeding is almost linear, the regression methods can be used in this study. Gutiérrez and Goyache (Reference Gutiérrez, Cervantes, Molina, Valera and Goyache2005) reported that, when information is scarce, N
e estimations based on maximum and full generations traced could be considered as the upper and lower limits of the parameter in the analysed population. Estimates based on the mean equivalent generations should be close to real value of N
e.
In addition, there are other methods that are based on sex ratio (N
es) and the variance of progeny size (N
ev) (Leroy et al., Reference Leroy, Mary-Huard, Verrier, Danvy, Charvolin and Danchin-Burge2013). However, there is no standard method for general application to obtain the effective population size. Even though there is a noticeable evidence on this issue, there is still some controversy (Leroy et al., Reference Leroy, Mary-Huard, Verrier, Danvy, Charvolin and Danchin-Burge2013). Some researchers pointed out that the equal
 $\bar{N}_{{\rm e}} $
and
 $\bar{N}_{{{\rm eC}}} $
methods have better performance in comparison with other methods in some situations (Goyache et al., Reference Goyache, Gutiérrez, Fernández, Gómez, Álvarez, Díez and Royo2013). Comparison of
 $$\bar{N}_{{{\rm eC}}} $$
and
 $\bar{N}_{{\rm e}} $
shows that the mating is performed as good as possible so for this reason, it can be proved by checking the
 $${{\bar{N}_{{{\rm eC}}} } \mathord{\left/ {\vphantom {{\bar{N}_{{{\rm eC}}} } {\bar{N}_{{\rm e}} }}} \right. \kern-\nulldelimiterspace} {\bar{N}_{{\rm e}} }}$$
ratio (the equal 1) and the comparison of double of average F with average AR (the equal 1). This is considered as an unstructured population; the results do not support the existence of preferential mating within the Turkish Arab horse. If the ratio
 $${{\bar{N}_{{{\rm eC}}} } \mathord{\left/ {\vphantom {{\bar{N}_{{{\rm eC}}} } {\bar{N}_{{\rm e}} }}} \right. \kern-\nulldelimiterspace} {\bar{N}_{{\rm e}} }}$$
is >1, it shows that specific genetic lines are proven (Cervantes et al., Reference Cervantes, Goyache, Molina, Valera and Gutiérrez2011).
In this study, the values of N e are not low as classical values (50 to 100) by FAO (1992). Thus, this breed may not be at risk. To compare N e values, we need to use the same method across populations or at least taking into account the limitation of each methodology. A tendency of increasing inbreeding has demonstrated that in future it might lead to limitation in genetic variation in Turkish Arab horse. Because the Turkish Arab horse is a racehorse breed, selection on the basis of performance is expected as this has an impact on total earnings and conformation, but genetic variability should not be further reduced. To obtain genetic variability in future, which is needed for making effective selection, family size should be restricted, and the number of stallions for breeding should be increased. Besides, the level of relatedness of the foals and their inbreeding coefficients recorded in the pedigree annually should be calculated. Thus, mating could be planned based on these calculations to control the rate of inbreeding increase of the foals.
Acknowledgements
The author thanks Juan Pablo Gutiérrez, Félix Goyache and Isabel Cervantes for the use of the Endog software. Moreover, the author is especially grateful to reviewers for helpful comments and suggestions on a previous versions of this manuscript.