1. Introduction
A large number of biological sequences are currently available. The local score in sequence analysis, first defined in [Reference Karlin and Altschul8], quantifies the highest level of a certain quantity of interest, e.g. hydrophobicity, polarity, etc., that can be found locally inside a given sequence. This allows us, for example, to detect atypical segments in biological sequences. In order to distinguish significantly interesting segments from ones that may have appeared by chance alone, it is necessary to evaluate the p-value of a given local score. Different results have already been established using different probabilistic models for sequences: independent and identically distributed (i.i.d.) variables model [Reference Cellier, Charlot and Mercier2, Reference Karlin and Altschul8, Reference Karlin and Dembo9, Reference Mercier and Daudin12], Markovian models [Reference Hassenforder and Mercier7, Reference Karlin and Dembo9], and hidden Markov models [Reference Durbin, Eddy, Krogh and Mitchion4]. In this article we will focus on the Markovian model.
An exact method was proposed in [Reference Hassenforder and Mercier7] to calculate the distribution of the local score for a Markovian sequence, but this result is computationally time-consuming for long sequences ( ${>}10^3$
). Karlin and Dembo [Reference Karlin and Dembo9] established the limit distribution of the local score for a Markovian sequence and a random scoring scheme depending on the pairs of consecutive states in the sequence. They proved that, in the case of a non-lattice scoring scheme, the distribution of the local score is asymptotically a Gumble distribution, as in the i.i.d. case. In the lattice case, they gave asymptotic lower and upper bounds of Gumbel type for the local score distribution. In spite of its importance, their result in the Markovian case is unfortunately very little cited or used in the literature. A possible explanation could be that the random scoring scheme defined in [Reference Karlin and Dembo9] is more general than the ones classically used in practical approaches. In [Reference Fariello5] and [Reference Guedj6], the authors verify by simulations that the local score in a certain dependence model follows a Gumble distribution, and use simulations to estimate the two parameters of this distribution.
In this article we study the Markovian case for a more classical scoring scheme. We propose a new approximation, given as an asymptotic equivalence when the length of the sequence tends to infinity, for the distribution of the local score of a Markovian sequence. We compare it to the asymptotic bounds of [Reference Karlin and Dembo9] and illustrate the improvements both in a simple application case and on the real data examples proposed in [Reference Karlin and Altschul8].
1.1. Mathematical framework
Let  $(A_i)_{i \geq 0}$
be an irreducible and aperiodic Markov chain taking its values in a finite set
 $\mathcal{A}$
containing r states denoted
 $\alpha$
,
 $\beta$
,
 $\dots$
for simplicity. Let
 ${\bf P}=(p_{{\alpha}{\beta}})_{\alpha,\beta \in \mathcal{A}}$
be its transition probability matrix and
 $\pi$
its stationary frequency vector. In this work we suppose that P is positive (for all
 $\alpha,\beta,\ p_{\alpha\beta}>0$
). We also suppose that the initial distribution of
 $A_0$
is given by
 $\pi$
, so that the Markov chain is stationary.
 $\textrm{P}_{\alpha}$
will stand for the conditional probability given
 $\{A_0 = \alpha\}$
. We consider a lattice score function
 $f\,:\, \mathcal{A}\rightarrow d\mathbb{Z}$
, with
 $d\in\mathbb{N}$
being the lattice step. Note that, since
 $\mathcal{A}$
is finite, we have a finite number of possible scores. Since the Markov chain
 $(A_i)_{i \geq 0}$
is stationary, the distribution of
 $A_i$
is
 $\pi$
for every
 $i \geq 0$
. We will simply denote by
 $\textrm{E}[\,f(A)]$
the average score.
In this article we make the hypothesis that the average score is negative, i.e.
 \begin{eqnarray}\text{Hypothesis (1): }\ \ \textrm{E}[\,f(A)]=\sum_{\alpha}f({\alpha})\pi_{\alpha}<0. \end{eqnarray}
We will also suppose that for every  ${\alpha} \in \mathcal{A}$
we have
 \begin{eqnarray}\text{Hypothesis (2): }\ \ \textrm{P}_{\alpha}(\,f(A_1) > 0) > 0. \end{eqnarray}
Note that, thanks to the assumption  ${p}_{{\alpha\beta}}>0$
for all
 $\alpha,\beta$
, Hypothesis (2) is equivalent to the existence of
 $\beta \in \mathcal{A}$
such that
 $f({\beta}) > 0$
.
Let us introduce some definitions and notation. Let  $S_{0}\coloneqq 0$
and
 $S_{k}\coloneqq \sum_{i=1}^kf(A_i)$
for
 $k\geq 1$
be the successive partial sums. Let
 $S^+$
be the maximal non-negative partial sum:
 $S^+\coloneqq \max\{0,S_k \,:\, k \geq 0\}$
.
Further, let  $\sigma^-\coloneqq \inf\{k\geq 1\,:\,S_k<0\}$
be the time of the first negative partial sum. Note that
 $\sigma^-$
is an almost surely (a.s.) finite stopping time due to Hypothesis (1), and let
 $Q_1 \coloneqq \max_{0 \leq k < \sigma^-} S_k$
.
First introduced in [Reference Karlin and Altschul8], the local score, denoted  $M_n$
, is defined as the maximum segmental score for a sequence of length n:
 $M_{n}\coloneqq \max_{0\leq k\leq \ell\leq n}(S_{\ell}-S_{k})$
.
Note that in order to study the distributions of the variables  $S^+$
,
 $Q_1$
, and
 $M_n$
, which all take values in
 $d\mathbb{N}$
, it suffices to focus on the case
 $d=1$
. We will thus consider
 $d=1$
throughout the article.
Remark 1.1. Karlin and Dembo [Reference Karlin and Dembo9] considered a more general model, with a random score function defined on pairs of consecutive states of the Markov chain: they associated with each transition  $(A_{i-1},A_{i})=(\alpha,\beta)$
a bounded random score
 $X_{{\alpha}{\beta}}$
whose distribution depends on the pair
 $(\alpha,\beta)$
. Moreover, they supposed that, for
 $(A_{i-1},A_i)=(A_{j-1},A_j)=(\alpha,\beta)$
, the random scores
 $X_{A_{i-1} A_i}$
and
 $X_{A_{j-1} A_j}$
are independent and identically distributed as
 $X_{\alpha\beta}$
. Their model is also more general in that the scores are not restricted to the lattice case and may be continuous random variables.
The framework of this article corresponds to the case where the score function is deterministic and lattice, with  $X_{A_{i-1}A_{i}}=f(A_i)$
.
Note also that in our case Hypotheses (1) and (2) assure so-called cycle positivity, i.e. the existence of some state  $\alpha \in \mathcal{A}$
and of some
 $m \geq 2$
satisfying
 $\textrm{P}(\bigcap_{k=1}^{m-1} \{S_k>0\} \mid A_0=A_m=\alpha ) > 0$
. In [Reference Karlin and Dembo9], in order to simplify the presentation, the authors strengthened the assumption of cycle positivity by assuming that
 $\textrm{P}(X_{\alpha\beta} > 0) > 0$
and
 $\textrm{P}(X_{\alpha\beta} < 0) > 0$
for all
 $\alpha, \beta \in \mathcal{A}$
(see (1.19) of [Reference Karlin and Dembo9]), but in fact cycle positivity is sufficient for their results to hold.
In Section 2 we first introduce a few more definitions and some notation. We then present the main results: in Theorem 2.1, we propose a recursive result for the exact distribution of the maximal non-negative partial sum  $S^+$
for an infinite sequence, and in Theorem 2.3, based on the exact distribution of
 $S^+$
, we further propose a new approximation for the tail behaviour of the height of the first excursion
 $Q_1$
. We also establish in Theorem 2.4 an asymptotic equivalence result for the distribution of the local score
 $M_n$
when the length n of the sequence tends to infinity. Section 3 contains the proofs of the results of Section 2 and of some useful lemmas which use techniques of Markov renewal theory and large deviations. In Section 4 we propose a computational method for deriving the quantities appearing in the main results. A simple scoring scheme is developed in Section 4.4, for which we compare our approximations to those proposed by Karlin and Dembo [Reference Karlin and Dembo9] in the Markovian case. In Section 4.5 we also show the improvements brought by the new approximations on the real data examples of [Reference Karlin and Altschul8].
2. Statement of the main results
2.1. Definitions and notation
Let  $K_0 \coloneqq 0$
and, for
 $i \geq 1$
,
 $K_i \coloneqq \inf\{k > K_{i-1} \,:\, S_{k} - S_{K_{i-1}} < 0\}$
be the successive decreasing ladder times of
 $(S_k)_{k\geq 0}$
. Note that
 $K_1 = \sigma^-$
.
We now consider the subsequence  $(A_i)_{ 0 \leq i \leq n}$
for a given length
 $n \in \mathbb{N}\setminus \{0\}$
. Denote by
 $m(n)\coloneqq \max\{i \geq 0\ :\ K_i \leq n\}$
the random variable corresponding to the number of decreasing ladder times arrived before n. For every
 $i=1,\dots,m(n)$
, we call the sequence
 $(A_j)_{K_{i-1}< j\leq K_{i}}$
the ith excursion above 0.
Note that due to the negative drift we have  $\textrm{E}[K_1] < \infty$
(see Lemma 3.7) and
 $m(n) \to \infty$
a.s. when
 $n \to \infty$
. With every excursion
 $i=1,\dots,m(n)$
we associate its maximal segmental score (also called height)
 $Q_{i}$
defined by
 $Q_i \coloneqq \max_{K_{i-1}\leq k < K_{i}} (S_k - S_{K_{i-1}})$
.
Note that  $M_{n}={\max}(Q_1,\dots,Q_{m(n)},Q^*)$
, with
 $Q^*$
being the maximal segmental score of the last incomplete excursion
 $(A_j)_{K_{m(n)}< j\leq n}$
. Mercier and Daudin [Reference Mercier and Daudin12] gave an alternative expression for
 $M_n$
using the Lindley process
 $(W_k)_{k \geq 0}$
describing the excursions above zero between the successive stopping times
 $(K_i)_{i\geq 0}$
. With
 $W_0\coloneqq 0$
and
 $W_{k+1}\coloneqq {\max}(W_{k}+f(A_{k+1}),0)$
, we have
 $M_{n}=\max_{0\leq k\leq n}W_k$
.
For every  $\alpha, \beta \in \mathcal{A}$
, we denote
 $q_{\alpha\beta}\coloneqq \textrm{P}_{\alpha}(A_{K_1} = \beta)$
and
 ${\bf Q}\coloneqq (q_{\alpha\beta})_{\alpha,\beta \in \mathcal{A}}$
. Define
 $\mathcal{A}^-\coloneqq \{\alpha\in\mathcal{A}\,:\,f(\alpha)<0\}$
and
 $\mathcal{A}^+\coloneqq \{\alpha\in\mathcal{A}\,:\,f(\alpha)>0\}$
. Note that the matrix Q is stochastic, with
 $q_{\alpha\beta}=0$
for
 $\beta \in \mathcal{A}\setminus \mathcal{A}^-$
. Its restriction
 $\tilde{\mathbf{Q}}$
to
 $\mathcal{A}^-$
is stochastic and irreducible, since
 $q_{\alpha \beta}\geq p_{\alpha \beta} > 0$
for all
 $\alpha, \beta \in \mathcal{A}^-$
. The states
 $(A_{K_i})_{i \geq 1}$
of the Markov chain at the end of the successive excursions define a Markov chain on
 $\mathcal{A}^-$
with transition probability matrix
 $\tilde{\mathbf{Q}}$
.
For every  $i \geq 2$
we thus have
 $\textrm{P}(A_{K_i} = \beta \mid A_{K_{i-1}} = \alpha ) = q_{\alpha \beta}$
if
 $\alpha, \beta \in \mathcal{A}^-$
and 0 otherwise. Denote by
 $\tilde{z} > 0$
the stationary frequency vector of the irreducible stochastic matrix
 $\tilde{\mathbf{Q}}$
, and let
 $z\coloneqq (z_{\alpha})_{\alpha\in\mathcal{A}}$
, with
 $z_{\alpha}=\tilde{z}_{\alpha} > 0$
for
 $\alpha\in\mathcal{A}^-$
and
 $z_{\alpha}=0$
for
 $\alpha \in \mathcal{A} \setminus \mathcal{A}^-$
. Note that z is invariant for the matrix Q, i.e.
 $z{\bf Q}=z$
.
Remark 2.1. Note that in Karlin and Dembo’s Markovian model of [Reference Karlin and Dembo9] the matrix Q is irreducible, thanks to their random scoring function and to their hypotheses recalled in Remark 1.1.
Using the strong Markov property, conditionally on  $(A_{K_i})_{i \geq 1}$
the random variables
 $(Q_i)_{i \geq 1}$
are independent, with the distribution of
 $Q_i$
depending only on
 $A_{K_{i-1}}$
and
 $A_{K_{i}}$
.
For every  $\alpha \in \mathcal{A}$
,
 $\beta \in \mathcal{A}^-$
, and
 $y \geq 0$
, let
 $F_{Q_1,\alpha, \beta}(y)\coloneqq \textrm{P}_\alpha(Q_1 \leq y \mid A_{\sigma^-} = \beta)$
and
 $F_{Q_1,\alpha}(y)\coloneqq \textrm{P}_\alpha(Q_1 \leq y)$
. Note that for any
 $\alpha \in \mathcal{A}^-$
and
 $i \geq 1$
,
 $F_{Q_1,\alpha, \beta}$
represents the cumulative distribution function (CDF) of the height
 $Q_i$
of the ith excursion given that it starts in state
 $\alpha$
and ends in state
 $\beta$
, i.e.
 $F_{Q_1,\alpha, \beta}(y)=\textrm{P}(Q_i \leq y \mid A_{K_i} = \beta, A_{K_{i-1}} = \alpha)$
, whereas
 $F_{Q_1,\alpha}$
represents the CDF of
 $Q_i$
conditionally on the ith excursion starting in state
 $\alpha$
, i.e.
 $F_{Q_1,\alpha}(y)=\textrm{P}(Q_i \leq y \mid A_{K_{i-1}} = \alpha)$
. We thus have
 $F_{Q_1,\alpha}(y)= \sum_{\beta \in \mathcal{A}} F_{Q_1,\alpha, \beta}(y) q_{\alpha \beta}. $
We also introduce the stopping time  $\sigma^+\coloneqq \inf\{k\geq 1\,:\,S_k>0\}$
with values in
 $\mathbb{N} \cup \{\infty\}$
. Due to Hypothesis (1) we have
 $\textrm{P}_\alpha(\sigma^+ < \infty) < 1$
for all
 $\alpha\in \mathcal{A}$
.
For every  $\alpha, \beta \in \mathcal{A}$
and
 $\xi > 0$
, let
 $L_{\alpha\beta}(\xi)\coloneqq \textrm{P}_{\alpha}(S_{\sigma^+} \leq \xi,\, \sigma^+<\infty,\, A_{\sigma^+}=\beta)$
. Note that
 $L_{\alpha\beta}(\xi) = 0$
for
 $\beta \in \mathcal{A} \setminus \mathcal{A}^+$
, and
 $L_{\alpha\beta}(\infty) \leq \textrm{P}_\alpha(\sigma^+ < \infty) < 1$
, therefore
 $\int_{0}^{\infty} \textrm{d} L_{\alpha\beta}(\xi) = L_{\alpha\beta}(\infty) <1.$
Let us also denote by  $L_{\alpha}(\xi)\coloneqq \sum_{\beta \in \mathcal{A}^+}L_{\alpha \beta}(\xi) = \textrm{P}_{\alpha}(S_{\sigma^+} \leq \xi,\, \sigma^+<\infty)$
the conditional CDF of the first positive partial sum, when it exists, given that the Markov chain starts in state
 $\alpha$
, and
 $L_{\alpha}(\infty) \coloneqq \lim_{\xi \to \infty} L_{\alpha}(\xi) = \textrm{P}_{\alpha}(\sigma^+<\infty)$
.
For any  $\theta \in \mathbb{R}$
we introduce the matrix
 ${\boldsymbol \Phi}(\theta)\coloneqq \left(p_{\alpha\beta}\cdot{\exp}(\theta f(\beta))\right)_{\alpha,\beta \in \mathcal{A}}$
. Since the transition matrix P is positive, by the Perron–Frobenius theorem the spectral radius
 $\rho(\theta) > 0$
of the matrix
 ${\boldsymbol \Phi}(\theta)$
coincides with its dominant eigenvalue, for which there exists a unique positive right eigenvector
 $u(\theta)=(u_i(\theta))_{1\leq i \leq r}$
(seen as a column vector) normalized so that
 $\sum_{i=1}^r u_i(\theta)=1$
. Moreover,
 $\theta \mapsto \rho(\theta)$
is differentiable and strictly log convex (see [Reference Dembo and Karlin3, Reference Karlin and Ost10, Reference Lancaster11]). In Lemma 3.5 we prove that
 $\rho'(0) = \textrm{E}[\,f(A)]$
, hence
 $\rho'(0) < 0$
by Hypothesis (1). Together with the strict log convexity of
 $\rho$
and the fact that
 $\rho(0)= 1$
, this implies that there exists a unique
 $\theta^* > 0$
such that
 $\rho(\theta^*)=1$
(see [Reference Dembo and Karlin3] for more details).
2.2. Main results: Improvements on the distribution of the local score
Let  $\alpha \in \mathcal{A}$
. We start by giving a result which allows us to recursively compute the CDF of the maximal non-negative partial sum
 $S^+$
. We denote by
 $F_{S^+,\alpha}$
the CDF of
 $S^+$
conditionally on starting in state
 $\alpha$
:
 $F_{S^+,\alpha}(\ell) \coloneqq \textrm{P}_{\alpha}(S^+\leq\ell)$
for all
 $\ell \in \mathbb{N} $
, and for every
 $k \in \mathbb{N}\setminus \{0\}$
and
 $\beta \in \mathcal{A}$
,
 $L^{(k)}_{\alpha \beta}\coloneqq \textrm{P}_\alpha(S_{\sigma^+} = k,\, \sigma^+ < \infty,\, A_{\sigma^+} = \beta)$
. Note that
 $L^{(k)}_{\alpha \beta}=0$
for
 $\beta \in \mathcal{A} \setminus \mathcal{A}^+$
and
 $L_{\alpha}(\infty) = \sum_{\beta \in \mathcal{A}^+} \sum_{k=1}^{\infty} L^{(k)}_{\alpha \beta}.$
The following result gives a recurrence relation for the double sequence  $(F_{S^+,\alpha}{(\ell )})_{\alpha,\ell}$
involving the coefficients
 $L_{\alpha\beta}^{(k)}$
, which can be computed recursively (see Section 4.2).
Theorem 2.1. (Exact result for the distribution of  $S^+$
). For all
 $\alpha\in\mathcal{A}$
and
 $\ell \geq 1$
:
 \begin{align*}F_{S^+,\alpha}(0) &=\textrm{P}_\alpha(\sigma^+ = \infty) = 1 - L_{\alpha}(\infty),\\F_{S^+,\alpha}{(\ell )} &=1 - L_{\alpha}(\infty) + \sum_{\beta \in \mathcal{A}^+} \sum_{k=1}^{\ell} L^{(k)}_{\alpha \beta} \ F_{S^+,\beta}{(\ell-k)}.\end{align*}
The proof will be given in Section 3.
In Theorem 2.2 we obtain an asymptotic result for the tail behaviour of  $S^+$
using Theorem 2.1 and ideas inspired from [Reference Karlin and Dembo9] adapted to our framework (see also the discussion in Remark 1.1). Before stating this result we need to introduce some more notation.
For every  $\alpha, \beta \in \mathcal{A}$
and
 $k \in \mathbb{N}$
we denote
 \[G_{\alpha\beta}^{(k)} \coloneqq \frac{u_{\beta}(\theta^{*})}{u_{\alpha}(\theta^*)} \textrm{e}^{\theta^* k }L_{\alpha\beta}^{(k)},\qquad G_{\alpha\beta}{(k)} \coloneqq \sum_{\ell=0}^{k} G_{\alpha\beta}^{(\ell)},\qquad G_{\alpha\beta}{(\infty)} \coloneqq \sum_{k=0}^{\infty} G_{\alpha\beta}^{(k)}.\]
The matrix  ${\bf G(\infty)}\coloneqq (G_{\alpha\beta}(\infty))_{\alpha, \beta}$
is stochastic, using Lemma 3.3; the subset
 $\mathcal{A}^+$
is a recurrent class, whereas the states in
 $\mathcal{A}\setminus \mathcal{A}^+$
are transient. The restriction of
 ${\bf G(\infty)}$
to
 $\mathcal{A}^+$
is stochastic and irreducible; we denote by
 $\tilde{w} > 0$
the corresponding stationary frequency vector. Define
 $w=(w_{\alpha})_{\alpha\in\mathcal{A}}$
, with
 $w_{\alpha}=\tilde{w}_{\alpha} > 0$
for
 $\alpha\in\mathcal{A}^+$
and
 $w_{\alpha}=0$
for
 $\alpha \in \mathcal{A}\setminus \mathcal{A}^+$
. The vector w is invariant for
 $\bf G(\infty)$
, i.e.
 $w{\bf G(\infty)}=w$
.
Remark 2.2. Note that in Karlin and Dembo’s Markovian model of [Reference Karlin and Dembo9] the matrix  ${\bf G(\infty)}$
is positive, hence irreducible, thanks to their random scoring function and to their hypotheses recalled in Remark 1.1.
Remark 2.3. In Section 4.3 we detail a recursive procedure for computing the CDF  $F_{S^+,\alpha}$
, based on Theorem 2.1. Note also that, for every
 $\alpha, \beta \in \mathcal{A}$
, there are a finite number of
 $L_{\alpha\beta}^{(k)}$
terms different from zero, and therefore there are a finite number of non-null terms in the sum defining
 $G_{\alpha \beta}(\infty)$
.
The following result is the analogue, in our setting, of Lemma 4.3 of [Reference Karlin and Dembo9].
Theorem 2.2. (Asymptotics for the tail behaviour of  $S^+$
.) For every
 $\alpha\in \mathcal{A}$
we have
 \begin{equation}\lim_{k \rightarrow +\infty} \frac{{ \textrm{e}}^{{\theta^{*}}{k}}\textrm{P}_{\alpha}(S^+>k)}{u_{\alpha}(\theta^{*})} = \frac{1}{c} \cdot \sum_{\gamma \in \mathcal{A}^{+}} \frac{w_{\gamma}}{u_{\gamma}(\theta^{*})}\sum_{\ell \geq 0} (L_{\gamma}(\infty)-L_{\gamma}(\ell )) \textrm{e}^{\theta^{*}\ell }\coloneqq c(\infty),\end{equation}
where  $w=(w_{\alpha})_{\alpha\in \mathcal{A}}$
is the stationary frequency vector of the matrix
 $\bf G(\infty)$
and
 \[c\coloneqq \sum_{\gamma,\beta \in \mathcal{A}^+} \frac{w_{\gamma}}{u_{\gamma}(\theta^*)}u_{\beta}(\theta^*) \sum_{\ell \geq 0} \ell \cdot \textrm{e}^{\theta^*{\ell }} \, L^{(\ell)}_{\gamma \beta}.\]
The proof is deferred to Section 3.
Remark 2.4. Note that there are a finite number of non-null terms in the above sums over  $\ell$
. We also have the following alternative expression for
 $c(\infty)$
:
 \[c(\infty) = \frac{1}{c(\textrm{e}^{\theta^*}-1)} \cdot \sum_{\gamma \in \mathcal{A}^+} \frac{w_{\gamma}}{u_{\gamma}(\theta^*)} \big\{\textrm{E}_\gamma\big[\textrm{e}^{\theta^* S_{\sigma^+}};\, \sigma^+
< \infty\big] - L_\gamma(\infty)\big\}.\]
Indeed, by the summation by parts formula
 \[\sum_{\ell=m}^k f_\ell (g_{\ell+1}-g_\ell) = f_{k+1} g_{k+1} - f_m g_m - \sum_{\ell=m}^k (\,f_{\ell+1}-f_\ell)g_{\ell+1},\]
we obtain
 \begin{align*}& \sum_{\ell = 0}^{\infty} (L_{\gamma}(\infty)-L_{\gamma}(\ell )) \textrm{e}^{\theta^*\ell }= \frac{1}{\textrm{e}^{\theta^*}-1} \sum_{\ell = 0}^{\infty} (L_{\gamma}(\infty)-L_{\gamma}(\ell )) (\textrm{e}^{\theta^*(\ell+1) } - \textrm{e}^{\theta^*\ell } )\\[3pt] & = \frac{1}{\textrm{e}^{\theta^*}-1}\\[3pt] &\quad\times \bigg\{ \lim_{k \to \infty} (L_{\gamma}(\infty)-L_{\gamma}(k )) \textrm{e}^{\theta^*k } - L_{\gamma}(\infty) - \sum_{\ell = 0}^{\infty} (L_{\gamma}(\ell )-L_{\gamma}(\ell+1) ) \textrm{e}^{\theta^*(\ell+1) } \bigg\}\\[3pt] & = \frac{1}{\textrm{e}^{\theta^*}-1} \bigg\{ - L_{\gamma}(\infty) + \sum_{\ell = 0}^{\infty} \textrm{e}^{\theta^*(\ell+1) } \, \textrm{P}_{\gamma}(S_{\sigma^+} = \ell+1 , \, \sigma^+<\infty) \bigg\}\\[3pt] & = \frac{1}{\textrm{e}^{\theta^*}-1} \big\{\textrm{E}_\gamma\big[\textrm{e}^{\theta^* S_{\sigma^+}};\, \sigma^+
< \infty\big] - L_\gamma(\infty)\big\}.\end{align*}
Before stating the next results, let us denote, for every integer  $\ell < 0$
and
 $\alpha, \beta \in \mathcal{A}$
,
 $Q_{\alpha\beta}^{(\ell)}\coloneqq \textrm{P}_{\alpha}(S_{\sigma^-}=\ell , \, A_{\sigma^-}=\beta)$
. Note that
 $Q_{\alpha\beta}^{(\ell)} = 0$
for
 $\beta \in \mathcal{A} \setminus \mathcal{A}^-$
. In Section 4 we give a recursive method for computing these quantities.
Using Theorem 2.2 we obtain the following result, where the notation  $f_k \underset{k\rightarrow\infty}{\sim} g_k$
means
 $f_k - g_k = o(g_k)$
, or equivalently
 $\displaystyle \frac{f_k}{g_k} \underset{k\rightarrow\infty}{\rightarrow} 1$
.
Theorem 2.3. (Asymptotic approximation for the tail behaviour of  $Q_1$
.) We have the following asymptotic result on the tail distribution of the height of the first excursion: for every
 $\alpha \in \mathcal{A}$
we have
 \begin{equation}\textrm{P}_{\alpha}(Q_1>k)\underset{k\rightarrow\infty}{\sim}\textrm{P}_{\alpha}(S^+>k)-\sum_{\ell<0}\sum_{\beta \in \mathcal{A}^-}\textrm{P}_{\beta}\left (S^+>k-\ell\right )\cdot Q_{\alpha\beta}^{(\ell)}.\end{equation}
The proof will be given in Section 3.
Remark 2.5. Note that, as a straightforward consequence of Theorems 2.2 and 2.3, we recover the following limit result of Karlin and Dembo [Reference Karlin and Dembo9] (Lemma 4.4):
 \[\lim_{k \rightarrow +\infty} \frac{\textrm{e}^{\theta^*{k}}\textrm{P}_{\alpha}(Q_1>k)}{u_{\alpha}(\theta^*)}= c(\infty)\bigg\{1 - \sum_{\beta \in \mathcal{A}^-} \frac{u_{\beta}(\theta^*)}{u_{\alpha}(\theta^*)} \sum_{\ell
< 0} \textrm{e}^{\theta^*\ell }Q^{(\ell)}_{\alpha \beta}\bigg\}.\]
Using Theorems 2.2 and 2.3, we finally obtain the following result on the asymptotic distribution of the local score  $M_n$
for a sequence of length n.
Theorem 2.4. (Asymptotic distribution of the local score  $M_n$
.) For every
 $\alpha \in \mathcal{A}$
and
 $x \in {\mathbb R}$
we have:
 \begin{align}&\textrm{P}_\alpha \left(M_n\leq \frac{\log (n)}{\theta^*}+x\right ) \underset{n\rightarrow\infty}{\sim} \exp\bigg \{-\frac{n}{A^*}\sum_{\beta \in \mathcal{A}^-} z_{\beta} \textrm{P}_{\beta}\left (S^+> \left \lfloor \log(n)/\theta^*+x\right\rfloor \right )\bigg \} \nonumber \\[3pt] &\quad \times\exp\bigg\{ \frac{n}{A^{*}}\sum_{k
< 0}\sum_{\gamma \in \mathcal{A}^{-}} \textrm{P}_{\gamma}\left(S^+>\left \lfloor\log(n)/\theta^{*}+x\right\rfloor -k\right) \cdot\sum_{\beta \in \mathcal{A}^{-}}z_{\beta}Q_{\beta\gamma}^{(k)}\bigg \},\end{align}
where  $z=(z_{\alpha})_{\alpha\in \mathcal{A}}$
is the invariant probability measure of the matrix Qdefined in Section 2.1, and
 \begin{align*}\displaystyle A^* \coloneqq \lim_{m\rightarrow +\infty} \frac{K_m}{m} = \frac{1}{\textrm{E}(\,f(A))}\sum_{\beta \in \mathcal{A}^-} z_{\beta} \textrm{E}_\beta[S_{\sigma^-}]\mbox{ a.s.}\end{align*}
• Note that the asymptotic equivalent in (5) does not depend on the initial state
 $\alpha$
.
• We recall, for comparison, the asymptotic lower and upper bounds of [Reference Karlin and Dembo9] for the distribution of
$M_n$
:
(6)
\begin{equation}\liminf_{n\rightarrow +\infty}\textrm{P}_\alpha \left(M_n\leq \frac{\log (n)}{\theta^*}+x\right ) \geq \exp\left \{-K^+ {\exp}({-}\theta^*x)\right\}\!,\vspace*{-6pt}\end{equation}
(7)
\begin{equation}\limsup_{n\rightarrow +\infty}\textrm{P}_\alpha \left(M_n\leq \frac{\log (n)}{\theta^*}+x\right )\leq \exp\left \{-K^*{\exp}({-}\theta^*x) \right\}\!,\end{equation}
with
$K^+= K^*{\exp}(\theta^*) $
and
$K^*=v(\infty)\cdot c(\infty)$
, where
$c(\infty)$
is given in Theorem 2.2 and is related to the defective distribution of the first positive partial sum
$S_{\sigma^+}$
(see also Remark 2.4), and
$v(\infty)$
is related to the distribution of the first negative partial sum
$S_{\sigma^-}$
(see (5.1) and (5.2) of [Reference Karlin and Dembo9] for more details). A more explicit formula for
$K^*$
is given in Section 4.4 for an application in a simple case.• Even if the expression of our asymptotic equivalent in (5) seems more cumbersome than the asymptotic bounds recalled in (6) and (7), the practical implementations are equivalent.






3. Proofs of the main results
3.1. Proof of Theorem 2.1
 \vspace*{-12pt}\begin{align*}F_{S^+,\alpha}(\ell )&= \textrm{P}_\alpha(\sigma^+ = \infty) + \textrm{P}_\alpha(S^+ \leq \ell ,\, \sigma^+ < \infty)\\[3pt] &=1 - L_{\alpha}(\infty) + \sum_{\beta \in \mathcal{A}^+} \sum_{k=1}^{\ell} \textrm{P}_\alpha(S^+ \leq \ell ,\, \sigma^+ < \infty,\, S_{\sigma^+} = k ,\, A_{\sigma^+} = \beta)\\[3pt] &= 1 - L_{\alpha}(\infty) + \sum_{\beta \in \mathcal{A}^+} \sum_{k=1}^{\ell} L^{(k)}_{\alpha \beta} \, \textrm{P}_\alpha(S^+ \leq \ell \mid \sigma^+
< \infty,\, S_{\sigma^+} = k ,\, A_{\sigma^+} = \beta).\end{align*}
It then suffices to note that
 \[\textrm{P}_\alpha(S^+ - S_{\sigma^+} \leq \ell-k \mid \sigma^+
< \infty,\, S_{\sigma^+} = k,\, A_{\sigma^+} = \beta)= \textrm{P}_\beta(S^+ \leq \ell-k) ,\]
by the strong Markov property applied to the stopping time  $\sigma^+$
.
 $\hfill\square$
3.2. Proof of Theorem 2.2
We first prove some preliminary lemmas.
Lemma 3.1.  $\lim_{k \to \infty} \textrm{P}_\alpha(S^+ > k)= 0$
for every
 $\alpha \in \mathcal{A}$
.
Proof. With  $F_{S^+,\alpha}$
defined in Theorem 2.1, we introduce, for every
 $\alpha$
and
 $\ell \geq 0$
,
 \[b_{\alpha}(\ell ) \coloneqq \frac{1-F_{S^+,\alpha}(\ell )}{u_{\alpha}(\theta^*)}\textrm{e}^{\theta^*\ell }, \qquad a_{\alpha}(\ell ) \coloneqq \frac{L_{\alpha}(\infty) - L_{\alpha}(\ell )}{u_{\alpha}(\theta^*)}\textrm{e}^{\theta^*\ell }.\]
Theorem 2.1 allows us to obtain the following renewal system for the family  $(b_{\alpha})_{\alpha\in\mathcal{A}}$
:
 \begin{equation}\text{for all } \ell > 0, \text{ for all }\alpha \in \mathcal{A},\quad b_{\alpha}(\ell )= a_{\alpha}(\ell ) + \sum_{\beta} \sum_{k = 0}^{\ell} b_{\beta}(\ell-k) G^{(k)}_{\alpha \beta}.\end{equation}
Since the restriction  ${\tilde{\mathbf{G}}(\infty)}$
of
 ${\bf G(\infty)}$
to
 $\mathcal{A}^+$
is stochastic, its spectral radius equals 1 and the corresponding right eigenvector is the vector having all components equal to 1; the left eigenvector is the stationary frequency vector
 $\tilde w > 0$
.
Step 1: For every  $\alpha \in \mathcal{A}^+$
, a direct application of Theorem 2.2 of [Reference Athreya and Rama Murthy1] gives the formula in (3) for the limit
 $c(\infty)$
of
 $b_{\alpha}(\ell )$
when
 $\ell \to \infty$
, which implies that
 $\displaystyle \lim_{k \to \infty} \textrm{P}_\alpha(S^+ > k)= 0$
.
Step 2: Now consider  $\alpha \notin \mathcal{A}^+$
. By Theorem 2.1 we have
 \[\textrm{P}_\alpha(S^+ > \ell ) = L_{\alpha}(\infty) - \sum_{\beta \in \mathcal{A}^+} \sum_{k=1}^{\ell} L^{(k)}_{\alpha \beta} \left\{1-\textrm{P}_\beta(S^+ > \ell-k) \right\}\!.\]
Since  $\textrm{P}_\beta(S^+ > \ell-k ) = 1$
for
 $k > \ell$
and
 $L_{\alpha}(\infty) = \sum_{\beta \in \mathcal{A}^+} \sum_{k=1}^{\infty} L^{(k)}_{\alpha \beta}$
, we deduce that
 \begin{equation}\textrm{P}_\alpha(S^+ > \ell ) = \sum_{\beta \in \mathcal{A}^+} \sum_{k=1}^{\infty} L^{(k)}_{\alpha \beta} \, \textrm{P}_\beta(S^+ > \ell-k ).\end{equation}
Note that for fixed  $\alpha$
and
 $\beta$
there are a finite number of non-null terms in the above sum over k. Using the fact that for fixed
 $\beta \in \mathcal{A}^+$
and
 $k \geq 1$
we have
 $\textrm{P}_\beta(S^+ > \ell-k) \rightarrow 0$
when
 $\ell \to \infty$
, as shown previously in Step 1, the stated result follows.
Lemma 3.2. Let  $\theta > 0$
. With
 $u(\theta)$
defined in Section 2.1, the sequence of random variables
 $(U_m(\theta))_{m \geq 0}$
defined by
 $U_0(\theta)\coloneqq 1$
and
 \[U_m(\theta)\coloneqq \prod_{i=0}^{m-1}\left [ \frac{{\exp}(\theta f(A_{i+1}))}{u_{A_i}(\theta)}\cdot\frac{u_{A_{i+1}}(\theta)}{\rho(\theta)}\right ]=\frac{{\exp}(\theta S_m)u_{A_m}(\theta)}{\rho(\theta)^m u_{A_0}(\theta)}, \qquad \text{for } m \geq 1, \]
is a martingale with respect to the canonical filtration  $\mathcal{F}_m = \sigma(A_0,\ldots, A_m)$
.
Proof. For every  $m \in \mathbb{N}$
and
 $\theta >0$
,
 $U_m(\theta)$
is clearly measurable with respect to
 $\mathcal{F}_m$
and integrable, since
 $\mathcal{A}$
is finite. We can write
 \[U_{m+1}(\theta)=U_m(\theta) \frac{{\exp}(\theta f(A_{m+1})) u_{A_{m+1}}(\theta)}{u_{A_m}(\theta)\rho(\theta)}.\]
Since  $U_m(\theta)$
and
 $u_{A_m} (\theta)$
are measurable with respect to
 $\mathcal{F}_m$
, we have
 \[\textrm{E}[U_{m+1}(\theta) \mid \mathcal{F}_m] = U_m(\theta) \frac{\textrm{E}[{\exp}(\theta f(A_{m+1})) u_{A_{m+1}}(\theta) \mid \mathcal{F}_m] }{u_{A_m} (\theta)\rho(\theta)}.\]
By the Markov property we further have
 \[\textrm{E}[{\exp}(\theta f(A_{m+1})) u_{A_{m+1}}(\theta) \mid \mathcal{F}_m]= \textrm{E}[{\exp}(\theta f(A_{m+1})) u_{A_{m+1}}(\theta) \mid A_m],\]
and by definition of  $u(\theta)$
,
 \[\textrm{E}[{\exp}(\theta f(A_{m+1})) u_{A_{m+1}}(\theta) \mid A_m = \alpha] = \sum_{\beta} {\exp}(\theta f(\beta)) u_{\beta}(\theta) p_{\alpha \beta} =u_{\alpha}(\theta)\rho(\theta). \]
We deduce that  $\textrm{E}[{\exp}(\theta f(A_{m+1})) u_{A_{m+1}}(\theta) \mid A_m] = u_{A_m}(\theta)\rho(\theta)$
, and hence
 $\textrm{E}[U_{m+1}(\theta) \mid \mathcal{F}_m]=U_{m}(\theta)$
, which finishes the proof.$\hfill\square$
Lemma 3.3. With  $\theta^*$
defined at the end of Section 2.1we have, for all
 $\alpha \in \mathcal{A}$
,
 \begin{equation*} \frac{1}{u_\alpha(\theta^*)} \sum_{\beta \in \mathcal{A}^+} \sum_{\ell = 1}^{\infty} L^{(\ell)}_{\alpha \beta} \, \textrm{e}^{\theta^* \ell } \ u_\beta(\theta^*) = 1.\end{equation*}
Proof. The proof uses Lemma 3.1 and ideas inspired by [Reference Karlin and Dembo9] (Lemma 4.2). First note that the above equation is equivalent to  $\textrm{E}_{\alpha}[U_{\sigma^+}(\theta^*);\,\sigma^+<\infty]=1$
, with
 $U_m(\theta)$
defined in Lemma 3.2. By applying the optional sampling theorem to the bounded stopping time
 $\tau_n \coloneqq \min(\sigma^+,n)$
and to the martingale
 $(U_m(\theta^*))_m$
, we obtain
 \[1=\textrm{E}_\alpha[U_0(\theta^*)]=\textrm{E}_\alpha[U_{\tau_n}(\theta^*)] = \textrm{E}_\alpha[U_{\sigma^+}(\theta^*);\, \sigma^+ \leq n] + \textrm{E}_\alpha[U_{n}(\theta^*);\, \sigma^+ > n].\]
We will show that  $\textrm{E}_\alpha[U_{n}(\theta^*); \,\sigma^+ > n] \rightarrow 0$
when
 $n \to \infty$
. Passing to the limit in the previous relation will then give the desired result. Since
 $\rho(\theta^*)=1$
we have
 \[U_n(\theta^*) =\frac{{\exp}(\theta^* S_n)u_{A_n}(\theta^*)}{u_{A_0}(\theta^*)},\]
and it suffices to show that  $\lim_{n \to \infty}\textrm{E}_\alpha[{\exp}(\theta^* S_n);\, \sigma^+ > n] = 0$
.
For a fixed  $a > 0$
we can write
 \begin{align}\textrm{E}_{\alpha}[{\exp}(\theta^{*} S_{n});\, \sigma^{+} &> n] = \textrm{E}_{\alpha}[{\exp}(\theta^{*} S_{n});\, \sigma^{+} > n, \text{there exists } k \leq n\,:\,S_k \leq -2a] \nonumber\\[4pt] & + \textrm{E}_{\alpha}[{\exp}(\theta^{*} S_n);\, \sigma^{+} > n, -2a \leq S_{k} \leq 0, \text{ for all } 0 \leq k \leq n].\end{align}
The first expectation on the right-hand side of (10) can be bounded further:
 \begin{align} &\textrm{E}_\alpha[{\exp}(\theta^* S_n); \, \sigma^+ > n , \text{ there exists } k \leq n\,:\,S_k \leq -2a] \nonumber\\[4pt] &\shoveleft{\leq \textrm{E}_\alpha[{\exp}(\theta^* S_n);\, \sigma^+ > n, S_n \leq -a]} \nonumber\\[4pt] &\qquad + \textrm{E}_\alpha[{\exp}(\theta^* S_n);\, \sigma^+ > n, S_n > -a, \text{ there exists } k
< n\,:\,S_k \leq -2a].\end{align}
We obviously have
 \begin{equation}\textrm{E}_\alpha[{\exp}(\theta^* S_n);\, \sigma^+ > n, \,S_n \leq -a] \leq {\exp}({-}\theta^* a).\end{equation}
Let us further define the stopping time  $T \coloneqq \inf\{k \geq 1 \,:\, S_k \leq -2a\}$
. Note that
 $T < \infty$
a.s., since
 $S_n \rightarrow -\infty$
a.s. when
 $n \to \infty$
. Indeed, by the ergodic theorem, we have
 $S_n/n \rightarrow \textrm{E}[\,f(A)] < 0$
a.s. when
 $n \to \infty$
. Therefore we have
 \begin{align*} &\textrm{E}_\alpha[{\exp}(\theta^* S_n); \sigma^+ > n, S_n > -a,\, \text{there exists }k
< n\,:\,S_k \leq -2a] \leq \textrm{P}_\alpha(T \leq n, S_n > -a)\\[3pt] &\quad = \sum_{\beta \in \mathcal{A}^-} \textrm{P}_\alpha(T \leq n,\, S_n > -a \mid A_T = \beta)\textrm{P}_\alpha(A_T = \beta)\\[3pt] &\quad \leq \sum_{\beta \in \mathcal{A}^-} \textrm{P}_\alpha(S_n - S_T > a \mid A_T = \beta)\textrm{P}_\alpha(A_T = \beta)\leq \sum_{\beta \in \mathcal{A}^-} \textrm{P}_\beta(S^+ > a) \textrm{P}_\alpha(A_T = \beta) ,\end{align*}
by the strong Markov property. For every  $a > 0$
we thus have
 \begin{align}\limsup_{n \to \infty} \textrm{E}_\alpha[{\exp}(\theta^* S_n);\, \sigma^+ > n,\, S_n > -a, \, \text{there exists } k
< n\,:\,S_k \leq -2a] \nonumber\\ \leq \sum_{\beta \in \mathcal{A}^-} \textrm{P}_\beta(S^+ > a).\end{align}
Considering the second expectation on the right-hand side of (10), we have
 \begin{equation}\lim_{n \to \infty} \textrm{P}_\alpha({-}2a \leq S_k \leq 0, \, \text{for all } 0 \leq k \leq n) = \textrm{P}_\alpha({-}2a \leq S_k \leq 0, \, \text{for all } k \geq 0) = 0,\end{equation}
again since  $S_n \rightarrow -\infty$
a.s. when
 $n \to \infty$
.
Equations (10)–(14) imply that, for every  $a > 0$
, we have
 \[\limsup_{n \to \infty} \textrm{E}_\alpha[{\exp}(\theta^* S_n); \, \sigma^+ > n] \leq {\exp}({-}\theta^*a) + \sum_{\beta \in \mathcal{A}^-} \textrm{P}_\beta(S^+ > a).\]
Using Lemma 3.1 and taking  $a \to \infty$
we obtain
 $\lim_{n \to \infty}\textrm{E}_\alpha[{\exp}(\theta^* S_n); \sigma^+ > n] = 0.$
$\hfill\square$
Proof of Theorem 2.2. For  $\alpha \in \mathcal{A}^+$
the formula has already been shown in Step 1 of the proof of Lemma 3.1. For
 $\alpha \notin \mathcal{A}^+$
we prove the stated formula using Theorem 2.1. Equation (9) implies the formula in (8).
Note that for every  $\alpha$
and
 $\beta$
there are a finite number of non-null terms in the above sum over k. Moreover, as shown in Step 1 of the proof of Lemma 3.1, we have, for all
 $\beta \in \mathcal{A}^+$
and
 $k\geq 0$
,
 \[ \frac{\textrm{e}^{\theta^*(\ell-k)}\textrm{P}_{\beta}(S^+>\ell-k)}{u_{\beta}(\theta^*)} \underset{\ell \to \infty}{\longrightarrow} c(\infty).\]
We finally obtain
 \[\lim_{\ell \rightarrow +\infty} \frac{\textrm{e}^{\theta^*{\ell }}\textrm{P}_{\alpha}(S^+> \ell )}{u_{\alpha}(\theta^*)} = \frac{c(\infty)}{u_\alpha(\theta^*)} \sum_{\beta \in \mathcal{A}^+} \sum_{k = 1}^{\infty} L^{(k)}_{\alpha \beta} \, \textrm{e}^{\theta^* k } \ u_\beta(\theta^*),\]
which equals  $c(\infty)$
, as desired, by Lemma 3.3.
3.3. Proof of Theorem 2.3
Since  $S^+ \geq Q_1$
, for every
 $\alpha \in \mathcal{A}$
we have
 \[\textrm{P}_{\alpha}(S^+>k) = \textrm{P}_{\alpha}(Q_1>k) + \textrm{P}_{\alpha}(S^+>k,\, Q_1 \leq k).\]
By applying the strong Markov property to the stopping time  $\sigma^-$
we can further decompose the last probability with respect to the values taken by
 $S_{\sigma^-}$
and
 $A_{\sigma^-}$
:
 \begin{align*}& \textrm{P}_{\alpha}(S^+>k,\, Q_1 \leq k) = \sum_{\ell<0}\sum_{\beta \in \mathcal{A}^-}\textrm{P}_{\alpha}(S^+>k,\, Q_1 \leq k,\, S_{\sigma^-}=\ell,\, A_{\sigma^-}=\beta)\\[3pt] &= \sum_{\ell<0}\sum_{\beta \in \mathcal{A}^-}\textrm{P}_{\alpha}(S^+ -S_{\sigma^-} >k-\ell \mid A_{\sigma^-}=\beta,\, Q_1 \leq k,\, S_{\sigma^-}=\ell ) \\[3pt] & \ \ \ \ \times \textrm{P}_{\alpha}(Q_1 \leq k,\, S_{\sigma^-}=\ell ,\, A_{\sigma^-}=\beta)\\[3pt] &= \sum_{\ell<0}\sum_{\beta \in \mathcal{A}^-}\textrm{P}_{\beta}(S^+ >k-\ell ) \cdot \{Q_{\alpha\beta}^{(\ell)}- \textrm{P}_{\alpha}(Q_1 > k,\, S_{\sigma^-}=\ell ,\, A_{\sigma^-}=\beta) \}.\end{align*}
We thus obtain
 \begin{align*} &\textrm{P}_{\alpha}(S^+>k)-\sum_{\ell <0}\sum_{\beta \in \mathcal{A}^-}\textrm{P}_{\beta}(S^+>k-\ell )\cdot Q_{\alpha\beta}^{(\ell )} - \textrm{P}_{\alpha}(Q_1>k) \\[3pt] &\quad = - \sum_{\ell <0}\sum_{\beta \in \mathcal{A}^-}\textrm{P}_{\beta}(S^+ >k-\ell ) \ \textrm{P}_{\alpha}(Q_1 > k, S_{\sigma^-}=\ell, A_{\sigma^-}=\beta).\end{align*}
By Theorem 2.2 we have  $\textrm{P}_{\beta}(S^+ >k ) = O(\textrm{e}^{-\theta^*k})$
as
 $k \to \infty$
for every
 $\beta \in \mathcal{A}^-$
, from which we deduce that the left-hand side of the previous equation is
 $o(\textrm{P}_{\alpha}(Q_1 > k))$
when
 $k \to \infty$
. The stated result then easily follows.
 $\hfill\square$
3.4. Proof of Theorem 2.4
We will first prove some useful lemmas.
Lemma 3.4. There exists a constant  $C > 0$
such that, for every
 $\alpha \in \mathcal{A}$
,
 $\beta \in \mathcal{A}^-$
, and
 $y > 0$
, we have
 $\textrm{P}_\alpha (Q_1 > y \mid A_{\sigma^-} = \beta) \leq C \textrm{e}^{-\theta^*y}.$
Proof. The proof is partly inspired by [Reference Karlin and Dembo9]. Let  $y > 0$
and denote by
 $\sigma(y)$
the first exit time of
 $S_n$
from the interval [0,y]. Applying the optional sampling theorem to the martingale
 $(U_m(\theta^*))_m$
(see Lemma 3.2) and to the stopping time
 $\sigma(y)$
, we get
 \begin{equation}\textrm{E}_{\alpha} [U_{\sigma(y)}(\theta^*) ]=\textrm{E}_{\alpha} [U_0(\theta^*) ]=1.\end{equation}
The applicability of the optional sampling theorem is guaranteed by the fact that there exists  $\tilde{C} > 0$
such that, for every
 $n \in \mathbb{N}$
, we have
 $0 < U_{\min(\sigma(y),n) }(\theta^*) \leq \tilde{C}$
a.s. Indeed, this follows from the fact that when
 $\sigma(y) > n$
we have
 $0 \leq S_n \leq y$
, and when
 $\sigma(y) \leq n$
either
 $S_{\sigma(y)} < 0$
or
 $y < S_{\sigma(y)} < y + \max\left\{\kern1pt f(\alpha)\,:\, \alpha \in \mathcal{A}^+ \right \}$
.
We deduce from (15) that, for some constant  $K > 0$
, we have
 \begin{align*}1 &= \textrm{E}_{\alpha}\bigg [\textrm{e}^{\theta^* S_{\sigma(y)}}\frac{u_{A_{\sigma(y)}}(\theta^*)}{u_{A_{0}}(\theta^*)} \bigg ] \geq K \textrm{e}^{\theta^*y}\, \textrm{E}_{\alpha} [ \textrm{e}^{\theta^* (S_{\sigma(y)}-y))} \mid S_{\sigma(y)} > y ] \cdot \textrm{P}_{\alpha}(S_{\sigma(y)} > y)\\[5pt] & \geq K \textrm{e}^{\theta^*y} \, \textrm{P}_{\alpha}(S_{\sigma(y)} > y) \geq K \textrm{e}^{\theta^*y} \, \textrm{P}_{\alpha}(S_{\sigma(y)} > y \mid A_{\sigma^-}=\beta)q_{\alpha \beta}.\end{align*}
Note further that,  $\mathcal{A}$
being finite, there exists
 $c > 0$
such that for all
 $\alpha \in \mathcal{A}$
and
 $\beta \in \mathcal{A}^-$
we have
 $q_{\alpha \beta}=\textrm{P}_\alpha(A_{\sigma^-}=\beta) \geq p_{\alpha \beta} \geq c.$
In order to obtain the bound in the statement, it remains to note that
 $\textrm{P}_{\alpha}(Q_1 > y \mid A_{\sigma^-}=\beta) = \textrm{P}_{\alpha}(S_{\sigma(y)} > y \mid A_{\sigma^-}=\beta ).$
Lemma 3.5.  $\rho'(0)=\textrm{E}[\,f(A)]<0$
.
Proof. By the fact that  $\rho(\theta)$
is an eigenvalue of the matrix
 ${\boldsymbol \Phi}(\theta)$
with corresponding eigenvector
 $u(\theta)$
, we have
 $\rho(\theta)u_{\alpha}(\theta)=\left ({\boldsymbol \Phi}(\theta)u(\theta)\right )_{\alpha}=\sum_\beta p_{\alpha\beta}\textrm{e}^{\theta f(\beta)}u_\beta(\theta)$
.
When differentiating the previous relation with respect to  $\theta$
we obtain
 \[\frac{\textrm{d}}{\textrm{d} \theta}(\rho (\theta)u_\alpha(\theta))=\sum_\beta p_{\alpha\beta} (\,f(\beta)\textrm{e}^{\theta f(\beta)}u_\beta(\theta)+\textrm{e}^{\theta f(\beta)}u^{\prime}_{\beta}(\theta) ).\]
We have  $\rho(0)=1$
and
 $u(0)=^t(1/r,\dots,1/r)$
. For
 $\theta=0$
we then get
 \begin{equation}\hspace*{-8pt}\sum_\alpha \pi_{\alpha} \frac{\textrm{d}}{\textrm{d} \theta}(\rho (\theta)u_\alpha(\theta)) \bigg |_{\theta=0} =\frac{1}{r}\textrm{E}[\,f(A)]+\sum_{\alpha,\beta}\pi_{\alpha} p_{\alpha\beta}u^{{\prime}}_{\beta}(0)=\frac{1}{r}\textrm{E}[\,f(A)]+\sum_{\beta}\pi_{\beta}u^{\prime}_{\beta}(0).\end{equation}
On the other hand,
 \[ \sum_\alpha \pi_{\alpha} \frac{\textrm{d}}{\textrm{d} \theta}(\rho (\theta)u_\alpha(\theta))=\frac{\textrm{d}}{\textrm{d} \theta}\bigg(\sum_\alpha \pi_{\alpha} \rho (\theta)u_\alpha(\theta)\bigg) =\rho'(\theta)\sum_\alpha \pi_{\alpha} u_\alpha(\theta)+\rho(\theta)\sum_\alpha \pi_{\alpha} u^{\prime}_\alpha(\theta).\]
For  $\theta=0$
we get
 \begin{equation}\sum_\alpha \pi_{\alpha} \frac{\textrm{d}}{\textrm{d} \theta}(\rho (\theta)u_\alpha(\theta)) \bigg |_{\theta=0}=\frac{\rho'(0)}{r}+\rho(0)\cdot\sum_{\alpha}\pi_{\alpha}u^{\prime}_{\alpha}(0).\end{equation}
From (16) and (17) we deduce that  $\frac{\rho'(0)}{r}+\sum_{\alpha}\pi_{\alpha}u^{\prime}_{\alpha}(0)=\frac{1}{r}\textrm{E}[\,f(A)]+\sum_\beta\pi_{\beta}u^{\prime}_{\beta}(0),$
from which the stated result follows easily.
Lemma 3.6. There exists  $n_0\geq 0$
such that for all
 $n\geq n_0$
and for all
 $\alpha \in \mathcal{A}$
we have
 \[\textrm{P}_{\alpha}(S_n\geq 0)\leq \big( \inf_{\theta\in {\mathbb R}^+} \rho(\theta)\big)^n,\quad \text{with } 0 < \inf_{\theta\in {\mathbb R}^+} \rho(\theta)
< 1.\]
Proof. By a large deviation principle for additive functionals of Markov chains (see Theorem 3.1.2 in [Reference Dembo and Karlin3]) we have  $ \limsup_{n\rightarrow +\infty}\frac{1}{n}\log\left ( \textrm{P}_{\alpha}\left(\frac{S_n}{n} \in \Gamma\right)\right)\leq -\mathcal{I},$
with
 $\Gamma=[0,+\infty )$
and
 $\mathcal{I}=\inf_{x\in \bar{\Gamma}} \sup_{\theta\in{\mathbb R}} (\theta x-\log \rho(\theta))$
. Since
 $\mathcal A$
is finite, it remains to prove that
 $\mathcal{I}>0$
.
For every  $x \geq 0$
, let us denote
 $g_x(\theta)\coloneqq \theta x-\log \rho(\theta)$
and
 $I(x)\coloneqq \sup_{\theta\in{\mathbb R}} g_x(\theta)$
. We will first show that
 $I(x)=\sup_{\theta\in{\mathbb R}^+} g_x(\theta)$
. Indeed, we have
 ${g_x}'(\theta)= x - \rho'(\theta)/\rho(\theta)$
. By the strict convexity property of
 $\rho$
(see [Reference Dembo and Karlin3, Reference Karlin and Ost10]) and the fact that
 $\rho '(0)=\textrm{E}[\,f(A)]<0$
(by Lemma 3.5), we deduce that
 $\rho'(\theta)<0$
for every
 $\theta \leq 0$
, implying that
 ${g_x}'(\theta)> x \geq 0$
for
 $\theta \leq 0$
. The function
 $g_x$
is therefore increasing on
 ${\mathbb R}^-$
, and hence
 $I(x)=\sup_{\theta\in{\mathbb R}^+} g_x(\theta)$
. As a consequence, we deduce that
 $x \mapsto I(x)$
is non-decreasing on
 ${\mathbb R}^+$
. We thus obtain
 $\mathcal{I}=\inf_{x\in {\mathbb R}^+}I(x)=I(0)$
.
Further, we have  $I(0)=\sup_{\theta\in{\mathbb R}} ({-}\log \rho(\theta))=-\inf_{\theta\in {\mathbb R}^+} \log(\rho(\theta))$
. Again using the fact that
 $\rho'(0)<0$
(Lemma 3.5), the strict convexity of
 $\rho$
, and the fact that
 $\rho(0)=\rho(\theta^*)=1$
, we finally obtain
 $\mathcal{I}=-\log(\inf_{\theta\in {\mathbb R}^+} \rho(\theta)) >-\log \rho(0)=0$
.
Lemma 3.7.  $\textrm{E}_\alpha[K_1] < \infty$
for every
 $\alpha \in \mathcal{A}$
.
Proof. Note that  $\textrm{P}_\alpha(K_1>n)\leq\textrm{P}_\alpha(S_n\geq 0)$
. With
 $n_0 \in \mathbb{N}$
defined in Lemma 3.6, using a well-known alternative formula for the expectation we get
 \[\textrm{E}_\alpha[K_1]=\sum_{n\geq 0}\textrm{P}_\alpha(K_1>n)\leq\sum_{n\geq 0}\textrm{P}(S_n\geq 0)\leq C + \sum_{n\geq n_0}\big( \inf_{\theta\in {\mathbb R}^+} \rho(\theta)\big)^n,\]
where  $C >0$
is a constant and
 $0 < \inf_{\theta\in {\mathbb R}^+} \rho(\theta) < 1$
. The statement follows easily.
Lemma 3.8. The sequence  $\big(\frac{K_m}{m}\big)_{m \geq 1}$
converges a.s. when
 $m \to \infty$
. Therefore,
 $ A^* \coloneqq \lim_{m \to \infty} \frac{K_m}{m}$
appearing in the statement of Theorem 2.4 is well defined. Moreover, we have
 $A^* = \sum_{\beta} z_\beta \textrm{E}_\beta[K_1]$
a.s.
Proof. Recall that  $K_1 = \sigma^-$
. We can write
 \begin{align}\frac{K_m}{m} = \frac{K_1}{m} + \frac{1}{m}\sum_{i=2}^m (K_i - K_{i-1}) = \frac{K_1}{m} + \sum_\beta \frac{1}{m}\sum_{i=2}^m (K_i - K_{i-1}) \textbf{1}_{\{A_{K_{i-1}}=\beta\}}.\\[-20pt]\nonumber\end{align}
First note that  $\frac{K_1}{m} \to 0$
a.s. when
 $m \to \infty$
, since
 $K_1 < +\infty$
a.s. By the strong Markov property we have that, conditionally on
 $(A_{K_{i-1}})_{i \geq 2}$
, the random variables
 $(K_i-K_{i-1})_{i \geq 2}$
are all independent, the distribution of
 $K_i-K_{i-1}$
depends only on
 $A_{K_{i-1}}$
, and
 $\textrm{P}(K_i-K_{i-1}=\ell\ \mid A_{K_{i-1}} = \alpha) = \textrm{P}_\alpha(K_1 = \ell)$
. Therefore, the couples
 $Y_i \coloneqq (A_{K_{i-1}}, K_i-K_{i-1})$
,
 $i \geq 2$
, form a Markov chain on
 $\mathcal{A}^- \times \mathbb{N}$
with transition probabilities
 $\textrm{P}(Y_i = (\beta,\ell) \mid Y_{i-1} = (\alpha,k)) = q_{\alpha \beta} \textrm{P}_\beta(K_1 = \ell)$
. Recall that the restriction
 $\tilde{\mathbf{Q}}$
of the matrix Q to the subset
 $\mathcal{A}^-$
is irreducible. Since z is invariant for Q, we easily deduce that
 $\sum_{\alpha,k} \pi(\alpha,k) \cdot q_{\alpha \beta} \textrm{P}_{\beta}(K_1=\ell) = \pi(\beta,\ell),$
and hence the Markov chain
 $(Y_i)_i$
is also irreducible, with invariant distribution
 $\pi(\alpha,k)\coloneqq z_\alpha \textrm{P}_\alpha(K_1 = k)$
.
For fixed  $\beta$
, by applying the ergodic theorem to the Markov chain
 $(Y_i)_i$
and to the function
 $\varphi_\beta(\alpha, k) \coloneqq k \textbf{1}_{\{\alpha=\beta\}}$
we deduce that
 \[\frac{1}{m}\sum_{i=2}^m (K_i - K_{i-1}) \textbf{1}_{\{A_{K_{i-1}}=\beta\}} \underset{m \to \infty}{\longrightarrow} \sum_{\alpha,k} \varphi_\beta(\alpha,k)\pi(\alpha,k) = z_\beta \textrm{E}_\beta(K_1) \ \text{a.s.}\]
Taking the sum over  $\beta$
and using (18) gives the result in the statement.
Proof of Theorem 2.4.
Step 1: The proof of this step is partly inspired by [Reference Karlin and Dembo9]. We will prove that for any convergent sequence  $(x_m)_m$
we have
 \begin{align*} \textrm{P}_{\alpha}\bigg(M_{K_m}\leq \frac{\log(m)}{\theta^*}+x_m\bigg) \underset{m\rightarrow\infty}{\sim} \exp\bigg \{-m\sum_{\beta \in \mathcal{A}^-} z_{\beta} \textrm{P}_{\beta}(S^+> \left \lfloor \log(m)/\theta^*+x_m\right\rfloor )\bigg \}\\ \times\exp\bigg \{ m\sum_{k
< 0}\sum_{\gamma \in \mathcal{A}^-} \textrm{P}_{\gamma}\left(S^+> \left \lfloor \log(m)/\theta^*+x_m \right\rfloor -k\right) \cdot\sum_{\beta \in \mathcal{A}^-}z_{\beta}Q^{(k)}_{\beta \gamma} \bigg \}.\end{align*}
Given  $(A_{K_i})_{i \geq 0}$
, the random variables
 $(Q_i)_{i \geq 1}$
are independent and the CDF of
 $Q_i$
is
 $F_{A_{K_{i-1}}A_{K_i}}$
. Therefore, for any
 $y >0$
,
 \begin{align*} \textrm{P}_{\alpha}\left ( M_{K_m}\leq y \right) & = \textrm{E}_\alpha\bigg [ \prod_{i=1}^mF_{A_{K_{i-1}}A_{K_i}}(y)\bigg ] \\[5pt] & = \textrm{E}_\alpha\bigg [ \exp\bigg \{\sum_{\beta,\gamma \in \mathcal{A}} m \psi_{\beta\gamma}(m)\log(F_{\beta\gamma}(y))\bigg \}\bigg ],\end{align*}
with  $\psi_{\beta\gamma}(m)\coloneqq \#\{i\,{:}\,1 \leq i\leq m,\,A_{K_{i-1}}=\beta,\,A_{K_{i}}=\gamma\}/m$
. Given that
 $A_0 = \alpha \in \mathcal{A}^-$
, the
 $(A_{K_i})_{i \geq 0}$
form an irreducible Markov chain on
 $\mathcal{A}^-$
of transition matrix
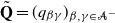 $\tilde{\mathbf{Q}}=(q_{ \beta \gamma})_{\beta, \gamma \in \mathcal{A}^-}$
and stationary frequency vector
 $\tilde z = (z_\beta)_{\beta \in \mathcal{A}^-} > 0$
. Consequently, for
 $\beta, \gamma \in \mathcal{A}^-$
the ergodic theorem implies that
 $\psi_{\beta\gamma}(m)\rightarrow z_{\beta}q_{\beta\gamma}$
a.s. when
 $m\rightarrow\infty$
. On the other hand, for any
 $\alpha \in \mathcal{A}$
, if
 $\beta \in \mathcal{A} \setminus \mathcal{A}^-$
then
 $\psi_{\beta\gamma}(m)$
equals either 0 or
 $1/m$
, and thus
 $\psi_{\beta\gamma}(m)\rightarrow 0$
a.s. when
 $m\rightarrow\infty$
for any
 $\gamma \in \mathcal{A}$
. With
 $z_{\beta} = 0$
for
 $\beta \in \mathcal{A} \setminus \mathcal{A}^-$
, we thus have
 $\psi_{\beta\gamma}(m)\rightarrow z_{\beta}q_{\beta\gamma}$
a.s. when
 $m\rightarrow\infty$
for every
 $\beta, \gamma \in \mathcal{A}$
.
We will use the Taylor series expansion of the  $\log$
function. Let us define
 \[ d_{\beta\gamma}(m)\coloneqq m\left[1-F_{\beta\gamma}\left(\frac{\log(m)}{\theta^*}+x_m\right)\right] \quad \text{for every } m \geq 1.\]
Thanks to Lemma 3.4, the  $d_{\beta\gamma}(m)$
are uniformly bounded in m,
 $\beta$
, and
 $\gamma$
. Since
 \hbox{$0{\leq}\psi_{\beta\gamma}(m){\leq}1$}
, we obtain
 \begin{eqnarray*}\textrm{P}_{\alpha}\left(M_{K_m}\leq\frac{\log(m)}{\theta^*}+x_m\right)&\,\underset{m\rightarrow\infty}{\sim}\,& \textrm{E}_{\alpha}\bigg [\exp\bigg({-}\sum_{\beta,\gamma \in \mathcal{A}}\psi_{\beta\gamma}(m)d_{\beta\gamma}(m)\bigg )\bigg ] \\ &\underset{m\rightarrow\infty}{\sim}\,& \exp\bigg({-}\sum_{\beta,\gamma \in \mathcal{A}}z_{\beta}q_{\beta\gamma}d_{\beta\gamma}(m)\bigg ).\end{eqnarray*}
Since
 \begin{align*}&\sum_{\gamma \in \mathcal{A}}q_{\beta\gamma}d_{\beta\gamma}(m)=m\bigg[1-F_{\beta}\left(\frac{\log(m)}{\theta^*}+x_m\right)\bigg],\\[4pt] &\quad \textrm{P}_{\alpha}\left(M_{K_m}\leq \frac{\log(m)}{\theta^*}+x_m\right)\underset{m\rightarrow\infty}{\sim} \exp \bigg({-}m \sum_{\beta \in \mathcal{A}^-} z_{\beta}\left [1-F_{\beta}\left(\frac{\log(m)}{\theta^*}+x_m\right )\right]\bigg).\end{align*}
But
 \[1-F_{\beta}\bigg(\frac{\log(m)}{\theta^*}+x_m\bigg)=\textrm{P}_{\beta}\bigg(Q_1> \frac{\log(m)}{\theta^*}+x_m\bigg)=\textrm{P}_{\beta}\left(Q_1> \left \lfloor \log(m)/\theta^*+x_m\right\rfloor \right),\]
and using Theorem 2.3 we get
 \begin{align*} &1 -F_{\beta} \left (\frac{\log(m)}{\theta^*} +x_m\right ) \underset{m\rightarrow\infty}{\sim}\textrm{P}_{\beta}\left(S^+> \left \lfloor\log(m)/\theta^*+x_m\right\rfloor \right)\\[3pt] & \quad -\sum_{k
< 0}\sum_{\gamma \in \mathcal{A}^-} \textrm{P}_{\gamma}\left(S^+> \left \lfloor\log(m)/\theta^*+x_m\right\rfloor -k\right) \cdot Q^{(k)}_{\beta \gamma}.\end{align*}
This then leads to
 \begin{align*} \textrm{P}_{\alpha}\left(M_{K_m}\leq \frac{\log(m)}{\theta^*}+x_m\right)\underset{m\rightarrow\infty}{\sim}\exp\bigg \{-m\sum_{\beta \in \mathcal{A}^-} z_{\beta} \textrm{P}_{\beta}\left(S^+> \left \lfloor\log(m)/\theta^*+x_m\right\rfloor \right)\bigg \}\\[4pt] \times\exp\bigg \{m\sum_{k
< 0}\sum_{\gamma \in \mathcal{A}^-} \textrm{P}_{\gamma}\left(S^+> \left \lfloor\log(m)/\theta^*+x_m\right\rfloor -k\right) \cdot\sum_{\beta \in \mathcal{A}^-}z_{\beta}Q^{(k)}_{\beta \gamma}\bigg \}.\end{align*}
Step 2: We now deduce the stated asymptotic equivalent for the distribution of  $M_n$
. Since going from the distribution of
 $M_{K_m}$
to the distribution of
 $M_n$
is more delicate in our case than in [Reference Karlin and Dembo9], we present the proof of this step in detail.
Let  $x \in {\mathbb R}$
. Since
 $K_{m(n)} \leq n \leq K_{m(n)+1}$
and
 $(M_n)_n$
is non-decreasing, we have
 \begin{align}\textrm{P}_{\alpha}\left(M_{K_{m(n)+1}}\leq \frac{\log(n)}{\theta^*}+x \right ) & \leq \textrm{P}_{\alpha}\left(M_n\leq \frac{\log(n)}{\theta^*}+x\right ) \nonumber \\ & \leq \textrm{P}_{\alpha}\left(M_{K_{m(n)}}\leq \frac{\log(n)}{\theta^*}+x \right)\!.\end{align}
Since  $m(n) \rightarrow \infty$
a.s., Lemma 3.8 implies that
 $\frac{m(n)}{n} \rightarrow \frac{1}{A^*}$
a.s., with
 $A^*=\lim_{m\to \infty} \frac{K_m}{m}$
.
Now fix  $\varepsilon > 0$
. We have
 \begin{align}& \textrm{P}_{\alpha}\left(M_{K_{m(n)}}\leq \frac{\log(n)}{\theta^*}+x \right ) \nonumber \\[3pt] &\leq \textrm{P}_{\alpha}\bigg(M_{K_{m(n)}}\leq \frac{\log(n)}{\theta^*}+x, \, \bigg\lvert \frac{m(n)}{n} - \frac{1}{A^*} \bigg\lvert \leq \varepsilon \bigg ) + \textrm{P}_{\alpha}\bigg(\bigg\lvert \frac{m(n)}{n} - \frac{1}{A^*}\bigg\lvert > \varepsilon \bigg ) \nonumber \\[3pt] &\leq \textrm{P}_{\alpha}\bigg(M_{K_{\lceil n/A^*- n \varepsilon \rceil}}\leq \frac{\log(n)}{\theta^*}+x\bigg )+ \textrm{P}_{\alpha}\bigg(\bigg\lvert \frac{m(n)}{n} - \frac{1}{A^*}\bigg\lvert > \varepsilon \bigg ).\end{align}
Using the result of Step 1, we obtain
 \begin{equation} \displaystyle \frac{\textrm{P}_{\alpha}\left(M_{K_{\lceil n/A^*- n \varepsilon \rceil}}\leq \frac{\log(n)}{\theta^*}+x\right )}{E_n} \underset{n\rightarrow\infty}{\sim}R_n(\varepsilon),\end{equation}
where  $E_n$
is the asymptotic equivalent given in the statement
 \begin{align*} &E_n \coloneqq \exp\bigg \{-\frac{n}{A^*}\sum_{\beta \in \mathcal{A}^-} z_{\beta} \textrm{P}_{\beta}\left (S^+> \left \lfloor\log(n)/\theta^*+x\right\rfloor \right )\bigg \}\\[4pt] & \qquad\qquad\,\,\,\times\exp\bigg \{ \frac{n}{A^*}\sum_{k
< 0}\sum_{\gamma \in \mathcal{A}^-} \textrm{P}_{\gamma}\left(S^+>\left \lfloor\log(n)/\theta^*+x\right\rfloor -k\right) \cdot\sum_{\beta \in \mathcal{A}^-}z_{\beta}Q^{(k)}_{\beta \gamma}\bigg \} ,\end{align*}
and
 \begin{align*} R_n(\varepsilon) &\coloneqq \exp\bigg \{\varepsilon \cdot n \sum_{\beta \in \mathcal{A}^-} z_{\beta} \textrm{P}_{\beta}\left (S^+> \left \lfloor\log(n)/\theta^*+x\right\rfloor \right )\bigg \}\\[3pt] &\quad \times\exp\bigg \{ -\varepsilon \cdot n\sum_{k
< 0}\sum_{\gamma \in \mathcal{A}^-} \textrm{P}_{\gamma}\left(S^+>\left \lfloor\log(n)/\theta^*+x\right\rfloor -k\right) \cdot\sum_{\beta \in \mathcal{A}^-}z_{\beta}Q^{(k)}_{\beta \gamma}\bigg \}.\end{align*}
Using Theorem 2.2 we obtain
 \begin{equation}\limsup_{n \to \infty} R_n(\varepsilon) \leq \exp\{ \varepsilon \cdot c(\infty) \textrm{e}^{-\theta^*x} D^* \},\end{equation}
with
 \[D^*\coloneqq \textrm{e}^{\theta^*}\sum_{\beta \in \mathcal{A}^-}z_{\beta}u_\beta(\theta^*) - \sum_{\beta, \gamma \in \mathcal{A}^-}z_{\beta}u_\gamma(\theta^*) \sum_{k
< 0} \textrm{e}^{k\theta^*}Q^{(k)}_{\beta \gamma}.\]
Equations (19)–(22), together with the fact that  $ \frac{m(n)}{n} \rightarrow \frac{1}{A^*}$
a.s., imply that
 \begin{equation}\limsup_{n \to \infty} \displaystyle \frac{\textrm{P}_{\alpha}\left(M_n \leq \frac{\log(n)}{\theta^*}+x \right )}{E_n} \leq \exp\{ \varepsilon \cdot c(\infty) \textrm{e}^{-\theta^*x} D^* \}.\end{equation}
In a similar manner, we can show that
 \begin{equation}\liminf_{n \to \infty} \displaystyle \frac{\textrm{P}_{\alpha}\left(M_n \leq \frac{\log(n)}{\theta^*}+x \right )}{E_n} \geq \exp\{- \varepsilon \cdot c(\infty) \textrm{e}^{-\theta^*x} G^* \},\end{equation}
with
 \[G^*\coloneqq \sum_{\beta \in \mathcal{A}^-}z_{\beta}u_\beta(\theta^*) -\textrm{e}^{\theta^*} \sum_{\beta, \gamma \in \mathcal{A}^-}z_{\beta}u_\gamma(\theta^*) \sum_{k
< 0} \textrm{e}^{k\theta^*}Q^{(k)}_{\beta \gamma}.\]
Taking the limit  $\varepsilon \to 0$
in (23) and (24) gives
 \[1 \leq \liminf_{n \to \infty} \displaystyle \frac{\textrm{P}_{\alpha}\left(M_n\leq \frac{\log(n)}{\theta^*}+x \right )}{E_n}\leq \limsup_{n \to \infty} \displaystyle \frac{\textrm{P}_{\alpha}\left(M_n\leq \frac{\log(n)}{\theta^*}+x \right )}{E_n} \leq 1,\]
and hence  $\textrm{P}_{\alpha}\big(M_n\leq \frac{\log(n)}{\theta^*}+x \big ) \underset{n\rightarrow\infty}{\sim} E_n,$
with
 $E_n$
the asymptotic equivalent given in the statement.
Step 3: The last step is to prove the stated expression for  $A^*$
. Recall that
 $\sigma^- = K_1$
. In Lemma 3.8 we proved that
 $A^* = \sum_{\alpha} z_{\alpha}\textrm{E}_\alpha(\sigma^-)$
. Let
 $n \in \mathbb{N}$
. By applying the optional sampling theorem to the martingale
 $(U_m(\theta))_m$
and to the bounded stopping time
 $\min(\sigma^-,n)$
, we get
 $\textrm{E}_{\alpha}\left [U_{\min(\sigma^-,n)}(\theta)\right ]=\textrm{E}_{\alpha}\left [U_0(\theta)\right ]=1.$
Furthermore, we have
 \begin{equation}1 = \textrm{E}_{\alpha}\left [U_{\sigma^-}(\theta);\, \sigma^- \leq n \right ] + \textrm{E}_{\alpha}\left [U_{n}(\theta);\, \sigma^- > n \right ].\end{equation}
We will show that  $ \textrm{E}_{\alpha}\left [U_{n}(\theta);\, \sigma^- > n \right ] \rightarrow 0$
when
 $n \to \infty$
. It suffices to prove that
 \[ \textrm{E}_{\alpha}\left [\frac{\textrm{e}^{\theta S_n}}{\rho(\theta)^n};\, \sigma^- > n \right ] \rightarrow 0.\]
By the Cauchy–Schwartz inequality, we have
 \[\textrm{E}_{\alpha}\left [\frac{\textrm{e}^{\theta S_n}}{\rho(\theta)^n};\ \sigma^- > n \right ] \leq \left(\textrm{E}_{\alpha}\left[\textrm{e}^{2\theta S_n}\right]\right)^{1/2}\left( \frac{\textrm{P}_\alpha(\sigma^- > n)}{\rho(\theta)^{2n}}\right)^{1/2}.\]
Further, using Theorem 2.2 we can easily see that  $\textrm{E}_{\alpha}[\textrm{e}^{2\theta S^+}] < \infty$
if
 $ 0 \leq \theta < \frac{\theta^*}{2}$
. Moreover, by Lemma 3.6 we have
 $\textrm{P}_\alpha(\sigma^- > n) \leq \textrm{P}_\alpha(S_n \geq 0) \leq ( \inf_{\tilde{\theta}\in {\mathbb R}^+} \rho(\tilde{\theta}))^n.$
Since  $\rho(\theta) \to 1$
when
 $\theta \to 0$
, for sufficiently small
 $\theta$
we will have both
 $ \theta < \frac{\theta^*}{2}$
and
 $\rho(\theta)^2 > \inf_{\theta\in {\mathbb R}^+} \rho(\theta)$
, implying that
 \[ \textrm{E}_{\alpha}\left [\frac{\textrm{e}^{\theta S_n}}{\rho(\theta)^n};\, \sigma^- > n \right ] \rightarrow 0 \qquad \text{when } n \to \infty.\]
When passing to the limit as  $n \to \infty$
in (25), we deduce that for
 $\theta$
sufficiently small we have
 $\textrm{E}_{\alpha}\left [U_{\sigma^-}(\theta)\right ]=\textrm{E}_{\alpha}\left [U_0(\theta)\right ]=1.$
Consequently,
 \begin{align*}1&= \textrm{E}_{\alpha}\bigg [\exp(\theta\cdot S_{\sigma^-})\frac{u_{A_{\sigma^-}}(\theta)}{u_{A_{0}}(\theta)}\frac{1}{\rho(\theta)^{\sigma^-}}\bigg ]=\textrm{E}_{\alpha}\left [\exp(\theta\cdot S_{\sigma^-})\frac{u_{A_{\sigma^-}}(\theta)}{u_{\alpha}(\theta)}\frac{1}{\rho(\theta)^{\sigma^-}}\right ]\\[4pt] &= \sum_{\beta}\textrm{E}_{\alpha}\left [\exp(\theta\cdot S_{\sigma^-})\frac{u_{\beta}(\theta)}{u_{\alpha}(\theta)}\frac{1}{\rho(\theta)^{\sigma^-}}\mid A_{\sigma^-}=\beta\right ]\cdot \textrm{P}_{\alpha}(A_{\sigma^-}=\beta)\\[4pt] &= \sum_{\beta}\frac{u_{\beta}(\theta)}{u_{\alpha}(\theta)}\textrm{E}_{\alpha}\left [\frac{\exp(\theta\cdot S_{\sigma^-})}{\rho(\theta)^{\sigma^-}} \mid A_{\sigma^-}=\beta\right ]\cdot q_{\alpha\beta}.\end{align*}
We deduce that for  $\theta$
sufficiently small we have
 \[u_{\alpha}(\theta)=\sum_{\beta}\textrm{E}_{\alpha}\left [\frac{\exp(\theta\cdot S_{\sigma^-})}{\rho(\theta)^{\sigma^-}}\mid A_{\sigma^-}=\beta \right ]\cdot u_{\beta}(\theta)q_{\alpha\beta} .\]
For  $\theta$
sufficiently small, by differentiating the above relation we obtain
 \begin{align*} &u^{\prime}_{\alpha}(\theta)=\\ &\sum_{\beta}q_{\alpha\beta} u_{\beta}(\theta)\textrm{E}_{\alpha}\bigg[ \frac{S_{\sigma^{-}}\exp(\theta\cdot S_{\sigma^-})\rho(\theta)^{\sigma^{-}}-\exp(\theta\cdot S_{\sigma^{-}})\sigma^-\rho(\theta)^{\sigma^--1}\rho'(\theta)}{\rho(\theta)^{2\sigma^-}} \mid A_{\sigma^-}=\beta\bigg] \\ &\quad\qquad\qquad\qquad + \sum_{\beta}q_{\alpha\beta} u^{\prime}_{\beta}(\theta)\textrm{E}_{\alpha}\left [\frac{\exp(\theta\cdot S_{\sigma^-})}{\rho(\theta)^{\sigma^-}}\mid A_{\sigma^-}=\beta \right ].\end{align*}
Since  $\rho(0)=1$
, we obtain, for
 $\theta = 0$
,
 \[u^{\prime}_{\alpha}(0)=\sum_{\beta}q_{\alpha\beta}u_{\beta}(0)\left ( \textrm{E}_{\alpha}\left [ S_{\sigma^-}\mid A_{\sigma^-}=\beta\right ]- \rho'(0)\textrm{E}_{\alpha}\left [ \sigma^-\mid A_{\sigma^-}=\beta\right ]\right ) + \sum_{\beta}q_{\alpha\beta}u^{\prime}_{\beta}(0).\]
Because  $u(0)=^t(1/r,\ldots,1/r)$
, we further get
 \[u^{\prime}_{\alpha}(0)=\frac{1}{r}\textrm{E}_{\alpha}[S_{\sigma^-}]-\frac{\rho'(0)}{r} \textrm{E}_\alpha[\sigma^-]+ \sum_{\beta}q_{\alpha\beta}u^{\prime}_{\beta}(0).\]
From the last relation we deduce that
 \begin{equation}\sum_{\alpha}z_{\alpha}u^{\prime}_{\alpha}(0)=\frac{1}{r}\sum_{\alpha}z_{\alpha}\textrm{E}_{\alpha}\left [ S_{\sigma^-}\right ]-\frac{\rho'(0)}{r}\sum_{\alpha} z_{\alpha}\textrm{E}_\alpha[\sigma^-] +\sum_{\alpha}\sum_{\beta}z_{\alpha} q_{\alpha\beta}u^{\prime}_{\beta}(0).\end{equation}
On the other hand, since z is invariant for Q, we obtain
 \begin{equation}\sum_{\alpha}z_{\alpha}u^{\prime}_{\alpha}(0)=^tz \cdot u'(0)=^t(z {\bf Q}) \cdot u'(0)=\sum_{\beta} {^t(z {\bf Q})_{\beta}}\cdot u^{\prime}_{\beta}(0)=\sum_{\beta}\sum_{\alpha} z_{\alpha} q_{\alpha\beta} u^{\prime}_{\beta}(0).\end{equation}
Equations (26) and (27) imply that  $\sum_{\alpha}z_{\alpha}\textrm{E}_{\alpha}\left [ S_{\sigma^-}\right ]=\rho'(0)\cdot\sum_{\alpha} z_{\alpha} \textrm{E}_\alpha[\sigma^-]$
, and thus
 $A^*=\sum_{\alpha} z_{\alpha} \textrm{E}_\alpha[\sigma^-]=\frac{1}{\rho'(0)}\sum_{\alpha}z_{\alpha}\textrm{E}_{\alpha}\left [ S_{\sigma^-}\right ]$
. Using the fact that
 $\rho'(0)=\textrm{E}[\,f(A)]$
(see Lemma 3.5) gives the stated expression for
 $A^*$
.
4. Applications and computational methods
Let  $-u,\dots,0,\dots,v$
be the possible scores, with
 $u, v \in \mathbb{N}$
. For
 $-u \leq j \leq v$
, we introduce the matrix
 ${\bf P^{(\,j)}}$
with entries
 $P^{(\,j)}_{\alpha \beta} \coloneqq \textrm{P}_{\alpha}(A_1=\beta,\, f(A_{1})= j)$
for
 $\alpha, \beta \in \mathcal{A}$
. Note that
 $ P^{(\,f(\beta))}_{\alpha\beta}=p_{\alpha\beta}$
,
 $P^{(\,j)}_{\alpha\beta}=0$
if
 $j\neq f(\beta)$
, and
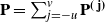 ${\bf P}=\sum_{j=-u}^{v}{\bf P^{(\,j)}}$
, where
 ${\bf P}=(p_{\alpha \beta})_{\alpha, \beta}$
is the transition probability matrix of the Markov chain
 $(A_i)_i$
.
In order to obtain the asymptotic result on the tail distribution of  $Q_1$
given in Theorem 2.3, we need to compute the quantities
 $Q^{(\ell)}_{\alpha \beta}$
for
 $-u \leq \ell \leq v$
,
 $\alpha, \beta \in \mathcal{A}$
. This is the topic of the next subsection. We denote by
 ${\bf Q^{(\ell)}}$
the matrix
 $(Q^{(\ell)}_{\alpha \beta})_{\alpha, \beta \in \mathcal{A}}$
.
4.1. Computation of
$\mathbf{Q}^{(\ell)}$
for
$-u \leq \ell \leq v$
, and of Q


Recall that  $Q^{(\ell)}_{\alpha \beta}=\textrm{P}_\alpha(S_{\sigma^-} = \ell,\, A_{\sigma^-} = \beta)$
, and hence
 $Q^{(\ell)}_{\alpha \beta}=0$
if
 $\ell\geq 0$
or
 $\beta \in \mathcal{A} \setminus \mathcal{A}^-$
. Note also that
 $\sigma^-=1$
if
 $f(A_1) < 0$
. Let
 $-u \leq \ell \leq -1$
. Decomposing with respect to the possible values j of
 $f(A_{1})$
, we obtain
 \begin{align*} Q^{(\ell)}_{\alpha \beta} &= \textrm{P}_\alpha( A_{1} = \beta,\, f(A_1) = \ell) + \textrm{P}_{\alpha}(S_{\sigma^-} = \ell ,\, A_{\sigma^-} = \beta, f(A_1) = 0) \\[3pt] &\quad + \sum_{j = 1}^{v} \textrm{P}_{\alpha}(S_{\sigma^-} = \ell ,\, A_{\sigma^-} = \beta, f(A_{1}) = j).\end{align*}
Note that the first term on the right-hand side is exactly  $P^{(\ell)}_{\alpha \beta}$
defined at the beginning of this section. We further have, by the law of total probability and the Markov property,
 \begin{align*} \textrm{P}_\alpha(S_{\sigma^-} = \ell , A_{\sigma^-} = \beta, f(A_1) = 0)&= \sum_{\gamma} P^{(0)}_{\alpha \gamma} \textrm{P}_\alpha(S_{\sigma^-} = \ell , A_{\sigma^-} = \beta \mid A_1 = \gamma, f(A_1) = 0) \\[3pt] &= \sum_{\gamma} P^{(0)}_{\alpha \gamma} \, \textrm{P}_\gamma(S_{\sigma^-} = \ell ,\, A_{\sigma^-} = \beta)=( {\bf P^{(0)}}{\bf Q^{(\ell)}})_{\alpha \beta}.\end{align*}
Let  $j \in \{1,\ldots,v\}$
be fixed. We have
 \begin{align*}\textrm{P}_\alpha(S_{\sigma^-} &= \ell , A_{\sigma^-} = \beta, f(A_1) = j)= \sum_{\gamma} P^{(\,j)}_{\alpha \gamma} \textrm{P}_\alpha(S_{\sigma^-} = \ell , A_{\sigma^-} = \beta \mid A_1 = \gamma, f(A_1) = j).\end{align*}
For every possible  $s \geq 1$
, we denote by
 $\mathcal{T}_s$
the set of all possible s-tuples
 $t=(t_1,\dots,t_s)$
satisfying
 $-u\leq t_i\leq -1$
for
 $i=1,\dots, s$
,
 $ t_1+\dots+t_{s-1}\geq -j >0$
, and
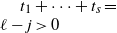 $t_1+\dots+t_{s}=\break \ell-j >0$
. Decomposing over all the possible paths from
 $-j$
to
 $\ell$
gives
 \[Q^{(\ell)}_{\alpha \beta}= P^{(\ell)}_{\alpha \beta}+({\bf P^{(0)}} {\bf Q^{(\ell)}})_{\alpha \beta}+\sum_{j=1}^v\bigg ( {\bf P^{(\,j)}} \sum_s \sum_{t\in\mathcal{T}_s}\prod_{i=1}^s {\bf Q^{(t_i)}}\bigg)_{\alpha \beta},\]
hence
 \begin{equation*}{\bf Q^{(\ell)}}= {\bf P^{(\ell)}}+{\bf P^{(0)}} {\bf Q^{(\ell)}}+\sum_{j=1}^v {\bf P^{(\,j)}}\sum_s \sum_{t\in\mathcal{T}_s}\prod_{i=1}^s {\bf Q^{(t_i)}}.\end{equation*}
Recalling that  ${\bf Q}=(q_{\alpha\beta})_{\alpha, \beta}$
with
 $q_{\alpha\beta}=\textrm{P}_{\alpha}(A_{\sigma^-}=\beta)=\sum_{\ell<0}Q^{(\ell)}_{\alpha \beta}$
, we have
 \begin{equation*}{\bf Q}=\sum_{\ell <0}{\bf Q^{(\ell)}}.\end{equation*}
Example 1. In the case where  $u=v=1$
, we only have the possible values
 $\ell=-1$
,
 $j=1$
,
 $s=2$
, and
 $t_1=t_2=-1$
, thus
 \begin{equation}{\bf Q^{({-}1)}}={\bf P^{({-}1)}}+{\bf P^{(0)}}\cdot {\bf Q^{({-}1)}}+{\bf P^{(1)}}({\bf Q^{({-}1)}})^2\quad\mbox{ and } {\bf Q}={\bf Q^{({-}1)}}.\end{equation}
4.2. Computation of
$L_{\alpha \beta}^{(\ell)}$
for
$0 \leq \ell \leq v$
, and of
$L_{\alpha}(\infty)$


Recall that  $L_{\alpha \beta}^{(\ell)}=\textrm{P}_\alpha(S_{\sigma^+} = \ell ,\,\sigma^+ < \infty, \, A_{\sigma^+} = \beta)$
. Denote
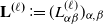 ${\bf L^{(\ell)}}\coloneqq (L^{(\ell)}_{\alpha\beta})_{\alpha,\beta}$
. First note that
 $L_{\alpha \beta}^{(\ell)}=0$
for
 $\ell\leq0$
or
 $\beta \in \mathcal{A} \setminus \mathcal{A}^+ $
. Using a similar method to that used to obtain
 $Q^{(\ell)}_{\alpha \beta}$
in the previous subsection, we denote, for every possible
 $s \geq 1$
,
 $\mathcal{T}^{\prime}_s$
as the set of all s-tuples
 $t=(t_1,\dots,t_s)$
satisfying
 $1\leq t_i\leq v$
for
 $i=1,\dots, s$
,
 $ t_1+\dots+t_{s-1}\leq k$
, and
 $t_1+\dots+t_{s}=\ell+k >0$
.
For every  $0<\ell\leq v$
we then have
 \begin{equation}{\bf L^{(\ell)}}= {\bf P^{(\ell)}}+{\bf P^{(0)}} {\bf L^{(\ell)}}+\sum_{k=1}^u {\bf P^{({-}k)}}\sum_s \sum_{t\in\mathcal{T}^{\prime}_s}\prod_{i=1}^s {\bf L^{(t_i)}}.\end{equation}
Since  $L_{\alpha}(\infty)=\textrm{P}_{\alpha}(\sigma^+<\infty)=\sum_{\beta}\sum_{\ell =1}^v L_{\alpha \beta}^{(\ell )}$
, and denoting by
 ${\bf L}(\infty)$
the column vector containing all
 $L_{\alpha}(\infty)$
for
 $\alpha \in \mathcal{A}$
, and by
 $\mathbf{1}_r$
the column vector of size r with all components equal to 1, we can write
 \begin{equation*}{\bf L}(\infty)=\sum_{\ell=1}^v {\bf L^{(\ell)}}\cdot \mathbf{1}_r.\end{equation*}
Example 2. In the case where  $u=v=1$
, (29) gives
 \begin{align} {\bf L^{(1)}} & = {\bf P^{(1)}}+{\bf P^{(0)}}\cdot {\bf L^{(1)}}+{\bf P^{({-}1)}}\cdot ({\bf L^{(1)}})^2,\\[-25pt] \nonumber\end{align}
 \begin{align}{\bf L^{(\ell)}} & = 0 \mbox{ for } \ell > 1, \mbox{ thus } {\bf L}(\infty)= {\bf L^{(1)}}\cdot \mathbf{1}_r.\end{align}
4.3. Computation of
$F_{S^+,\alpha}{(\ell)}$
for
$\ell \geq 0$


For  $\ell\geq 0$
let us denote
 ${\bf F}_{S^+,\cdot}{(\ell)}\coloneqq (F_{S^+,\alpha}{(\ell)})_{\alpha \in \mathcal{A}}$
, seen as a column vector of size r. From Theorem 2.1 we deduce that for
 $\ell=0$
and every
 $\alpha\in\mathcal{A}$
we have
 $F_{S^+,\alpha}{(0)}=1 - L_{\alpha}(\infty)$
.
For  $\ell=1$
and every
 $\alpha \in \mathcal{A}$
we get
 $F_{S^+,\alpha}{(1)}=1 - L_{\alpha}(\infty) + \sum_{\beta \in \mathcal{A}} L^{(1)}_{\alpha \beta} \ F_{S^+,\beta}{(0)}$
. With
 ${\bf L}(\infty)=(L_{\alpha}(\infty))_{\alpha \in \mathcal{A}}$
, seen as a column vector, we can write
 \begin{align*}{\bf F}_{S^+,\cdot}{(1)}&=1 -{\bf L}(\infty) + {\bf L^{(1)}F}_{S^+,\cdot}{(0)},\\{\bf F}_{S^+,\cdot}{(\ell)}&=1 - {\bf L}(\infty)+\sum_{k=1}^{\ell} {\bf L^{(k)} F}_{S^+,\cdot}{(\ell-k)}, \quad \text{for all } \ell\geq 1.\end{align*}
See Section 4.2 for how to compute  ${\bf L^{(k)}}$
for
 $k \geq 1$
and
 ${\bf L}(\infty)$
.
4.4. Numerical application in a simple case
Let us consider the simple case where the possible score values are  $-1$
, 0, and 1, corresponding to the case
 $u=v=1$
. We will use the results in the previous subsections (see (28, 30, 31)) to derive the distribution of the maximal non-negative partial sum
 $S^+$
. This distribution can be determined using the following matrix equalities:
 \begin{equation*}{\bf L}(\infty)=\bigg ( \sum_{\beta} L^{(1)}_{\alpha\beta}\bigg )_{\alpha}={\bf L^{(1)}}\cdot \mathbf{1}_r,\end{equation*}
with  ${\bf L^{(1)}}$
given in (29) and
 \begin{align*}{\bf F}_{S^+,\cdot}{(0)}&=1-{\bf L}(\infty),\\[3pt] {\bf F}_{S^+,\cdot}{(\ell)} &= 1-{\bf L}(\infty)+{\bf L^{(1)} F}_{S^+,\cdot}{(\ell-1)}. \end{align*}
This allows to further derive the approximation results on the distributions of  $Q_1$
and
 $M_n$
given in Theorems 2.3 and 2.4.
We now present a numerical application for the local score of a DNA sequence. We suppose that we have a Markovian sequence whose possible letters are  $\{A,C,G,T\}$
and whose transition probability matrix is given by
 \[{\bf P}=\left (\begin{array}{c@{\quad}c@{\quad}c@{\quad}c}1/2&1/6&1/6&1/6\\1/4&1/4&1/4&1/4\\1/6&1/6&1/6&1/2\\1/6&1/6&1/2&1/6\\\end{array}\right)\!.\]
We choose the respective scores  $-1$
,
 $-1$
, 0, 1 for the letters A, C, G, T for which Hypotheses (1) and (2) are verified. We use the successive iteration methodology described in (5.12) of [Reference Karlin and Dembo9] in order to compute
 $\bf{L^{(1)}}$
and
 $\bf{Q^{({-}1)}}$
, solutions of (28) and (30), from which we derive the approximate formulas proposed in Theorems 2.1, 2.3, and 2.4 for the distributions of
 $S^+$
,
 $Q_1$
, and
 $M_n$
, respectively. We also compute the different approximations proposed in [Reference Karlin and Dembo9]. We then compare these results with the corresponding empirical distributions computed using a Monte Carlo approach based on
 $10^5$
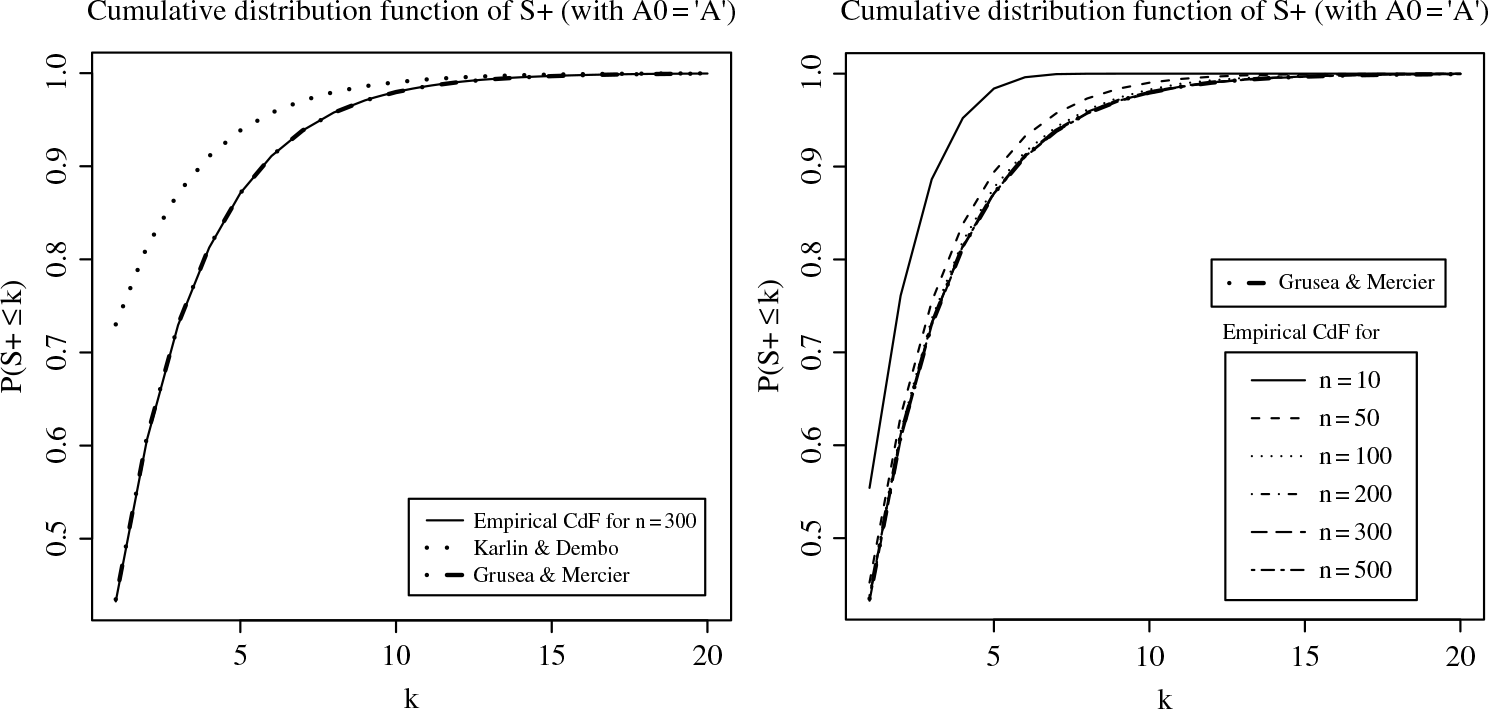
simulations. We can see in the left panel of Figure 1 that for
 $n=300$
the empirical CDF of
 $S^+$
and that obtained using Theorem 2.1 match perfectly. We can also visualize the fact that Theorem 2.1 improves the approximation of Lemma 4.3 of [Reference Karlin and Dembo9] for the distribution of
 $S^+$
(see Theorem 2.2 for the analogous formula in our settings). The right panel of Figure 1 allows us to compare, for different values of the sequence length n, the empirical CDF of
 $S^+$
and the exact CDF given in Theorem 2.1: we can see that our formula performs very satisfactorily in this example, even for the sequence length
 $n=100$
.
Cumulative distribution function of  $S^+$
for the simple scoring scheme
 $({-}1,0,+1)$
and
 $A_0=A$
. Left panel: Comparison between the approximation of [Reference Karlin and Dembo9], a Monte Carlo estimation with sequences of length
 $n=300$
, and the exact formula proposed in Theorem 2.1. Right panel: Comparison, for different values of n, of the Monte Carlo empirical cumulative distribution function and the exact one given in Theorem 2.1.

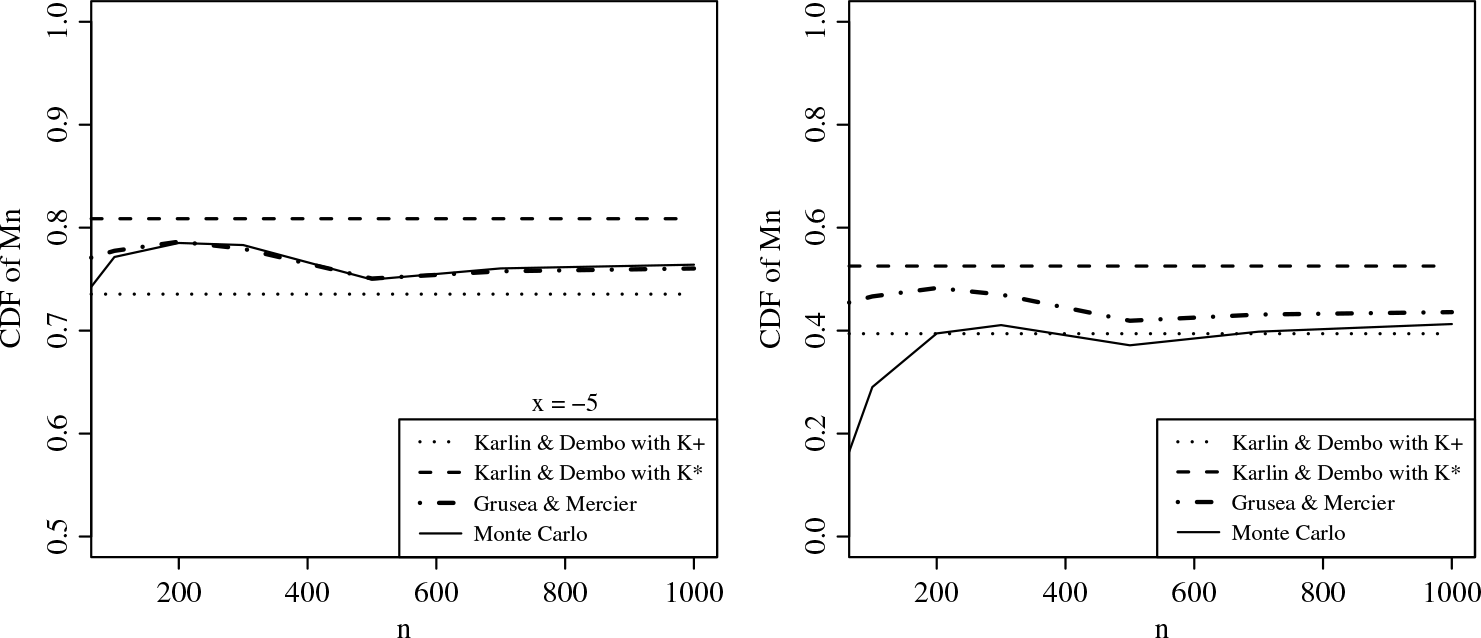
Comparison of the different approximations for  $p(n,x)=\textrm{P}\big(M_n\leq \frac{\log(n)}{\theta^*}+x\big)$
as a function of n, for fixed x and for the simple scoring scheme
 $({-}1,0,+1)$
: the asymptotic lower and upper bounds of [Reference Karlin and Dembo9] (see (6) and (7)), the approximation proposed in Theorem 2.4, and a Monte Carlo estimation. Left panel: p(n, x) for
 $x=-5$
. Right panel: p(n, x) for
 $x=-8$
.

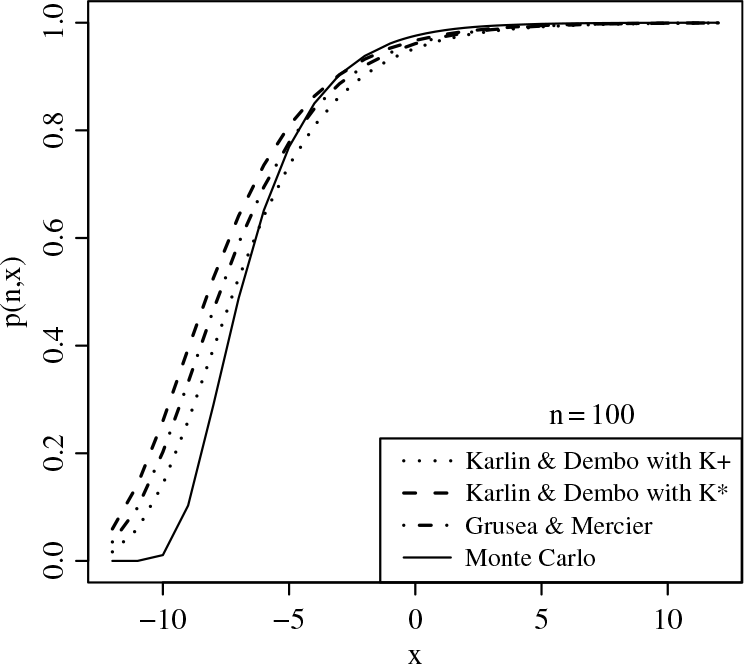
Comparison of the different approximations for  $p(n,x)=\textrm{P}\big(M_n\leq \frac{\log(n)}{\theta^*}+x\big)$
as a function of x, for fixed
 $n=100$
, and for the simple scoring scheme
 $({-}1,0,+1)$
: the asymptotic lower and upper bounds of [Reference Karlin and Dembo9] (see (6) and (7)), the approximation proposed in Theorem 2.4, and a Monte Carlo estimation.

In this simple example, the approximate formula for the tail distribution of  $Q_1$
given in Theorem 2.3 and the one given in Lemma 4.4 of [Reference Karlin and Dembo9] give quite similar numerical values. In Figures 2 and 3 we compare three approximations for the CDF of
 $M_n$
: Karlin and Dembo’s [Reference Karlin and Dembo9] asymptotic bounds (the lower bound, depending on
 $K^+$
and recalled in (6), and the upper bound, depending on
 $K^*$
and recalled in (7)), the approximation proposed in Theorem 2.4, and a Monte Carlo estimation. For the simple scoring scheme of this application, the parameter
 $K^*$
appearing in the asymptotic bounds of [Reference Karlin and Dembo9] is given by their (5.6):
 \begin{align*}K^*=(\textrm{e}^{-2\theta^*}-\textrm{e}^{-\theta^*})\cdot\textrm{E}[\,f(A)]\cdot\sum_{\beta}z_{\beta}u_{\beta}(\theta^*)\cdot\sum_{\gamma}w_{\gamma}/u_{\gamma}(\theta ^*).\\[-20pt]\end{align*}
More precisely, in Figure 2 we plot the probability  $p(n,x)\coloneqq \textrm{P}\big(M_n\leq \frac{\log(n)}{\theta^*}+x\big)$
as a function of n, for two fixed values
 $x=-5$
and
 $-8$
. This illustrates the asymptotic behaviour of this probability with growing n. We can also observe the fact that Karlin and Dembo’s asymptotic bounds do not depend on n. In Figure 3, we compare the asymptotic bounds of [Reference Karlin and Dembo9] for the same probability p(n, x) with our approximation, for varying x and fixed
 $n=100$
. We observe that the improvement brought by our approximation is more significant for negative values of x. For fixed n and extreme deviations (large x) the two approximations are quite similar and accurate.
4.5. Numerical applications on real data
We consider the examples presented in [Reference Karlin and Altschul8] for which we could recover the given sequences. On each sequence separately we learn the score frequencies  $f_x$
for each possible score x, as well as the transition probability matrix
 $\mathbb{P}$
, for which we give each row
 $P_x$
. For each example we also show the corresponding invariant probability
 $\pi$
, which is in general close to the score frequencies, as expected. Biologists have warned us that since 1990 the sequences referenced in [Reference Karlin and Altschul8] may have changed a little bit due to the evolution of sequencing, which can explain some small differences in score frequencies between our sequences and those in [Reference Karlin and Altschul8]. Note that our Hypotheses (1) and (2) are both satisfied in all the following applications.
For each example we computed the corresponding p-values of the observed local score using the asymptotic lower and upper bounds of [Reference Karlin and Dembo9] ( $p_\textrm{KDe}$
refers to the bound with
 $K^*$
based on (7), and
 $p_{\textrm{KDe}-K^+}$
refers to the bound with
 $K^+$
based on (6)), the approximation proposed in Theorem 2.4 (
 $p_\textrm{GMe}$
), and an empirical Monte Carlo estimation (
 $p_\textrm{MC}$
) based on
 $10^5$
simulations of sequences of the given length. Note that in all examples we have
 $p_\textrm{MC}\leq p_\textrm{GMe}\leq p_\textrm{KDe}\leq p_{\textrm{KDe}-K^+}$
, except in Example (d)(ii), where we have
 $p_\textrm{GMe}\leq p_\textrm{MC}\leq p_\textrm{KDe}\leq p_{\textrm{KDe}-K^+}$
. In order to simplify the presentation, in what follows we only show the results based on the best of the two bounds of Karlin and Dembo, which is
 $p_\textrm{KDe}$
. We also compute the percentage of relative error for both theoretical methods:
 \begin{equation}RE(\textrm{KDe})=100\cdot \frac{p_\textrm{KDe}-p_\textrm{MC}}{p_\textrm{MC}}, \qquad RE(\textrm{GMe})=100\cdot \frac{p_\textrm{GMe}-p_\textrm{MC}}{p_\textrm{MC}}.\end{equation}
The p-value given by [Reference Karlin and Altschul8] in the i.i.d. model ( $p_\textrm{KDe\mbox{-}iid}$
) is recalled.
We also computed two classical measures of dissimilarity between the theoretical approximate distribution of the local score (the one we propose, denoted GMe, respectively the one given by the asymptotic upper bound of [Reference Karlin and Dembo9], denoted KDe), and the empirical distribution obtained by Monte Carlo simulations, denoted MC:
the Kolmogorov–Smirnov distance:
 \begin{equation}d_\textrm{KS}(\textrm{GMe})\coloneqq \max_x(|P_\textrm{GMe}(M_n\leq x)-P_\textrm{MC}(M_n\leq x)|); \end{equation}
the Kullback–Leibler divergence:
 \begin{equation}d_\textrm{KL}(\textrm{GMe})\coloneqq \sum_{x} P_\textrm{MC}(M_n=x)\cdot\log\left(\frac{P_\textrm{MC}(M_n=x)}{P_\textrm{GMe}(M_n=x)}\right).\end{equation}
Similarly, We define  $d_\textrm{KS}(\textrm{KDe})$
and
 $d_\textrm{KL}(\textrm{KDe})$
using the asymptotic upper bound of [Reference Karlin and Dembo9] for the distribution of the local score (see (7)).
We gather the relative errors and the two distance computations in Table 1.
Examples (c)(i) and (c)(iii) have not been considered, since we did not recover the sequences presented in [Reference Karlin and Altschul8]. Note that the sequence in Example (a)(i) has one supplementary amino acid compared with [Reference Karlin and Altschul8], and the local score is equal to 21 instead of 24 in [Reference Karlin and Altschul8]. Example (e) has not been studied because one of the transition probabilities is equal to 0 and does not satisfy our hypotheses.
Numerical comparison between our approximation for the local score distribution and the one from [Reference Karlin and Dembo9], using relative errors (see (32)) and two classical dissimilarity measures recalled in (33) and (34).

Example (a).Mixed charge segment:  $s=2$
for the amino acids aspartate (D), glutamate (E), histidine (H), lysine (K), and arginine (R), and
 $s=-1$
otherwise.
(i) Human keratin cytoskeletal type II (UniProtKB-P04264):  $n=644$
,
 $M_n=24$
, positions 238–292.
 $f_{-1}=82.2\%$
;
 $f_2= 17.8\%$
.
 $P_{-1}=(0.784, 0.216)$
;
 $P_{2}=(0.821, 0.179)$
.
 $p_\textrm{KDe}=5.06\cdot 10^{-3}$
;
 $p_\textrm{GMe}= 1.51\cdot 10^{-3}$
;
 $p_\textrm{MC}=1.41\cdot 10^{-3}$
.
 $\pi = [0.792;\ 0.208]$
.
(ii) Human c-jun, nuclear transcription factor (UniProtKB-P05412):  $n=331$
,
 $M_n=29$
, positions 246–285.
 $f_{-1}=79.5\%$
;
 $f_2=20.5\%$
.
 $P_{-1}=(0.805, 0.195)$
;
 $P_{2}=(0.754, 0.246)$
.
 $p_\textrm{KDe}=2.2\cdot 10^{-3}$
;
 $p_\textrm{GMe}=6.03\cdot 10^{-4}$
;
 $p_\textrm{MC}=5.4\cdot 10^{-4}$
;
 $p_\textrm{KDe\mbox{-}iid}<2\cdot 10^{-4}$
.
 $\pi = [0.795;\break 0.205]$
.
Example (b).Acidic charge segments:  $s=2$
for aspartate (D) and glutamate (E);
 $s=-2$
for lysine (K) and arginine (R);
 $s=-1$
otherwise.
Zeste protein (UniProtKB-P09956):  $n=575$
,
 $M_n=11$
, positions 194–209.
 $f_{-2}=8.0\%$
;
 $f_{-1}=82.8\%$
;
 $f_2=9.2\%$
.
 $P_{-2}=(0.109, 0.696, 0.195)$
;
 $P_{-1}=(0.078, 0.853, 0.069)$
;
 $P_{2}=(0.075, 0.717, 0.208)$
.
 $p_\textrm{KDe}=5.76\cdot 10^{-1}$
;
 $p_\textrm{GMe}= 5.21\cdot 10^{-2}$
;
 $p_\textrm{MC}=5.04\cdot 10^{-2}$
;
 $p_\textrm{KDe\mbox{-}iid}=3.7\cdot 10^{-3}$
.
 $\pi = [0.080;\ 0.828;\ 0.092]$
.
Example (c).High-scoring basic charge segments:  $s=2$
for lysine (K), arginine (R), and histidine (H);
 $s=-2$
for aspartate (D) and glutamate (E);
 $s=-1$
otherwise.
(ii) Zeste protein (UniProtKB-P09956):  $n=575$
,
 $M_n=12$
, positions 78–86.
 $f_{-2}=9.2\%$
;
 $f_{-1}=79.7\%$
;
 $f_2=11.1\%$
.
 $P_{-2}=(0.208, 0.698, 0.094)$
;
 $P_{-1}=(0.068, 0.827, 0.105)$
;
 $P_{2}=(0.172, 0.656, 0.172)$
.
 $p_\textrm{KDe}=13.9\cdot 10^{-2}$
;
 $p_\textrm{GMe}=2.2\cdot 10^{-2}$
;
 $p_\textrm{MC}=2.1\cdot 10^{-2}$
;
 $p_\textrm{KDe\mbox{-}iid}=4\cdot 10^{-3}$
.
 $\pi = [0.093;\ 0.796;\ 0.111]$
.
Example (d).Strong hydrophobic segments:  $s=1$
for isoleucine (I), leucine (L), valine (V), phenylalanine (F), methionine (M), cysteine (C), alanine (A);
 $s=-1$
for glycine (G), serine (S), threonine (T), tryptophan (W), tyrosine (Y), proline (P);
 $s=-2$
for arginine (R), lysine (K), aspartate (D), glutamate (E), histidine (H), asparagine (N), glutamine (Q).
(i) Drosophila engrailed (UniProtKB-P02836):  $n=552$
,
 $M_n=17$
, positions 63–88.
 $f_{-2}=34.6\%$
;
 $f_{-1}=33.7\%$
;
 $f_1=31.7\%$
.
 $P_{-2}=(0.466, 0.230, 0.304)$
;
 $P_{-1}=(0.254, 0.449, 0.297)$
;
 $P_{1}=(0.314, 0.337, 0.349)$
.
 $p_\textrm{KDe}=5.82\cdot 10^{-4}$
;
 $p_\textrm{GMe}=7.31\cdot 10^{-5}$
;
 $p_\textrm{MC}=6\cdot 10^{-5}$
;
 $p_\textrm{KDe\mbox{-}iid}=1.8\cdot 10^{-5}$
.
 $\pi = [0.346;\ 0.338;\ 0.316]$
.
(ii) Human c-mas, angiotensin receptor factor (UniProtKB-P04201):  $n=325$
,
 $M_n=15$
, positions 186–212.
 $f_{-2}=23.4\%$
;
 $f_{-1}=29.8\%$
;
 $f_1=46.8\%$
.
 $P_{-2}=(0.381, 0.316, 0.303)$
;
 $P_{-1}=(0.206, 0.289, 0.505)$
;
 $P_{1}=(0.179, 0.298, 0.523)$
.
 $p_\textrm{KDe}= 8.77 \cdot 10^{-1}$
;
 $p_\textrm{GMe}= 1.77 \cdot 10^{-1}$
;
 $p_\textrm{MC}=2.15 \cdot 10^{-1}$
;
 $p_\textrm{KDe\mbox{-}iid}=0.80 \cdot 10^{-1}$
.
 $\pi = [0.234;\ 0.3;\ 0.466]$
.
(iii) Cystic fibrosis (UniProtKB-P13569):  $n=1480$
,
 $M_n=21$
, positions 986–1029.
 $f_{-2}=31.55\%$
;
 $f_{-1}=26.9\%$
;
 $f_1=41.55\%$
.
 $P_{-2}=(0.355, 0.270, 0.375)$
;
 $P_{-1}=(0.322, 0.271, 0.407)$
;
 $P_{1}=(0.282, 0.267, 0.451)$
.
 $p_\textrm{KDe}=22.5\cdot 10^{-3}$
;
 $p_\textrm{GMe}=3.19\cdot 10^{-3}$
;
 $p_\textrm{MC}=1.94 \cdot 10^{-3}$
;
 $p_\textrm{KDe\mbox{-}iid}=10^{-3}$
.
 $\pi = [0.316;\ 0.269;\ 0.415]$
.
Acknowledgements
We thank the referee for very useful comments, which led to an improvement of the manuscript.