Hurricane Sandy was distinct in its size and scope of impact in New Jersey. The state’s infrastructure, including a major highway along the shore and the mass transit system serving the New Jersey–New York metro region, was severely damaged.Reference Manuel 1 The US Department of Commerce estimated that the 10 hardest hit counties in New Jersey (those closest to the main coastal and riverfront areas) included almost 6 million residents and 41% of the New Jersey labor force. 2 The damage and disruption required the mobilization of a diverse array of workers for response, recovery, and rebuilding.
Previous research has outlined the occupational health risks of extreme weather events such as Hurricane Sandy. Shulte and ChunReference Schulte and Chun 3 described possible hazardous working conditions resulting from extreme weather events such as hurricanes. Examples such as flood cleanup (biological agents, broken glass), exposure to electrical hazards (downed power lines), and working despite disruption of infrastructure (motor vehicle accidents) are most relevant to Hurricane Sandy. Potential health outcomes include injury, communicable disease, and other illnesses. Workers performing tasks such as restoring electrical power and demolishing damaged buildings can be inherently at high risk of injury, while other workers might put themselves at unusual risk when asked to extend hours, take on new roles, and work in physically demanding conditions without power. In addition, while there might be risk to both the general and working population soon after the event, workers could continue to be at higher risk because of the longer time frame for recovery and rebuilding. Despite the occupational health risks associated with hurricanes, there has been little comprehensive accounting of work-related injuries among workers in the wake of a major hurricane. Existing data from the United States come from experience with Hurricane Katrina, particularly among employees such as firefighters.Reference Schulte and Chun 3 - Reference Tak, Bernard and Driscoll 5 Public health efforts have also relied on reporting of work-related fatalities using multiple sources. For example, the New Jersey Department of Health (NJDOH) identified work-related fatalities directly associated with Hurricane Sandy in New Jersey, such as tree care workers. The Centers for Disease Control and Prevention also reported on injuries immediately after Hurricane Sandy, but did not separate injuries incurred during work from other injuries.Reference Brackbill, Caramanica and Maliniak 6
The purpose of this study was to use previously collected injury data to evaluate the impact of Hurricane Sandy on the number, type, location, and extent of work-related injuries before and after Hurricane Sandy. By understanding these outcomes, we hope to prevent injuries related to extreme weather events and to improve surveillance methods.
Methods
Data Sources and Classifications
The New Jersey Discharge Data Collection System, maintained by the NJDOH, was used to obtain universal billing data, which is composed of emergency department and hospital discharge records, for injuries from 2009 to 2013. Emergency department and hospital discharge data were extracted from the universal billing file if the primary or secondary medical diagnosis fields within the record indicated an unintentional injury utilizing International Classification of Diseases, 9th revision, Clinical Modification (ICD-9-CM) codes. Based upon the State and Territorial Injury Prevention Directors Association guidelines, 7 injury ICD-9 codes utilized were 800 to 909.29, 909.4, 909.9, 910 to 994.99, 995.5 to 995.59, or 995.80 to 995.85. We excluded records with external causes of injury and poisoning codes (E codes) starting with E95, E96, E97, or E98 because these are considered intentional and this analysis focused on unintentional injuries. We included inpatient and emergency department visits for patients aged 18 to 65 years at the time of injury to focus on those who were most likely to be working. To evaluate the effect of Hurricane Sandy on work-related injuries, we utilized surveillance definitions of work-relatedness, applied to all injuries, and then compared the number and characteristics of the possible work-related injuries identified before and after Hurricane Sandy. Hospital visits were considered work-related if the primary payer was workers’ compensation insurance plans or if diagnosis, V, or E codes suggested a work location or work-related visit. The workers’ compensation insurance provider codes were based on the guidelines from the NJDOH. 8 Hospitalization records with E codes 849.3 (denotes that the injury occurred at an industrial place or premise) and 846.N (accidents involving powered vehicles used solely within the buildings and premises of industrial or commercial establishment) or diagnosis codes V62.1 (adverse effects of work environment) and V71.3 (observation following accident at work) were also considered possible work-related injuries based on guidelines from the Massachusetts Department of Health.Reference Davis, Hunt and Hackman 9 To evaluate the completeness of reporting of work-related injuries, we also assessed the distribution and characteristics of all payers among those labeled as work-related and all other injuries (apparently non-work-related) over time.
In order to eliminate multiple hospitalizations for the same injury, we excluded records from the same patient where the site and type of injury was the same and the date of hospitalization was within 30 days of a prior hospitalization. The site and type of injury was determined by utilizing the Barell matrix.Reference Barell and Aharonson-Daniel 10 We linked hospitalization records based on patient name, date of birth, and home address by using The Link King software program (http://www.the-link-king.com). The final analysis dataset focused on initial injury hospitalizations and emergency department visits from October 29, 2009, through October 28, 2013.
The race and ethnicity variables were classified into Hispanic, non-Hispanic white, non-Hispanic black, Asian/other race, and unknown. Asian/other race included all Asian/Pacific Islander categories, all Native American categories, and those labeled as multiracial or other race. Unknown included unknown/unavailable and declined to answer. External causes of injuries based on ICD-9 codes were classified into the following categories: motor vehicle, falls, cut/pierce, struck by/against, overexertion, poisoning, machinery, natural/environmental, other, and missing. The Barell injury diagnosis based on ICD-9 codes were classified into fractures, dislocation, sprain/strains, internal organ, open wounds, amputations, blood vessels, superficial/contusion, crushing, burns, nerves, unspecified, system-wide/late effects, and others.
We designated certain areas of New Jersey to be highly, moderately, or minimally impacted by Hurricane Sandy on the basis of the county of each hospital to provide a general measure of the overall impact of the storm geographically. The relative impact of the storm on each New Jersey county was based on estimates by Hoopes-Halpin,Reference Hoopes Halpin 11 who utilized data from several federal and state sources. A “community hardship index” was developed that was based on power loss; residential, commercial, and municipal damage; emergency shelters established; and gasoline shortages. Raw scores for each measure were converted to standardized z-scores on the basis of state-wide averages and were weighted on the basis of a specific formula, and residential and commercial taxes were utilized to account for differing county compositions. New Jersey counties were grouped into quintiles on the basis of impact scores. For this analysis, we defined the high-impact area as those counties in the state with an index in the upper 2 quintiles. The high-impact area encompassed 8 counties and a population of about 3.5 million people. The moderate-impact area encompassed 8 counties and a population of about 3.6 million people. The remaining 6 counties, with a population of about 1.5 million people, were considered the low-impact area. Because we did not have data on where traumatic injuries actually occurred and because patients may have traveled away from home for work, the location of the hospital where the injury was treated was used to define the impact area.
Employment Data Source
The employment data for all years in New Jersey were extracted from the Quarterly Census of Employment and Wages (QCEW: http://www.bls.gov/data/). We utilized the QCEW quarterly counts of employment and wages at the county level, which is a count of the filled jobs, whether full-time or part-time, temporary or permanent. One limitation of the QCEW is that multi-job holders will count more than once and part-time job holders will count as one. However, this census provides estimates by county, allowing us to estimate the employment denominator for each Hurricane Sandy impact area. Because estimates by sex were only available for the entire state, we assumed that the sex distribution of employees was consistent throughout the state. Analysis of census data on employed adults supported this assumption.
Statistical Analysis
Descriptive and Poisson regression analyses were used to evaluate the short-term and long-term impact of Hurricane Sandy. All analyses utilized the date of visit to the emergency department or date of admission for those admitted directly as inpatients and descriptive variables from the first record for an individual. Descriptive variables included age, sex, race, ethnicity, state of residence (New Jersey, other), and discharge status (death, inpatient, released from emergency department). To evaluate the short-term impact of Hurricane Sandy, we calculated and compared the weekly count of work-related injuries in the weeks before and after Hurricane Sandy arrived. Specifically, we compared the Hurricane Sandy week (the week beginning with the day of landfall, October 29 to November 4, 2012), with each of 3 subsequent weeks (November 5-11, November 12-17, November 18-24, 2012), and with the average of 4 weeks prior to Hurricane Sandy (October 2-28, 2012). Moreover, we also compared weekly incidence from October 2 to November 24 in 2012 with the incidence of the same week averaged over previous years to account for possible seasonal variation. For the long-term impact of Hurricane Sandy, we divided the study period into quarters (Oct 29-Jan 28, Jan 29-Apr 28, Apr 29-Jul 28, Jul 29-Oct 28) for each year beginning from October 29, 2009, to October 28, 2013. Incidence in each quarter of the Hurricane Sandy year (October 29, 2012, to October 28, 2013) was compared with the average of the same quarter in previous years. This helped to control for the substantial seasonal variation in work-related injuries throughout the time frame of the study. In assessing the short-term and long-term impact, descriptive and Poisson regression analysis were performed to assess the effects of age, sex, impact area, race/ethnicity, mechanism/cause, and diagnosis on the risk of injury. Rate ratios (RRs) of work-related injuries were calculated by using linear contrasts in Poisson regression analysis with weekly incidence as the dependent variable. In the short-term impact analysis, we included weeks, years, and weeks-by-years interaction as the independent variables. In the long-term impact analysis, we included quarters, years, and quarters-by-years interaction as the independent variables. If the quarterly count of injuries in a specific subgroup was less than 50, we used monthly (rather than weekly) incidence as the dependent variable to avoid multiple zero-weekly injuries in the long-term impact analysis. Weeks, quarters, and years were all included as categorical variables in these statistical models. Statistical inference was based on the quasi-likelihood approach to account for the over-dispersion and was carried out by using the GENMOD procedure in SAS V9.3 (SAS Corporation, Cary, NC).
Further descriptive analyses were performed to evaluate more detailed characteristics of those with missing or other race/ethnicity categories, missing location codes, and potential work-related cases not identified as occurring at work. This study was approved by the Rutgers Biomedical and Health Sciences and the NJDOH institutional review boards.
Results
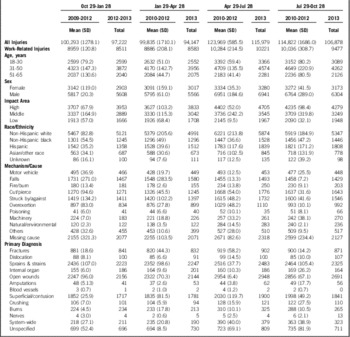
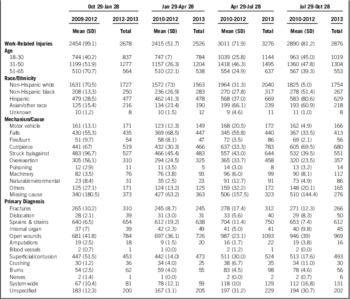
Table 1 shows the distribution and characteristics of the mean number of injuries by quarter during the 3 years prior to Hurricane Sandy as well as the 4 quarters after Hurricane Sandy, beginning with October 29, 2012. Based on our definition, work-related injuries constituted 8% to 9% of the total injuries in this age group, with small increases in the percentage of work-related injuries after Hurricane Sandy compared with before. The vast majority of the hospital visits were for patients admitted to the emergency department (96% to 97% of work-related injuries) and then released home (data not shown). There were few deaths recorded: for each quarter, there were about 1 to 4 work-related deaths with no discernible change over time (data not shown). On the basis of the residence reported by hospitals, residents outside New Jersey made up a small percentage (6%) of the patients treated for work-related injuries in 2009-2013 and that proportion did not change over time. Table 1 also shows the distribution of counts of work-related injuries by sex, race/ethnicity, mechanism/cause, and diagnostic group. Because of small numbers in each cell, the regression analysis did not include discharge status or state of residence in the computation of rate ratios.
Characteristics of Patients with Hospital Visits for Work-Related Unintentional Injuries During the Year After Hurricane Sandy and the Same Calendar Periods in the Prior 3 Years in New JerseyFootnote a

a Abbreviation: SD, standard deviation.
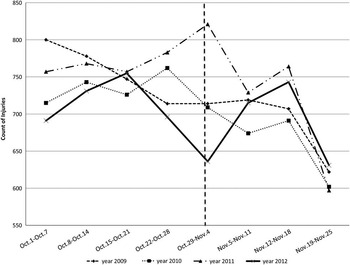
The first set of analyses focused on the immediate impact of Hurricane Sandy (Table 1). Figure 1 shows the number of work-related injuries reported by all New Jersey hospitals immediately in the 4 weeks before and after the hurricane’s landfall on October 29, 2012. The first week, when many New Jersey residents were not at work because of power loss and disruption of transportation, showed a decline from the previous several weeks and in comparison with the previous 3 years. Exactly 1 year before Hurricane Sandy (2011), another unusual weather event (an early snowstorm) was associated with a short-term increase in work-related injuries. After the hurricane, the number of work-related injuries returned to approximately the same number as in previous years, with a decline at the end of November (Thanksgiving holiday). Because there were no statistically significant differences in the count of injuries in the same 4 calendar weeks before Hurricane Sandy (2009–2012) (P=0.9972), we compared these 16 weeks before Hurricane Sandy to the first week after Hurricane Sandy (2012). The result showed that the number of work-related injuries in the first week after the hurricane was 0.85 (95% confidence interval [CI]: 0.69-1.05) times the number of injuries in the previous 4 weeks, based on the mean over the previous 4 years. When we looked at change over the other 3 years (2009, 2010, 2011), the results showed an increase only for the number of work-related injuries in 2011 for that late October week (RR: 1.10; 95% CI: 0.92-1.33).
Number of Work-Related Injuries Reported by all New Jersey Hospitals in the 4 Weeks Before and After Hurricane Sandy’s Landfall on October 29, 2012.

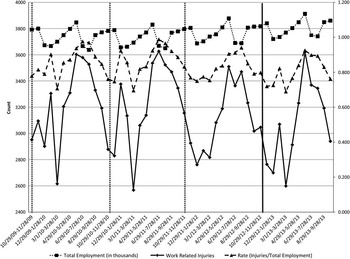
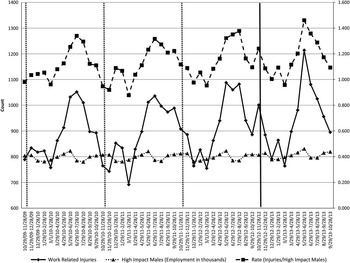
Over a longer time frame, Table 1 and Figure 2 show the monthly count of work-related injuries from October 29, 2009, to October 28, 2013, along with total employment and the rate of work-related injuries based on employment. There were clear seasonal fluctuations in work-related injuries, including increases during the spring/summer and some evidence of injuries related to winter storms. On the basis of this plot of hospital data for the entire state of New Jersey, no general trend was seen of an increase in work-related injuries after Hurricane Sandy.
Monthly Count of Work-Related Injuries, Total Employment, and Rate of Work-Related Injuries From October 29, 2009, to October 28, 2013.

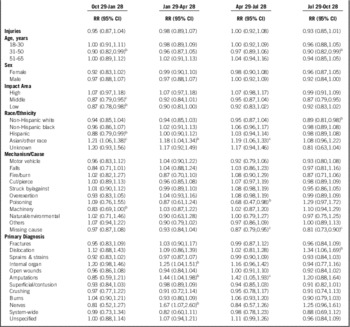
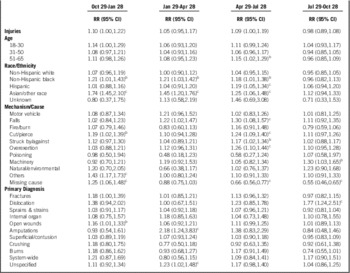
Table 2 shows the relative risk of work-related injury, comparing the quarterly mean counts before Hurricane Sandy to the quarters after Hurricane Sandy, for the total state and subset by characteristics of patients and injuries. There was very little difference in the rate ratios if we included total employment (aged 18-65 years) in the models because employment remained essentially the same over the time period. Thus, the regression results for counts are shown. For the entire state of New Jersey, there was some evidence of an overall reduction in work-related injuries over time, with little evidence of an increase in work-related injuries after Hurricane Sandy. In the high-impact area, overall rate ratios were over 1, though not statistically significant, and there was an increased risk of amputations for several time periods after Hurricane Sandy. Based on further analyses, the consistent increased rate ratio for the Asian/other race/ethnicity category was primarily due to the hospitals’ increasing tendency to use categories such as “other” and “mixed race” over the time frame of the study, rather than to true changes in the risk for that category.
Rate Ratios for Work-Related Unintentional Injuries During the Year After Hurricane Sandy and the Same Calendar Periods in the Prior 3 Years in New JerseyFootnote a

a Abbreviations: CI, confidence interval; RR, rate ratio.
b P value <0.05.
c P value <0.01.
Tables 3 and 4 and Figure 3 provide data on the subset of the working population that, a priori, was considered at the highest risk of work-related injury due to Hurricane Sandy: men in the high-impact area of New Jersey. Among this large subgroup, there were some apparent differences before and after Hurricane Sandy. Compared to the previous 3 years, during the quarter immediately after Hurricane Sandy, there was an overall increase in work-related injuries, with rate ratios significantly greater than one for non-Hispanic blacks (RR: 1.18, 95% CI: 1.01-1.38), for the mechanism cut/pierce injuries (RR: 1.19, 95% CI: 1.09-1.40), and for diagnosis of open wounds (RR: 1.42, 95% CI: 1.01-1.33). In the third quarter after Hurricane Sandy (April 29-July 30, 2013), there were significant increases among non-Hispanic blacks, Hispanics, and among several specific mechanisms/causes, including falls, cut/pierce, overexertion, and struck by/against. There were corresponding but nonsignificant increases in diagnoses that might be associated with these mechanisms, including fractures, dislocations, amputations, and open wounds.
Monthly Count of Work-Related Injuries, Employment Among Men in the High-Impact Area of New Jersey, and Rate of Work-Related Injuries Among High-Impact Males From October 29, 2009, to October 28, 2013.

Characteristics of Male Patients in the High-Impact Area of New Jersey With Hospital Visits for Work-Related Unintentional Injuries During the Year After Hurricane Sandy and the Same Calendar Periods in the Prior 3 Years in New JerseyFootnote a

a Abbreviation: SD, standard deviation.
Rate Ratios for Male Patients in the High-Impact Area of New Jersey With Hospital Visits for Work-Related Unintentional Injuries During the Year After Hurricane Sandy and the Same Calendar Periods in the Prior 3 YearsFootnote a

a Abbreviations: CI, confidence interval; RR, rate ratio.
b P value <0.05.
c P value <0.01.
Approximately 90% of injuries identified as work-related in this analysis had workers’ compensation as the primary payer, with some decline over time, from 94% in 2009 to 90% in 2013. Among the other 10%, which were identified as probably work-related based on other E (eg, location) and V codes, the primary payer showed some changes over time. Self-pay, commercial insurance, Blue Cross plans, and health maintenance organizations were the most common alternatives to workers’ compensation, in that order (data not shown). Both self-pay and commercial insurance showed general increases over time, with a spike in the spring and summer of 2013 for those 2 payers.
A parallel analysis of injuries not classified as work-related, using the same demographic (aged 18-65 years only), mechanisms, and diagnostic categories as in Table 1, did not show any overall increases over time among the entire state or among men in the high-impact area (data not shown). Most of the rate ratios comparing non-work-related injuries before and after Hurricane Sandy by quarter were less than one, suggesting limited decreases in emergency department visits for injuries between 2009-2012 and 2013. Overall, the rate ratios by quarter after Sandy for non-work-related injuries were (in order) 0.97 (95% CI: 0.87-1.08), 0.92 (95% CI: 0.84-1.05), 0.90 (95% CI: 0.84-1.03), and 0.93 (95% CI: 0.84-1.03). In contrast, there was evidence of small increases in cut/pierce injuries among men in the high-impact area in the first quarter after Hurricane Sandy (RR=1.13, 95% CI: 0.91-1.41) and the third quarter after Hurricane Sandy (RR=1.01, 95% CI: 0.84-1.21).
Discussion
Data from New Jersey hospitals did not show a general increase in work-related injuries in the time period immediately after Hurricane Sandy in late October 2012, partly because of power loss and disruption of transportation, as well as the Thanksgiving holidays. On the basis of data for the entire state, there was also not a general increase by quarter for the entire year after the storm. However, we observed an increase in work-related injuries in the first and third quarter after Hurricane Sandy (late spring/summer) among men in the high-impact counties, and accounting for changes in employment by use of available data did not alter those results substantially. Because the injury data did not include employer or industry information, it is not possible to identify the true circumstances or the specific conditions under which the increased injuries occurred, such as where falls occurred, what agents were involved in the cut and pierce injuries, and what objects struck the patients. The timing of the increase in injuries (spring-summer), as well as the leading mechanism or causes, dominance of men, corresponding diagnoses, and ethnicity (many construction workers are Hispanic) seem to suggest a role for construction, demolition, or related industries. Residential construction is particularly hazardous, with a high rate of fatalities and severe injury.Reference Dong, Wang and Largay 12 Previous work in New Jersey has shown poor control of hazards in this sector.Reference Ochsner, Marshall and Martino 13 Tree removal is also recognized as presenting substantial injury risks, including falls, cut/pierce, and struck by injuries.Reference Julius, Kane and Bulzacchelli 14 The increase shown here occurred in counties of the state where the greatest physical damage to buildings and other infrastructure (roads, boardwalks, etc) occurred, including those along the ocean and bay shores. Limited evidence also suggested that patients with injuries during the third quarter were more likely to have an expected payer other than workers’ compensation compared to the previous years. Day laborers and other construction workers are less likely to have workers’ compensation coverage than are other workers. 15
In contrast, there was little evidence of an increase in injuries soon after Hurricane Sandy. Short-term changes in employment are not generally reflected in monthly employment data and it is not possible to enumerate or characterize those who were actually working compared with those who were just not working temporarily. Given the number of businesses without power and the substantial disruption in transportation, the lack of an immediate increase might have been influenced by the overall reduction in the number of individuals actually attending their jobs, because many New Jersey residents stayed close to home for several weeks.
There are some inherent limitations in using hospital-based data to evaluate work-related injuries over time. Defining injuries as work-related based primarily on workers’ compensation as the expected payer underestimates the number of work-related injuries. Previous work has compared more than one source of injury data (eg, hospital billing, workers’ compensation, trauma registry data).Reference Davis, Hunt and Hackman 9 , Reference Friedman, Krupczak and Brandt-Rauf 16 Such studies suggest that a substantial proportion of work-related injuries seen in emergency rooms are not submitted for workers’ compensation. One analysis based on specially collected data from 2007 showed that 46% of self-reported work-related injuries occurring among New Jersey residents did not have financial support from workers’ compensation. 17 National and other state-based data suggest that the proportion of nonfatal work-related injuries supported by workers’ compensation has been declining over time.Reference Sears, Bowman and Hogg-Johnson 18 , Reference Davis, Grattan and Tak 19 Because most of the injuries evaluated in this study had workers’ compensation listed as the expected payer, the data as presented are likely to be missing at least 25% to 30% of work-related injuries. This is especially true for those occurring among small employers and immigrant workers, because they are less likely to have workers’ compensation coverage, and hospital sources are likely to misclassify work-related injuries in these groups into other categories and payers.
It is difficult to assess the impact of limitations in workers’ compensation and employment statistics on the analysis of changes in work-related injury possibly due to Hurricane Sandy. On the basis of standard employment data, the number of jobs in New Jersey was relatively stable over the time period of this study. Thus, increases in employees for disaster response or decreases because of storm damage may not be easily captured by those data. We also do not know whether jobs created or expanded in the wake of a hurricane are more or less likely to be covered by workers’ compensation than are typical jobs. Analysis of the much larger group of general injuries could not distinguish a corresponding increase in injuries that were treated but not identified as work-related. If contingent and immigrant workers are at especially high risk of work-related injury after a hurricane, then the relative risks shown in this study may underestimate the effects of Hurricane Sandy. Future studies should try to identify more complete data sources.
Emergency department billing records do not have sufficient information in the coded records to describe injuries in detail. There is insufficient description to identify preventive strategies and no way to distinguish injuries likely to be directly related to the hurricane (eg, flooding, tree removal, or demolition injuries) from other injuries occurring because of more typical working conditions. Most billing records do not record the location where the injury occurred, either by type (eg, building, street, factory) or actual location. Although ICD-9 E codes for type of location do exist, most of those were missing in the data available for 2009-2013 for New Jersey. Because the actual geographic location of the injury (eg, municipality or address) is unknown, we utilized hospital county as a proxy, but the distance from the site of injury to the hospital could vary substantially. Depending on the type of injury, payment circumstances, and the conditions of transportation (traffic, closed roads, etc), the patient might not have arrived or been transported to a hospital within the same county. After Hurricane Sandy, there was some concern about residents from outside New Jersey coming in temporarily to work in high-risk jobs, based on anecdotal reports and experience with Hurricane Katrina.Reference Fletcher, Pham and Stover 20 We did not see any increase in work-related injuries reported for nonresidents of New Jersey, although it is difficult to know how hospitals classified residents who were staying in New Jersey temporarily just for work.
Conclusion
In sum, analysis of work-related injuries after Hurricane Sandy showed that there were increases in injuries occurring in the spring and summer months in communities heavily impacted by the storm. There was no overall increase immediately after the hurricane, although the results are insufficient to differentiate possible competing pressures: increased risk of certain injuries because of the storm and decreased risk of more typical injuries because of disruption in electrical power, everyday infrastructure, and transportation. There is some evidence to suggest that risky activities associated with cleanup, demolition, and rebuilding may have resulted in an increase in the number of work-related injuries in New Jersey after Hurricane Sandy. Further research is needed to describe those risks in detail, improve the completeness of reporting, and develop strategies for preventing future injuries related to extreme weather events.
Funding
Centers for Disease Control (NIOSH) grant #1U01OH010622.
Supplementary Material
To view supplementary material for this article, please visit http://dx.doi.org/10.1017/dmp.2016.47.