


Anorexia nervosa (AN) is a debilitating, often enduring, and potentially life-threatening psychiatric illness that is characterized by self-directed starvation, physical emaciation, an intense fear of weight gain, and a marked disturbance in how one's body shape and weight is experienced (American Psychiatric Association, 2013). AN is among the most lethal of all psychiatric presentations, demonstrating a crude mortality rate of 5.6% per decade (Arcelus et al., Reference Arcelus, Mitchell, Wales and Nielson2011), and a 57-fold increased risk for suicidality (Keel et al., Reference Keel, Dorer, Eddy, Franko, Charatan and Herzog2003). Even in non-lethal presentations, AN ranks as the third leading cause of chronic illness in adolescents (Matthews et al., Reference Matthews, Hall, Vos, Patton and Degenhardt2011), and imparts an array of multi-systemic organ damage, including cardiac abnormalities, structural and functional brain impairment, and early-onset bone disease (Mitchell and Crow, Reference Mitchell and Crow2006). Importantly, illness duration may extend to over 20 years for more than half of those afflicted (Fichter et al., Reference Fichter, Quadflieg, Crosby and Koch2017), highlighting marked chronicity. Efficacious treatment for AN is therefore of high importance.
However, even the most promising interventions leave more than half of those treated unremitted (Watson and Bulik, Reference Watson and Bulik2013). A comprehensive review at the turn of the twenty-first century concluded that treatment outcomes for AN had not improved over the preceding 50 years (Steinhaussen, Reference Steinhaussen2002), and a call has been put forth to temporarily suspend large-scale randomized controlled trials (RCTs) until novel interventions are developed (Fairburn, Reference Fairburn2005). A clear explication of core illness mechanisms, and their response to treatment, is a fundamental prerequisite for the development of precision treatments for AN. Elucidating the disconnect between weight and psychological outcomes in the treatment of AN speaks directly to this mission. However, no meta-analysis has been conducted to delineate between these potentially discrepant symptom dimensions in the treatment of AN. Our objective here was to conduct a systematic review and meta-analysis of recent RCTs that assessed the efficacy of treatments for AN, when indexed across both weight and psychological symptoms, at post-intervention and, where available, longer term follow-up.
Methods
Selection procedures
A systematic review was performed according to PRISMA (Preferred Reporting Items for Systematic Reviews and Meta-Analyses) guidelines (Moher et al., Reference Moher, Liberati, Tetzlaff and Altman2009) (Supplementary Table S1), and the protocol for this review was prospectively registered with PROSPERO (CRD42016049831). Two authors (SBM and SG) independently searched MEDLINE/PubMed, PsychINFO, ScienceDirect, and EMBASE databases from January 1980 through to December 2017. Key search terms included relevant combinations of eating disorders, anorexia nervosa, treatment, treatment outcome, outcome, and trial, with Boolean operators. Studies in any language were considered, although all included RCTs were published in English. The search was completed with an additional screening of reference lists of eligible trials, screening existing systematic and narrative reviews for AN, and a manual journal search. Abstracts were screened and the full texts of relevant studies were retrieved. If full texts were not available, corresponding authors were contacted and full texts requested. Two authors (SBM and SG) selected the final studies for inclusion.
Selection criteria
Studies were included if they (i) were RCTs published between January 1980 and December 2017, (ii) reported the effect of at least one specialized treatment and one comparator or control treatment on patients with a diagnosis of AN, across at least two time points (i.e. pre- and post-treatment), and (iii) reported indices of both weight and psychological symptoms. For all studies, the designation of specialized v. comparator status was directly informed by the original studies. We did not assess data relating to mortality, since this was recently explicated (Arcelus et al., Reference Arcelus, Mitchell, Wales and Nielson2011). Studies involving participants without core AN-like psychological criteria (e.g. ‘non-fat-phobic’ AN) were excluded, as these clinical profiles would confound outcomes related to the core diagnostic criteria. We reviewed all RCTs reflecting these criteria and assessed the methodological quality of studies according to GRADE (Grading of Recommendations, Assessment, Development and Evaluation) guidelines (Guyatt et al., Reference Guyatt, Oxman, Akl, Kunz, Vist, Brozek, Norris, Falck-Ytter, Glasziou, DeBeer, Jaeschke, Rind, Meerpohl, Dahm and Schünemann2011). Study participants of any age were eligible, although given the widely reported differential prognoses (Steinhaussen, Reference Steinhaussen2002; Watson and Bulik, Reference Watson and Bulik2013) for adolescent v. adult AN, respectively, we treated mean age as a potential moderator variable. Treatment types included in the analyses were psychosocial, pharmacological, medical, and complementary/alternative interventions.
Risk of bias and data extraction
The Cochrane risk of bias tool (Higgins et al., Reference Higgins, Altman, Gøtzsche, Jüni, Moher, Oxman, Savocić, Schulz, Weeks and Sterne2011) was used to evaluate risk of bias. Performance bias was not assessed due to non-feasibility of blinding therapists and patients in RCT designs for psychosocial treatments. Studies without a clearly described method of blinding outcome assessors were rated as high risk of detection bias. Studies not describing an established method of participant randomization, or the concealment of this random allocation, were rated as high risk of random sequence generation bias, and selection bias, respectively. Likewise, studies not describing a protocol for intent-to-treat analyses were rated as high risk of attrition bias. Studies reporting analyses that diverged from prospective trial protocols, or where important data were not reported, were rated as high risk of reporting bias. For use in meta-regression analyses, we computed an overall risk of bias score for each study by awarding one point for each potential source of bias rated as low risk.
Statistical analysis
To delineate treatment outcomes, we indexed the findings of each study according to both weight and psychological symptom categories. In light of the inter-trial variability in the measures used for indexing psychological AN symptoms, a hierarchy was developed whereby the most empirically supported method in each study was preferred (Supplementary Table S2). All measures indexed core aspects of cognitive AN psychopathology, including global eating disorder symptom severity, dietary restraint, the drive for thinness, and food-related obsessionality. Statistical analysis was performed with R statistical software 3.3.2, using the metafor package. The dataset and script to perform the analyses are available at https://osf.io/q7v2d/?view_only=c3cdaf346298411eab9ed15e863c9f21. The primary outcomes of interest were the effect of treatment on both weight status and psychological AN symptomatology at the end-of-treatment (EOT) and at follow-up. Multiple effect sizes derived from the same study (e.g. weight and psychological outcomes) are statistically dependent, forming clusters of internally correlated effect size estimates. If effect size covariance is known, this can be included in models to adjust for these statistically dependent clusters. However, without access to original datasets, the covariance between effect size estimates of included studies is rarely available, as covariances are seldom reported. One approach is to assume a fixed covariance value; however, inaccuracy can lead to errors in effect size estimation (Cuijpers et al., Reference Cuijpers, Weitz, Cristea and Twisk2017). Cluster-robust meta-analyses can account for statistically dependent clusters without assuming a fixed covariance value when covariances are not reported (Hedges et al., Reference Hedges, Tipton and Johnson2010). As such, cluster-robust meta-analysis was applied to assess the primary outcomes. A random mixed-effects meta-analysis assuming a diagonal v. matrix was used to construct cluster-robust models for each outcome. Contrasts were then performed to assess for differences in effect sizes between weight and psychological outcomes at each point, and any changes in effect sizes over time from EOT to follow-up. Cluster-robust inferences were also used to assess differences in dropout frequencies between treatments, and whether this effect changed between EOT and follow-up. For ease of interpretation, weight outcomes (whereby a mean increase is a positive outcome) and psychological symptom outcomes (whereby a mean decrease is a positive outcome) were adjusted, such that positive values in both domains represent symptom improvement.
Secondary analysis was performed on weight and psychological outcomes at each time point separately to estimate the impact of the potential moderators: illness duration, treatment platform (inpatient, outpatient, mixed level of care), year of publication, age, risk of bias, type of weight outcome measure, and follow-up length. Owing to the greater number of psychosocial treatment trials (n = 21) v. medication (n = 11), medical (n = 2), and complementary/alternative (n = 1) treatment trials, the moderating effect of treatment type was conceptualized as a function of psychosocial treatments v. other treatments. As a supplementary analysis, we also conceptualized treatment type as a function of psychosocial treatments v. medication treatments. Relatedly, in delineating the potentially moderating effect of the various psychosocial interventions included, psychosocial treatment type (family therapy, individual therapy, group treatment) was also assessed as a potential moderator for psychosocial treatment trials. Lastly, due to variability in comparator interventions employed in trials (placebo, active treatment, non-specific treatment, treatment-as-usual), the moderating effect of comparator intervention type was also assessed. Small study bias, which includes both publication bias and study quality bias (Egger et al., Reference Egger, Smith, Schneider and Minder1997), was assessed by performing Egger's regression test (Egger et al., Reference Egger, Smith, Schneider and Minder1997). Contour-enhanced funnel plots, which superimpose key areas of statistical significance (p = 0.1, p = 0.05, p = 0.01), were constructed to specifically assess for the risk of publication bias (Peters et al., Reference Peters, Sutton, Jones, Abrams and Rushton2008). Effect sizes from multi-arm trials (n = 4) were merged for these secondary analyses, as recommended for random-effects models (Rücker et al., Reference Rücker, Cates and Schwarzer2017).
Results
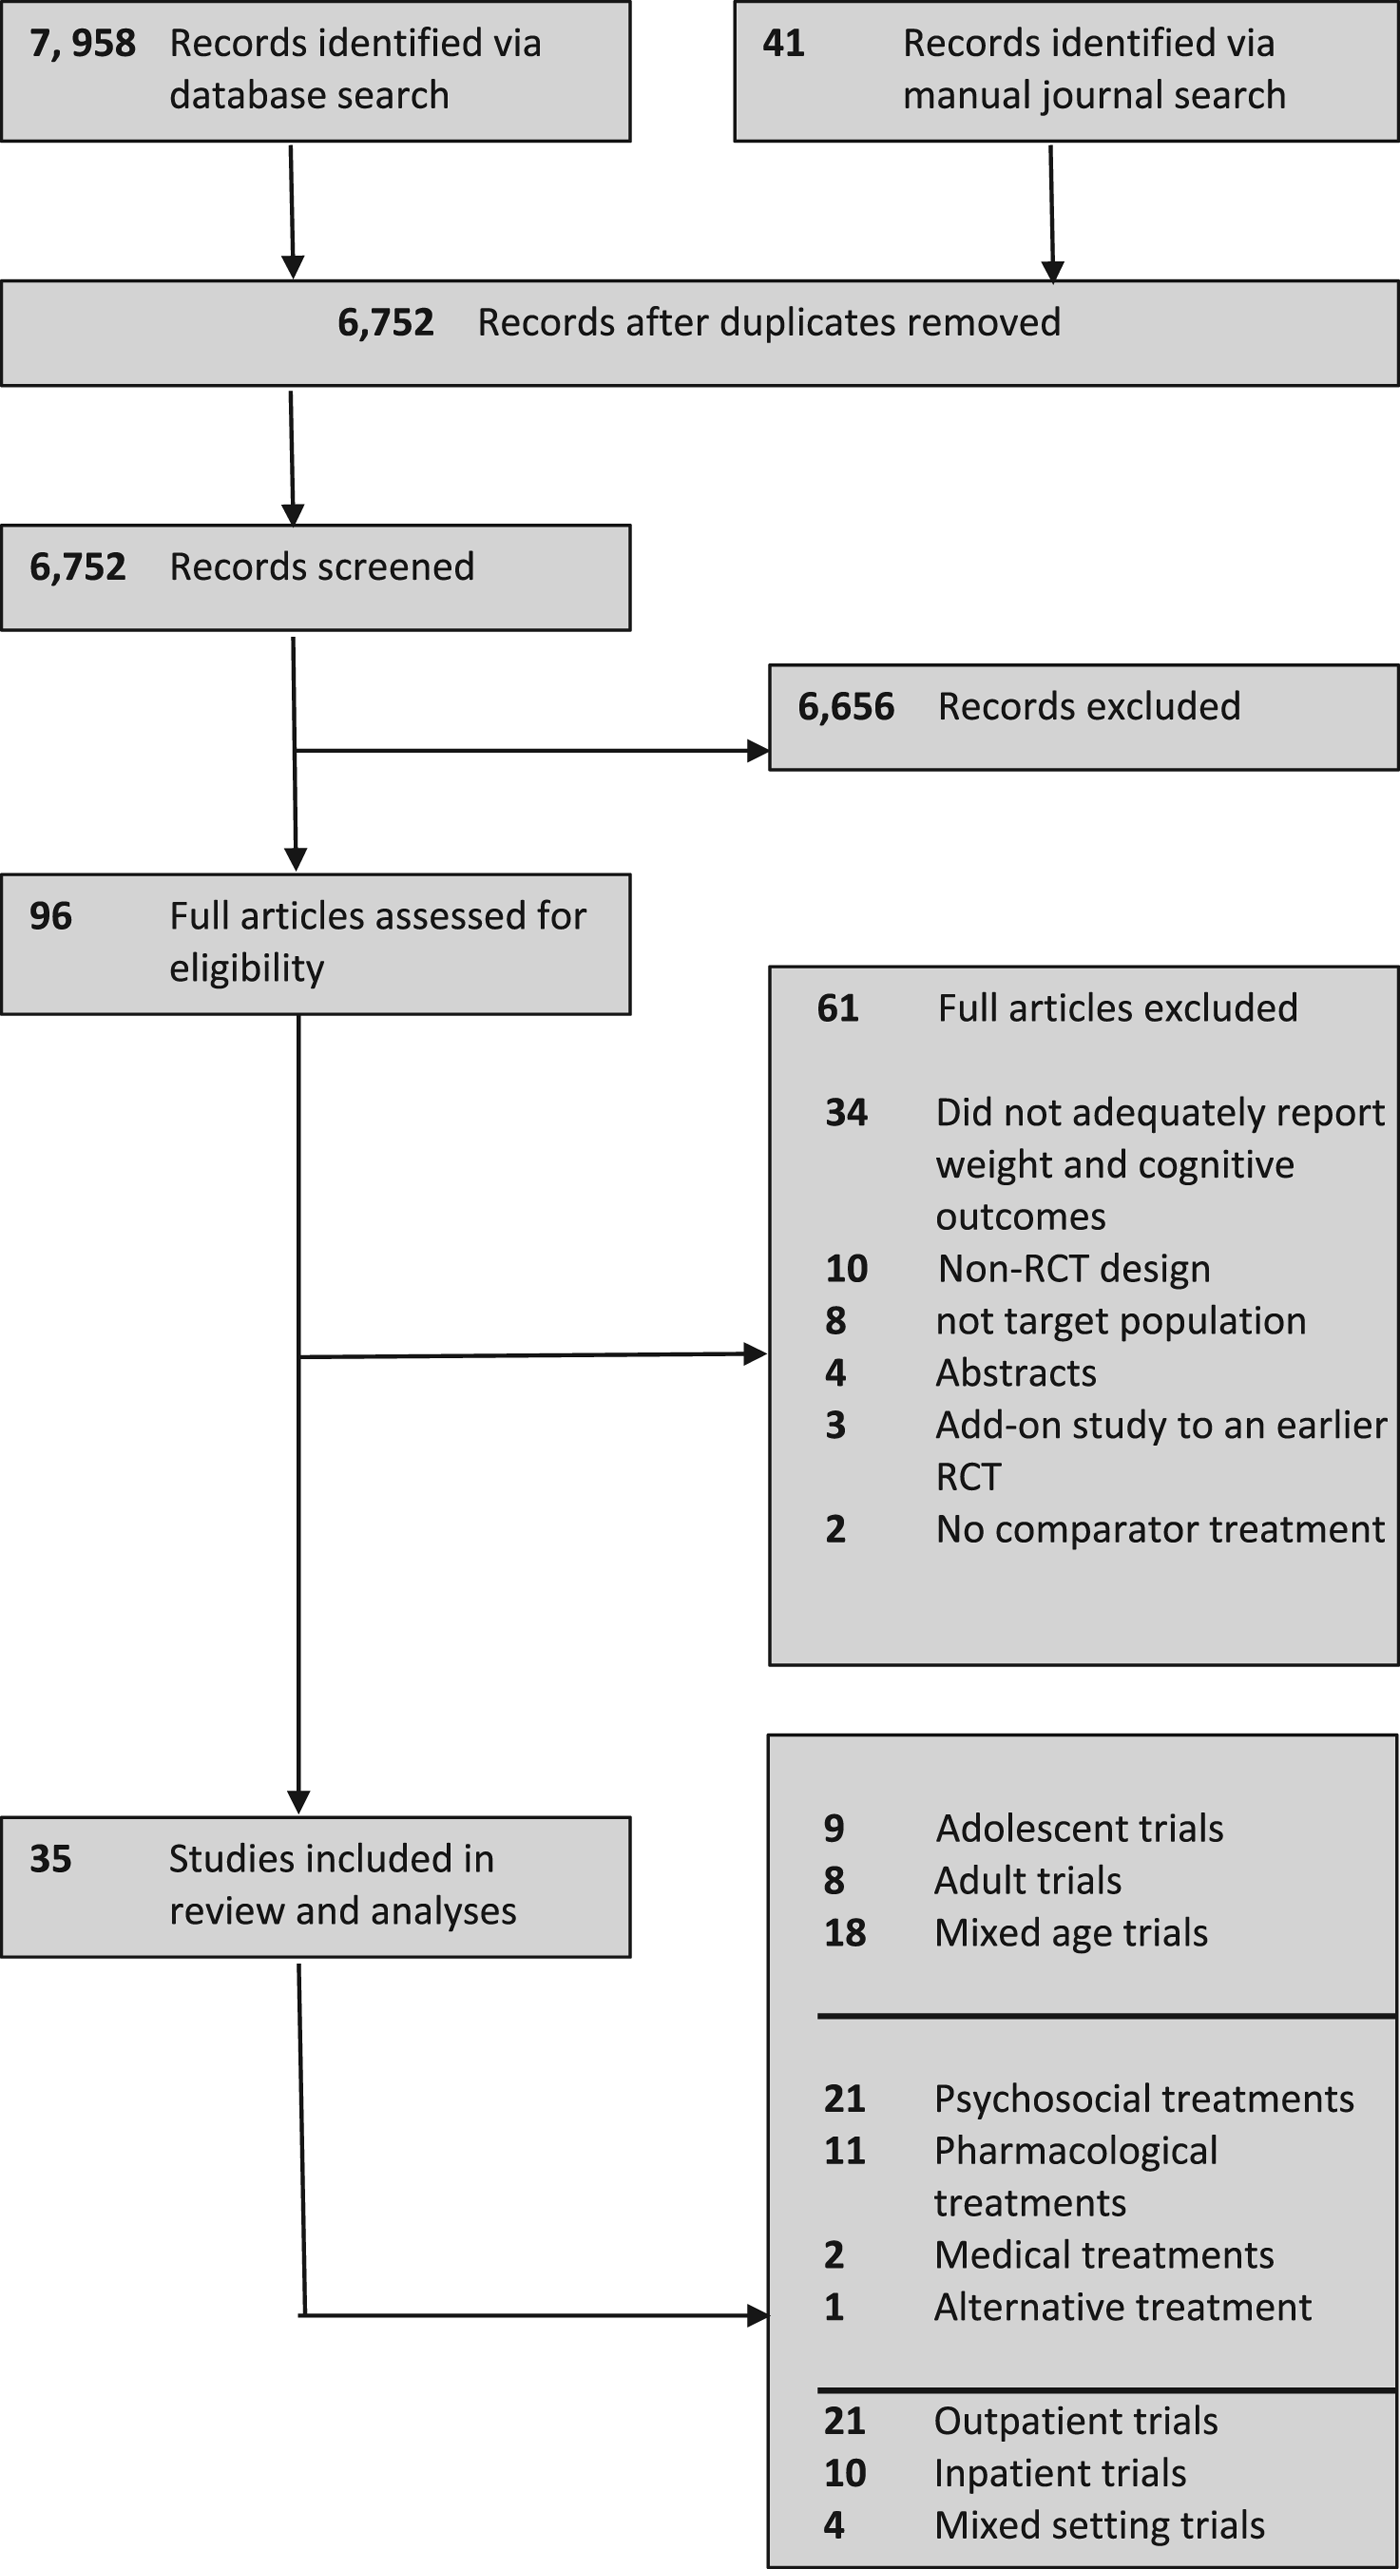
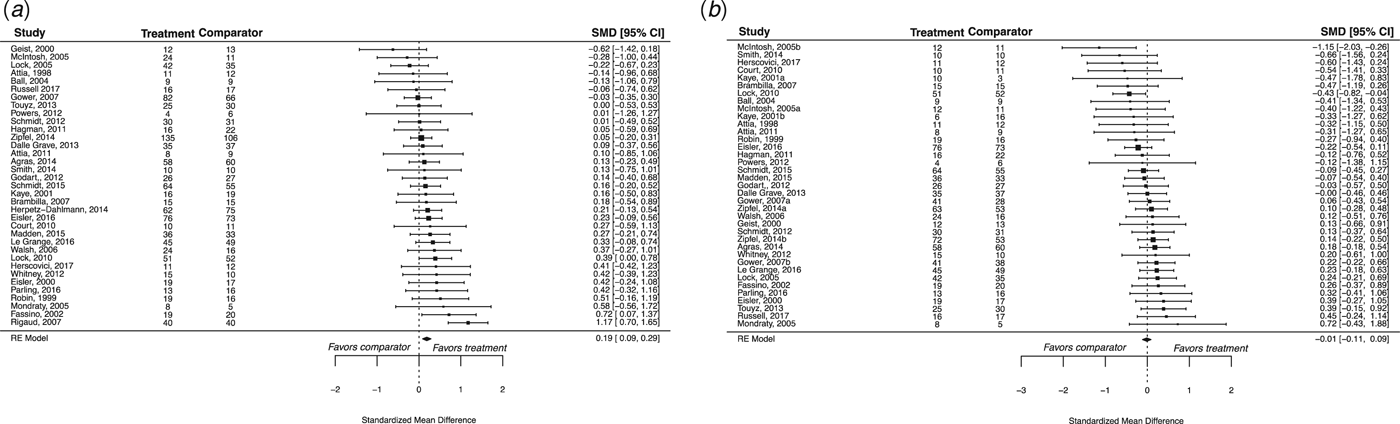
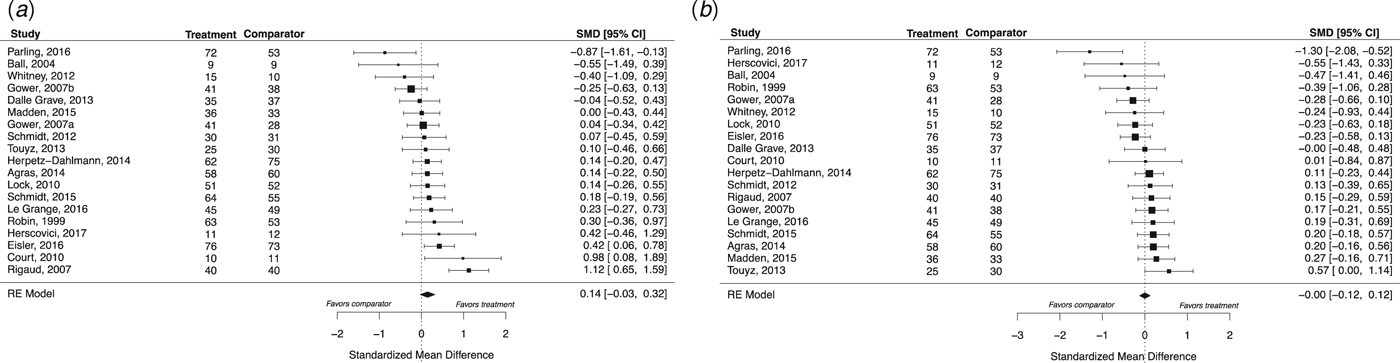
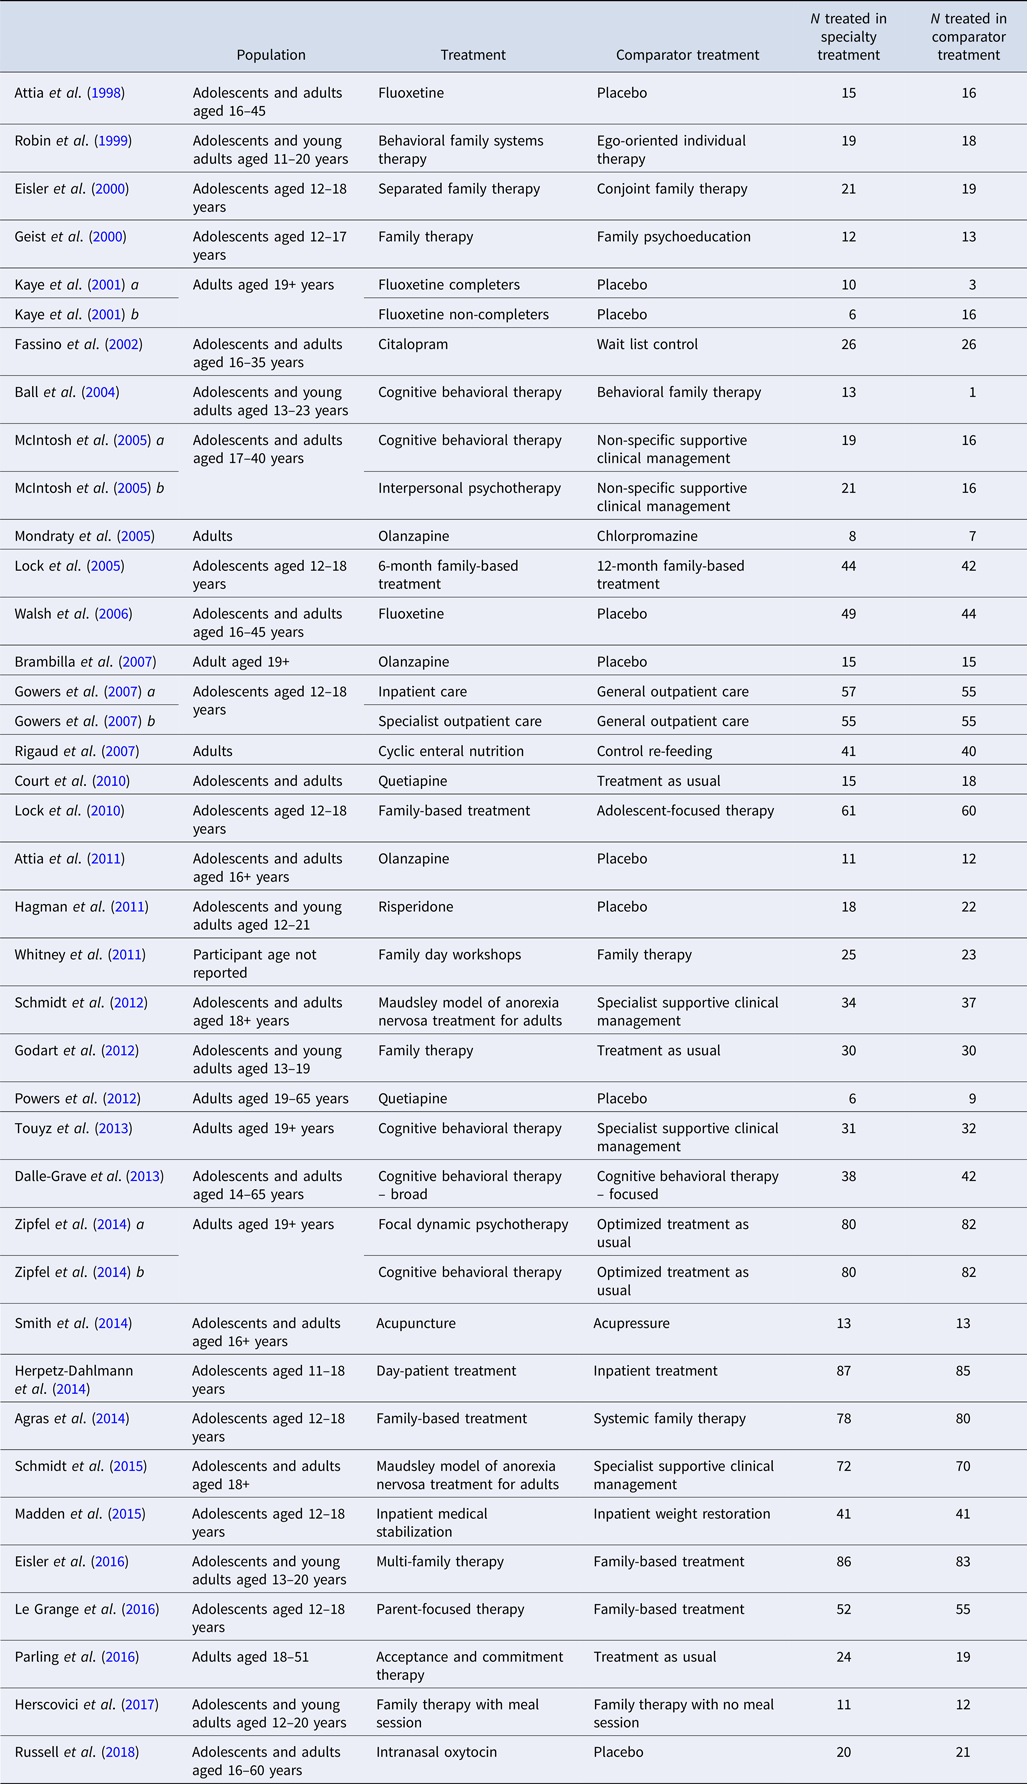
We identified 35 eligible RCTs, which included a total of 2524 participants (Fig. 1). Eligible RCTs included studies with adolescent populations (n = 9), in which the mean age was 15.01 years (s.d. = 0.39); adult populations (n = 8), in which the mean age was 27.1 years (s.d. = 4.36); and mixed populations (n = 18), in which the mean age was 21.86 years (s.d. = 4.56) (Table 1). Four RCTs yielded two effect sizes for each outcome, and one study featured a previously tested experimental treatment as a comparator treatment. Individual study effects at EOT are presented in Fig. 2, and at follow-up in Fig. 3.
PRISMA flowchart of study selection.
A summary of individual study effects at EOT. The comparison between specialized and comparator interventions at EOT for weight (a) and psychological (b) outcomes, derived from separate random-effects models. Hedges’ g point estimates are depicted by filled squares and the filled diamonds reflect the estimated summary effect sizes. Error bars and diamond widths represent 95% confidence intervals. Positive values represent effects favoring the specialized treatment, whereas negative values represent effects favoring the comparator treatment. Participant numbers refer to those completing treatment. Note that summary effect sizes (and confidence intervals) marginally differ from the more conservative cluster-robust estimates, which corrected for effect size dependencies.
A summary of individual study effects at follow-up. The comparison between specialized and comparator interventions at follow-up for weight (a) and psychological (b) outcomes, derived from separate random-effects models. Hedges’ g point estimates are depicted by filled squares and the filled diamonds reflect the estimated summary effect sizes. Error bars and diamond widths represent 95% confidence intervals. Positive values represent effects favoring the specialized treatment, whereas negative values represent effects favoring the comparator treatment. Participant numbers refer to those completing treatment. Note that summary effect sizes (and confidence intervals) marginally differ from the more conservative cluster-robust estimates, which corrected for effect size dependencies.
A summary of eligible studies
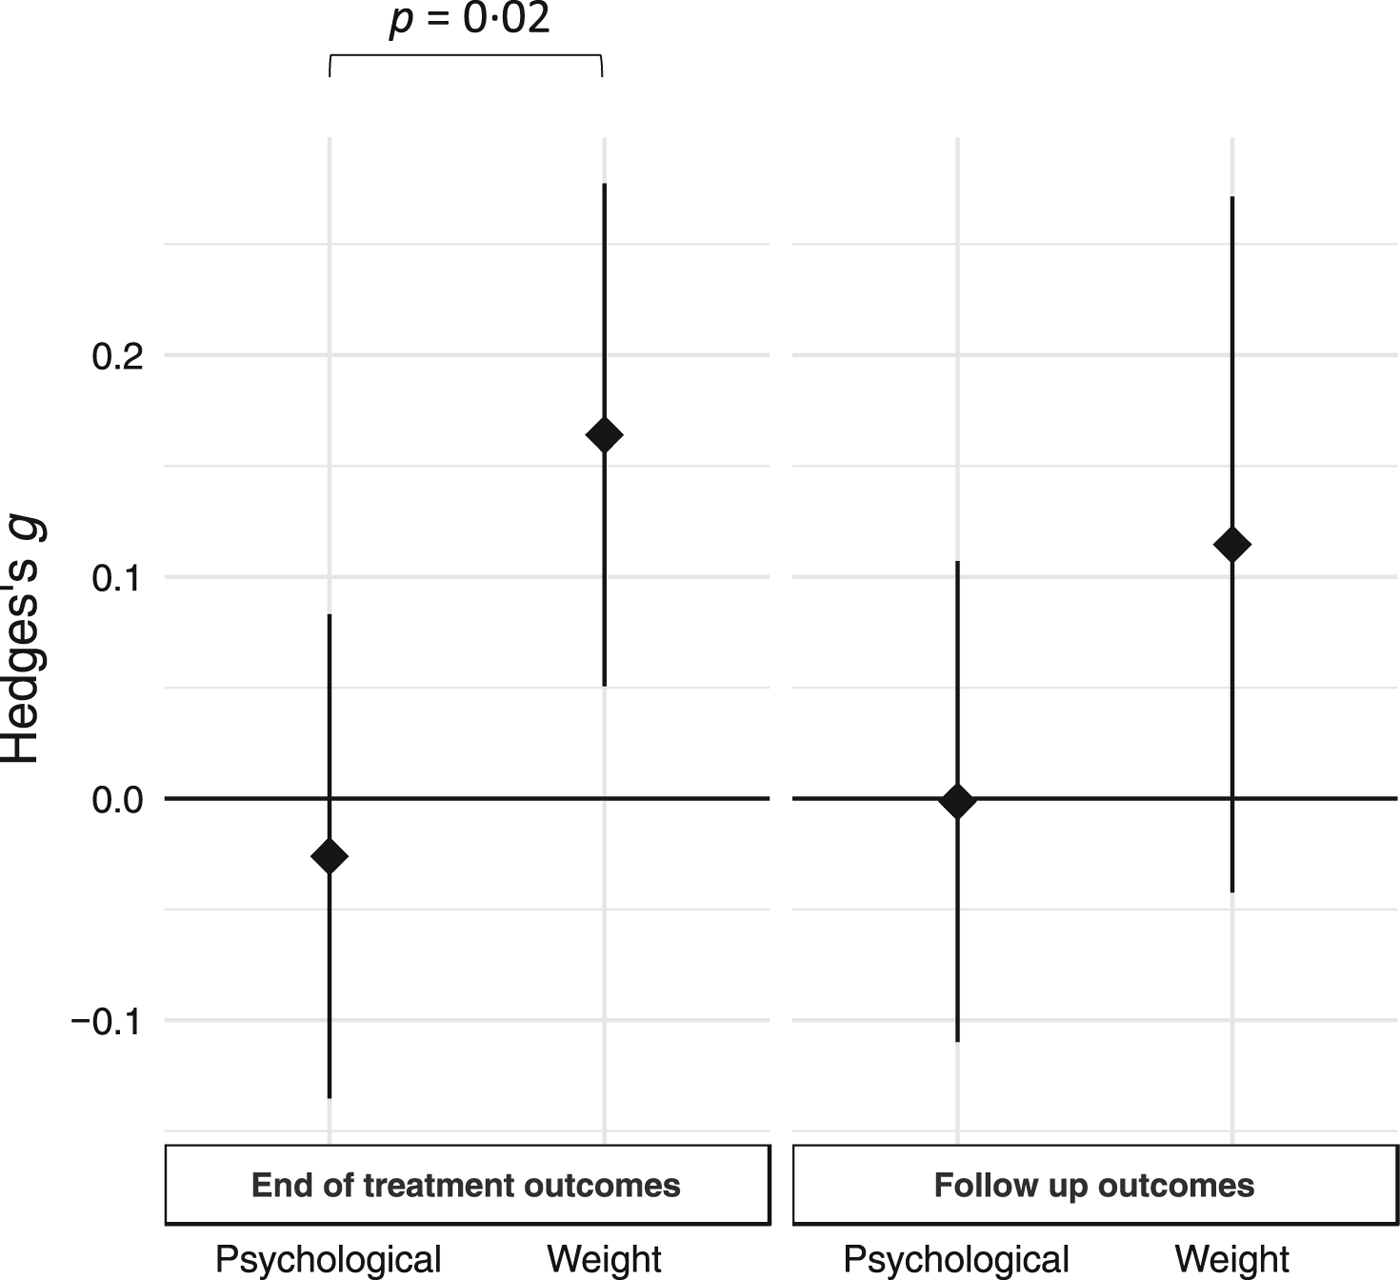
For overall treatment effects, a summary of study effect sizes and variances is presented in Fig. 4. Cluster-robust models revealed a significant treatment effect on weight outcomes at the EOT [g = 0.16, 95% CI (0.05–0.28), p = 0.006]. There was no significant treatment effect on psychological outcomes at EOT [g = −0.03, 95% CI (−0.14 to 0.08), p = 0.63]. At follow-up, there was no significant treatment effect upon weight outcomes [g = 0.11, 95% CI (−0.04 to 0.27), p = 0.15] or on psychological outcomes [g = −0.001, 95% CI (−0.11 to 0.11), p = 0.98]. Heterogeneity between the four models was on the border of statistical significance [F (4,31) = 2.5, p = 0.06]. Contrasts showed that the effects of treatment on weight outcomes at EOT were larger than the psychological outcomes [g = 0.19, s.e. = 0.08; F (1,31) = 5.77, p = 0.02]. There was no significant difference between weight and psychological outcomes at follow-up [F (1,31) = 2.1, p = 0.16]. There was no significant difference in the effect of treatment between EOT and follow-up on psychological outcomes [F (1,31) = 0.18, p = 0.68] or weight outcomes [F (1,31) = 0.92, p = 0.35]. Cluster-robust models indicated no significant treatment effect on drop-out frequency between treatment and comparator groups at EOT [log odds ratio estimate = −0.01, 95% CI (−0.25 to 0.24), p = 0.97] or at follow-up [log odds ratio estimate = 0.04, 95% CI (−0.32 to 0.44), p = 0.81]. There also was no significant difference in drop-out frequency effects between EOT and follow-up [F (1,33) = 0.07, p = 0.79].
Summary effects of treatments on weight and psychological symptoms at EOT and follow-up. Summary effect size estimates are illustrated with 95% confidence intervals derived from cluster-robust meta-analysis, for the effects of treatment upon weight and psychological symptoms at EOT and follow-up, respectively. Positive values represent effects favoring the active treatment, whereas negative values represent effects favoring the comparator treatment. The effect of treatment on weight symptoms at EOT was significantly larger than the effect on psychological symptoms.
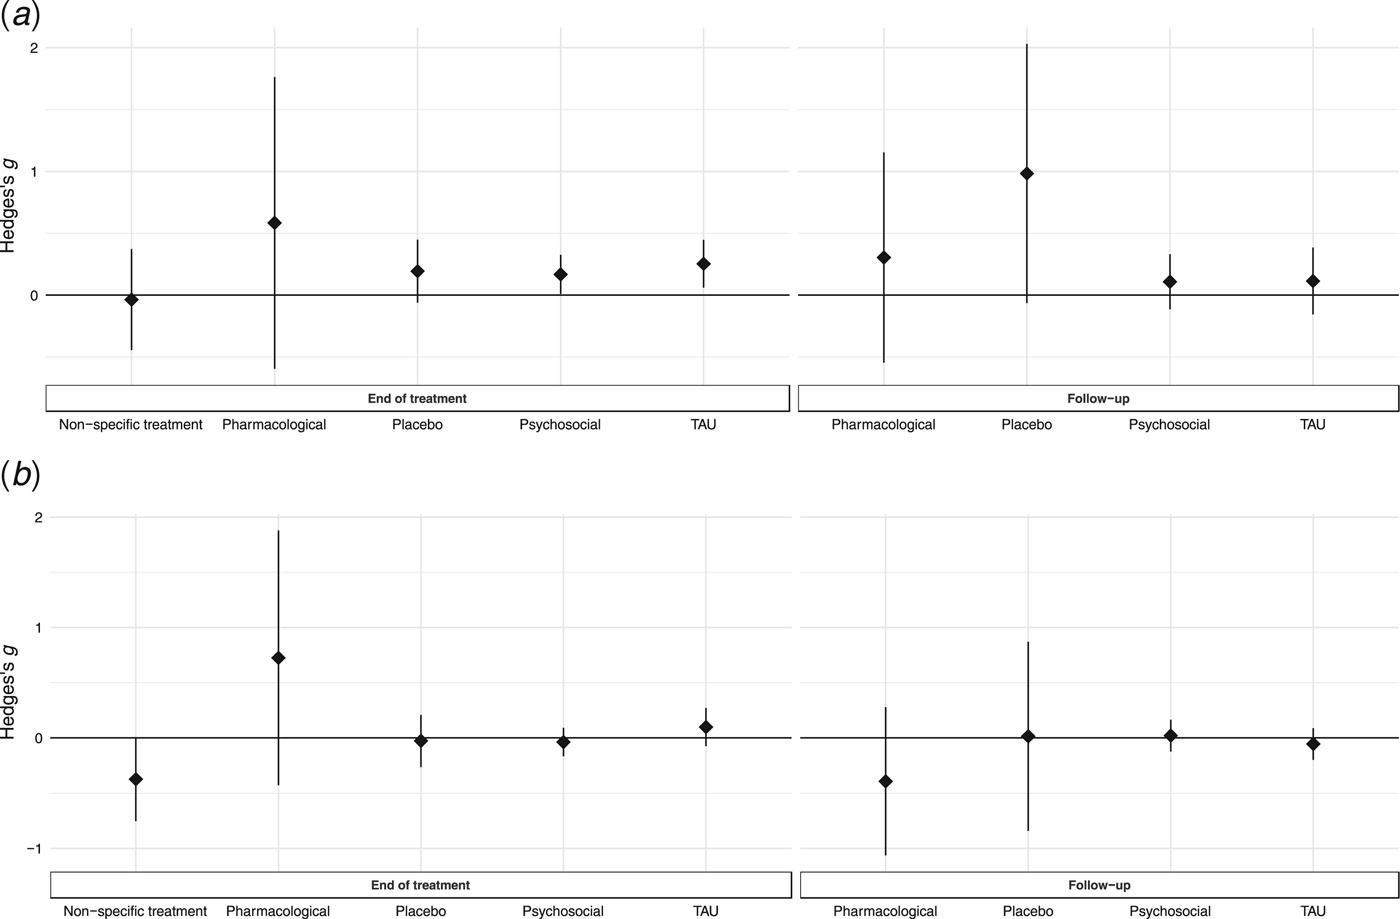
For secondary analysis, separate random-effects models of weight and psychological outcomes at EOT and follow-up were performed to assess the effect of potential moderators (Supplementary Table S3). Weight outcomes [Q(18) = 39, p = 0.003] and psychological [Q(18) = 30.4, p = 0.03] outcomes at follow-up displayed significant heterogeneity. There were no significant moderating effects of illness duration, mean age, year of publication, risk of bias, type of weight outcome, or follow-up time for any of the models (Supplementary Table S4; Supplementary Figs S1 and S2). The moderating effect of treatment type on weight outcomes at EOT was statistically significant [Q M(1) = 4.62, p = 0.03], with psychosocial treatments, relative to their comparator intervention groups [g = 0.13, s.e. = 0.05, p = 0.01], yielding a significantly smaller summary effect size (z = −2.15, p = 0.03) than the other specialized treatment comparisons combined (g = 0.36, s.e. = 0.1, p = 0.0001) (Supplementary Fig. S3). When only comparing psychosocial and pharmacological treatments, there was no statistically significant moderating effect of treatment on weight or psychological outcomes at EOT or follow-up (Supplementary Table S4). There was a statistically significant effect of treatment type on weight outcomes at follow-up [Q M(1) = 6.5, p = 0.01], with psychosocial treatment comparisons (g = 0.07, s.e. = 0.08, p = 0.35) yielding a significantly smaller relative summary effect size (z = −2.55, p = 0.01) than the other specialized treatment comparisons combined (g = 0.6, s.e. = 0.19, p = 0.002). The moderating effect of psychosocial treatment category (family therapy treatment N = 10, individual treatment N = 9, group treatment = 2) on weight outcomes at follow-up was also on the border of statistical significance [Q M(2) = 5.01, p = 0.08]. Only the summary effect size for family therapy treatments (k = 10) was statistically significant (g = 0.25, s.e. = 0.09, p = 0.007). There was no statistically significant moderator effect of comparator category at EOT for weight [Q M(4) = 2.1, p = 0.72] or psychological [Q M(4) = 6.76, p = 0.15] outcomes, or at follow-up for weight [Q M(3) = 2.75, p = 0.43] or psychological [Q M(3) = 1.21, p = 0.75] outcomes (Fig. 5).
Summary effects of comparator group categories on weight and psychological symptoms at EOT and follow-up. Summary effect size estimates with 95% confidence intervals derived from random-effects meta-analysis estimates for compactor group categories on weight (a) and psychological (b) symptoms at EOT and follow-up. Positive values represent effects favoring the active treatment, whereas negative values represent effects favoring the comparator treatment. TAU = treatment as usual.
There was a statistically significant moderating effect of treatment platform on weight outcomes at EOT [Q M(2) = 8.35, p = 0.02]. The summary effect sizes for inpatient (g = 0.6, p < 0.001) and outpatient (g = 0.16, p = 0.004) platforms for weight at EOT were statistically significant. The summary weight outcome for inpatients was significantly larger than the mixed (z = 2.83, p = 0.005) and outpatient (z = 2.68, p = 0.007) outcomes. There was also a statistically significant moderating effect of treatment platform on weight outcomes at follow-up [Q M(2) = 6.34, p = 0.04]. For weight at follow-up, the summary effect size for inpatient studies was statistically significant (g = 0.53, p = 0.01) and the summary effect size for outpatient studies was on the border of statistical significance (g = 0.17, p = 0.06). The summary weight outcome for inpatients was significantly larger than mixed treatment platform outcomes (z = 2.47, p = 0.01). There was no evidence of small study bias for the weight and psychological outcome EOT and follow-up models (Egger's regression test p values > 0.05; Supplementary Table S3). Inspection of contour-enhanced funnel plots revealed no over-representation of effect sizes in the significance contours (Supplementary Fig. S4).
Re-analyzing the primary meta-analysis after removing studies comparing differential doses of the same treatment or nuanced forms of the same treatment (Lock et al., Reference Lock, Agras, Bryson and Kraemer2005; Dalle Grave et al., Reference Dalle-Grave, Calugi, Conti, Doll and Fairburn2013; Herscovici et al., Reference Herscovici, Kovalskys and Orellana2017) revealed similar results. Cluster-robust models revealed a significant treatment effect on weight outcomes at the EOT [g = 0.18, 95% CI (0.06–0.3), p = 0.006]. There was no significant treatment effect on psychological outcomes at EOT [g = −0.01, 95% CI (−0.13 to 0.11), p = 0.86]. At follow-up, there was no significant treatment effect upon weight outcomes [g = 0.12, 95% CI (−0.05 to 0.3), p = 0.15] or on psychological outcomes [g = 0.01, 95% CI (−0.11 to 0.12), p = 0.91]. Heterogeneity between the four models was on the border of statistical significance [F (4,28) = 2.6, p = 0.06]. Contrasts showed that the effects of treatment on weight outcomes at EOT were larger than the psychological outcomes [g = 0.19, s.e. = 0.09; F (1,28) = 4.79, p = 0.04]. There was no significant difference between weight and psychological outcomes at follow-up [F (1,28) = 1.89, p = 0.18]. There was no significant difference in the effect of treatment between EOT and follow-up on psychological outcomes [F (1,28) = 0.91, p = 0.35] or weight outcomes [F (1,28) = 0.07, p = 0.79].
Cochrane risk of bias assessment found that 37% of the included studies had a high risk of random sequence generation bias, 40% had a high risk of allocation concealment bias, 40% had a high risk of detection bias, 63% had a high risk of attrition bias, and 48% had a high risk of reporting bias (Supplementary Tables S5 and S6). Overall, the methodological quality of the included studies was deemed to be low (Supplementary Table S7).
Discussion
This systematic review and meta-analysis represents a comprehensive synthesis of empirical data relating to the treatment of AN, and is the first to grade the methodological quality and risk of bias across RCTs for AN. Importantly, we delineated weight and psychological symptoms, and integrated data relating to psychosocial, pharmacological, medical, and complementary/alternative treatments for AN, all from RCTs, and included all patient age groups. Most trials meeting inclusion criteria were from the year 2000 onwards, when reporting psychological outcomes alongside weight outcomes became more commonplace. Overall, we found that specialized treatments conferred a significant treatment effect over and above comparator treatments in terms of weight-based symptom improvement at EOT, but not at follow-up. In terms of psychological symptom change, specialized treatments did not confer any advantage over comparator treatments at EOT or follow-up. These data indicate a distinct and discrepant trajectory of weight v. psychological AN symptoms throughout treatment, and highlight that current specialized treatments are more adept at altering the course of weight-based AN symptomatology, as opposed to psychological AN symptomatology.
The relatively greater impact of specialized treatments over comparator interventions upon weight-based outcomes at EOT is an important finding when considering the likelihood of starvation-related death in AN, as well as the striking cost of inpatient weight restoration in AN, which in the USA may total up to $321 300 per patient (Guarda et al., Reference Guarda, Schreyer, Fischer, Hansen, Coughlin, Kaminsky, Attia and Redgrave2017). As such, this incremental benefit of specialized interventions in weight-based symptoms confers both clinical and economic advantages. However, this change in weight-based AN symptomatology throughout specialized treatments did not parallel a corresponding shift in psychological AN symptoms; no beneficial effects of these treatments were found in psychological AN symptomatology at EOT, over and above what was demonstrated in comparator treatments. Importantly, psychological symptoms are thought to be central maintaining mechanisms in AN psychopathology (Fairburn et al., Reference Fairburn, Shafran and Cooper1999; DuBois et al., Reference DuBois, Rogers, Franko, Eddy and Thomas2017), and this cluster of cognitions (e.g. overvaluation of shape and weight, fear of weight gain) is hypothesized to drive the behavioral features of AN (e.g. dietary restriction), which in turn drive weight loss. Moreover, with psychological symptoms being a key precursor to treatment dropout (Woodside et al., Reference Woodside, Carter and Blackmore2004) and relapse in AN (Keel et al., Reference Keel, Dorer, Franko, Jackson and Herzog2005), persistent psychological symptomatology, even in the context of improvements in weight-based symptoms, represents a detriment to long-term prognosis.
Relatedly, findings at follow-up suggest no sustained augmentative effect of specialized treatments in terms of weight-based symptom shift, relative to comparator treatments. It is unclear whether this represents a weight loss in specialized treatments between EOT and follow-up, or a greater improvement in weight in comparator treatments between EOT and follow-up, or both, and this important question requires further study. Similarly, no augmentative effect of specialized treatments upon the psychological symptoms of AN was noted at follow-up, relative to comparator treatments. These findings appear to be robust, and extend across all types of control interventions used in the comparisons. Cumulatively, these data suggest that current specialized treatments for AN, while more adept at improving patient weight in the shorter term, are not more effective than comparator treatments in producing sustained benefits in weight status, or in curtailing the psychological symptoms of AN at EOT or follow-up. An important caveat relating to follow-up findings, however, rises from the ambiguity of treatment status beyond EOT in most RCTs. Of all included studies, only about half provided follow-up data, and among those, only one study reported information relating to ongoing treatment engagement across groups beyond EOT. An ethical obligation facing researchers upon the completion of RCTs, in the event of ongoing clinically significant symptoms, relates to the provision of, or referral to, continued care. However, it is unclear in the included RCTs whether those participants requiring ongoing treatment beyond EOT actually engaged in this, and if so, whether the type of follow-up care was similar or discrepant to the treatment received during the trial. The scarcity of these data compromises the interpretation of results beyond EOT, and potentially minimizes differences over the long term. Notwithstanding, these findings raise important questions as to the utility of current specialized treatments in their capacity to allay the psychological symptoms of AN in the short or longer term.
In terms of treatment setting, findings suggest that specialty treatments in mixed treatment settings (i.e. partial hospital programs) do not reliably yield differentiated weight-based symptom outcomes from their comparator treatments, as opposed to specialty treatments in inpatient and outpatient settings, at both EOT and follow-up. This is consistent with the literature suggesting a less well-developed theoretical base and clinical guidelines for treatment in such settings, and the noted difficulty in isolating the active components of treatments over such a protracted duration of treatment exposure (i.e. up to 10 h per day) (Freidman et al., Reference Friedman, Ramirez, Murray, Anderson, Cuasck, Boutelle and Kaye2016). With respect to treatment category, findings suggest that the effects of psychosocial interventions were in fact smaller than treatment effects of other interventions in imparting weight-based symptom change, both at EOT and follow-up. Moreover, treatment category did not moderate the non-significant treatment effects on psychological symptoms at either EOT or follow-up. Among psychosocial treatments, a marginally greater treatment effect on weight outcomes at EOT was demonstrated for family-based therapies, which is consistent with the largely weight-driven focus in these treatments, although this effect did not extend to psychological outcomes. Cumulatively, these results imply that overall, interventions that address purported psychological mechanisms of AN in the most face-valid manner are failing to demonstrate treatment effects over and above comparator treatments. This underscores the need to explicate illness mechanisms and target them in novel, precision interventions.
We found no moderating effect of publication year upon both weight and psychological outcomes, suggesting that specialized treatments are not incrementally improving outcomes, relative to comparator treatments, over time. This is consistent with the platform put forth over a decade ago, that a plateau in treatment efficacy for AN has long been reached (Steinhaussen, Reference Steinhaussen2002; Fairburn, Reference Fairburn2005). These findings underscore the pressing need to elucidate AN mechanisms and develop corresponding precision treatments that may advance clinical outcomes. Additionally, the finding that age, as well as its correlate, illness duration, did not moderate treatment outcome is noteworthy. Current theorizing postulates that prognosis is more favorable for younger AN presentations, and that treatments targeted at adolescents are more efficacious than those targeted at adults (Watson and Bulik, Reference Watson and Bulik2013). However, our findings suggest that adolescents engaging in specialist treatments are not more likely to differentially outperform their counterparts engaging in comparator treatments, relative to adults. Thus, adolescents’ better prognosis is not due to specific specialist treatment effects per se, since the difference between specialist and comparator groups is comparable in both adolescents and adults, and therefore more likely reflects a pervasive prognostic favorability of this age group.
An important challenge in the treatment of AN relates to the high rates of treatment dropout, which typically ranges from 20% to 46% (DeJong et al., Reference DeJong, Broadbent and Schmidt2012). The present study suggests that specialized treatments do not appear to confer any advantages over comparator treatments in treatment acceptability, as expressed by rate of attrition. As such, improving treatment tolerability and patient retention remains an important goal in future treatment development efforts.
Limitations to this meta-analysis include the low methodological quality of included studies, and the elevated risk of bias. However, risk of bias did not emerge as a moderator of treatment effects, and there was no evidence of publication bias. The greatest risk of bias stemmed from inadequately accounting for patient attrition during analyses, and selective reporting, suggesting a greater need for transparency in treatment trials. Moreover, the challenges of conducting RCTs in the context of AN are well known, and inherently extend to conducting meta-analyses in this domain. For instance, the medical complexities which arise rapidly in the context of AN necessitate ethical obligations mandating against waitlist-controlled treatment trials or the withholding of active treatment, and as such, psychosocial treatments have necessarily been compared with a heterogeneous array of active treatments during controlled trials. Heterogeneity in existing treatment approaches compounds this challenge, and while we statistically controlled for the effect of variability in both comparator and specialty treatment type in moderator analyses, this heterogeneity is noteworthy. Lastly, it should be noted that these findings reflect outcomes from RCTs in which both weight and psychological outcomes were reported, and may not reflect findings from studies which did not meet inclusion criteria. These factors ought to be carefully examined in interpreting results in treatment trials in these populations.
Conclusions
Cumulatively, our results point toward discrepant symptom pathways for weight v. psychological symptom shift throughout treatment for AN, which should be independently indexed in treatment trials. Moreover, the absence of a moderating effect of age and illness duration upon these discrepant pathways points toward a robustness of these pathways, irrespective of such patient characteristics. Specialized psychosocial treatments appear less able to alter the course of weight-based symptoms in AN, relative to other specialized treatments, although all specialized treatments do not appear to additively alter the course of psychological symptomatology above what is demonstrated in treatment as usual, control, or placebo groups. More broadly, these results question the utility of focusing on weight-based symptom remission as the terminal goal of treatment in AN. Clearly, while weight restoration remains the most proximal goal of treatment in offsetting the medical effects of starvation, it should not be expected that weight gain alone will ultimately confer commensurate psychological symptom remission. As precision medicine initiatives gain momentum, it is imperative that the core mechanisms underpinning psychological AN psychopathology are identified and examined. Future treatment development efforts ought to adopt a specific focus on the more rapid relief of psychological AN pathology, such that the mechanisms by which they drive behavioral symptoms may be targeted and ameliorated throughout treatment.
Supplementary material
The supplementary material for this article can be found at https://doi.org/10.1017/S0033291718002088
Acknowledgements
This research was supported by the National Institute of Mental Health (K23 MH115184), the Novo Nordisk Foundation (NNF160C0019856), and the Australian National Health and Medical Research Council (1121538).
Conflict of interest
SBM reports royalties from Routledge and Oxford University Press. KLL reports royalties from Routledge and consulting fees from the Training Institute for Child and Adolescent Eating Disorders. DLG reports royalties from Guilford Press, and Routledge, and is Co-Director of the Training Institute for Child and Adolescent Eating Disorders, LLC.



