Introduction
Defining and measuring compassion
Interest in the scientific study of compassion has rapidly grown over the last two decades (Kirby and Gilbert, Reference Kirby, Gilbert and Gilbert2017); however, there remains no consensus on what compassion is, and various definitions and means of assessment exist (Strauss et al., Reference Strauss2016). In some conceptualizations, compassion is understood as an affective experience and a distinct emotion in itself (Goetz et al., Reference Goetz, Keltner and Simon-Thomas2010), whereas others define it as a complex multifaceted construct (Strauss et al., Reference Strauss2016). Further still, other conceptualizations assume an evolutionary perspective, including Gilbert (Reference Gilbert2014), the founder of compassion-focused therapy, who proposes that compassion is an evolved caring motivational system. Drawing on the perspectives of evolutionary psychology, neuroscience, and theories of social mentality and attachment, Gilbert (Reference Gilbert2014) hypothesizes that compassion is understood as an interactive three-way flow (involving Compassion for Self, Compassion to Others, and Compassion from Others) that evolved to regulate negative affect via the affiliative/soothing system associated with secure attachment and pro-social behavior. Within this conceptualization, compassion is defined as: “a sensitivity to suffering in self and others, with a commitment to try to prevent or alleviate it” (Gilbert, Reference Gilbert2014, p. 19). This definition specifically covers the two dimensions of psychological motivational processing, that of attention/engagement (i.e. sensitivity to suffering) and action (i.e. commitment to prevent or alleviate suffering). These two dimensions are referred to as the first and second psychologies of compassion and, within each, specific competencies are outlined as necessary for all three compassion orientations. For the first psychology of compassion – “compassionate engagement” – the following six competencies are identified as key attributes required to engage with suffering: care for well-being (i.e. motivation and willingness to care and respond to suffering); sensitivity (i.e. responding to needs when required); distress tolerance (i.e. tolerating difficult emotions without becoming overwhelmed); sympathy (i.e. showing emotional resonance to suffering); empathy (i.e. sharing and attuning to others’ emotions); and non-judgment (i.e. accepting and tolerating without condemning). For the second psychology of compassion – “compassionate action” – the following six competencies are the transformative skills necessary to help alleviate the suffering: attention (e.g. attention training, mindfulness practice); reasoning (e.g. cognitive re-appraisal); behavior (e.g. gratitude exercises); feeling (e.g. showing positive or negative emotions, as the situation depends); imagery (e.g. guided imagery exercises); and sensory (e.g. breathing practices, posture).
Gilbert et al. (Reference Gilbert2017) have operationalized this definition of compassion for measurement via the Compassionate Engagement and Action Scales (CEAS), which includes scales for assessment of Compassion for Self, Compassion to Others, and Compassion from Others. Within all 3 scales, 10 of the 12 competencies are represented as individual scale items; however, no items represent the sensory or imagery competencies, as these experiences were considered too vague to include as items (Gilbert et al., Reference Gilbert2017). Within the original development study (Gilbert et al., Reference Gilbert2017), the factor structure of the CEAS was validated in two languages (English and Portuguese) in three samples of university students from the U.K., U.S.A., and Portugal. Using exploratory and then confirmatory factor analysis, the CEAS demonstrated acceptable levels of reliability and validity, and findings confirmed that the three orientations of compassion could each be measured as either three single factor scales, or as subscales measuring aspects of compassionate “engagement” and “actions”.
Although still relatively recent in terms of development, the CEAS are beginning to be used within compassion-focused research. In general population samples from Australia and Singapore (Steindl et al., Reference Steindl, Matos and Creed2018; Steindl et al., Reference Steindl, Yiu, Baumann and Matos2019), and in caregivers of people with lung cancer in Taiwan (Hsieh et al., Reference Hsieh, Yu, Chen, Chen, Chang and Hsiao2019), the CEAS have performed acceptably, with good levels of internal reliability reported (Cronbach’s α from .79 to .95). In contrast, a recent study conducted with female survivors of intimate partner violence in Colombia reported excluding the CEAS as a planned outcome measure, as participants did not understand multiple items during piloting (Naismith et al., Reference Naismith, Ripoll and Pardo2020). Such findings highlight the importance of testing a scale’s performance within a new population to validate its appropriateness for use. Further, aside from the original development study by Gilbert et al. (Reference Gilbert2017), no other research is known to have confirmed the factor validity of the CEAS in the English language. It is, therefore, opportune to explore their psychometric performance within a new, independent sample.
Family carers of older adults
Extensive research shows that caring for a family member over the age of 65 years can be challenging and stressful (Adelman et al., Reference Adelman, Tmanova, Delgado, Dion and Lachs2014; Schulz and Sherwood, Reference Schulz and Sherwood2008). In comparison to non-caregiving populations, family carers of older adults are more likely to report both psychological and physical health problems, and higher levels of burden, social isolation, and loneliness (Carers UK, 2019; del-Pino-Casado et al., Reference del-Pino-Casado, Rodríguez Cardosa, López-Martínez and Orgeta2019; Whittaker and Gallagher, Reference Whittaker and Gallagher2019). Although a range of services are currently available to support carers in their role, the need for better access to professional support, particularly at the level of emotion regulation to aid coping and stress management, has been highlighted (Silva et al., Reference Silva, Teixeira, Teixeira and Freitas2013). Psychological interventions that seek to cultivate compassion have shown potential benefits for various populations on a number of outcomes, including depression, anxiety, psychological distress, and well-being (Kirby et al., Reference Kirby, Tellegen and Steindl2017). Early findings from studies with family carers of older adults also show similar promise, with the cultivation of compassion seeming to help modify carer stress through facilitating healthy emotion regulation (Collins et al., Reference Collins, Gilligan and Poz2018; Lloyd et al., Reference Lloyd, Muers, Patterson and Marczak2019; Hlabangana and Hearn, Reference Hlabangana and Hearn2019). Notably, however, none of these early studies have measured compassion via the CEAS and, thus, their performance validity is currently unknown within the population context of family carers of older adults.
The purpose of this study was to confirm the factor validity of the CEAS when used with a sample of family carers of older adults, with a view to assisting gerontological researchers and clinical practitioners in making informed evidence-based decisions around the assessment of compassion. A series of confirmatory factor analyses were undertaken to test the proposed factor solutions of each scale – as set out in the original CEAS development study by Gilbert et al. (Reference Gilbert2017) – and to assess how well each solution fitted the sample data. Confirmatory factor analysis is a measurement model that tests the relationship between observed manifest variables and unobserved latent variables (i.e. scale items to theoretical constructs). For this reason, confirmatory factor analysis is used to confirm or reject hypothesized factor structures of multi-item, multi-subscale instruments (Byrne, Reference Byrne2010).
Method
Participants and procedure
This confirmatory factor analysis of the CEAS was nested within a larger cross-sectional survey study that aimed to explore the relationship between compassion (measured via the CEAS) and the mental health and well-being of family carers of older adults. Participants completing the CEAS had to meet the larger survey study’s inclusion criteria: aged 18 years or older; providing regular, ongoing, unpaid care to a family member, friend, or neighbor over the age of 65 years; and able to read and write in English. Participants were recruited through: promotion via advocacy services, and community and volunteer organizations and networks (i.e. e-newsletters, social media posts, and discussion at meetings); face-to-face presentations at carer support groups and information sessions; known individuals and carer advocates; social media (i.e. Facebook carer support groups, Twitter); print newspaper advertisements; radio interviews; and word-of-mouth. The survey was available online (hosted through LimeSurvey GmbH, Hamburg, Germany), via hard copy with a prepaid return, or through a verbal interview with the lead author.
The survey underwent two rounds of piloting with family carers in June 2019 (n = 3 round one; n = 4 round two). After round one, minor edits were made to the introductory text and response options for two demographic items. No further changes were made to the survey after round two, and these pilot data (n = 4) are included as part of the final sample. The cross-sectional survey was open for a 6-month period from July to December 2019.
Ethical approval was obtained from Griffith University Human Research Ethics Committee (GU Ref. no. 2019/481). At the time of completion, all participants were provided with written information about the survey and notified that completion constituted formal consent. Participants were informed that their responses were anonymous and that they were free to stop at any time. The CEAS were placed at the start of the survey after demographic items and were the first self-report scales that participants completed. The survey was estimated to take 30 minutes and, to minimize burden, participants were encouraged to take breaks during completion. Written reminders to pause completion appeared at two points during the survey, and a save-and-return function was enabled in the online version. Given that the focus of the larger cross-sectional survey was on the mental health and well-being of carers, a link to global online mental health resources was provided, as well as the contact details for individual support organizations around the world.
Measures
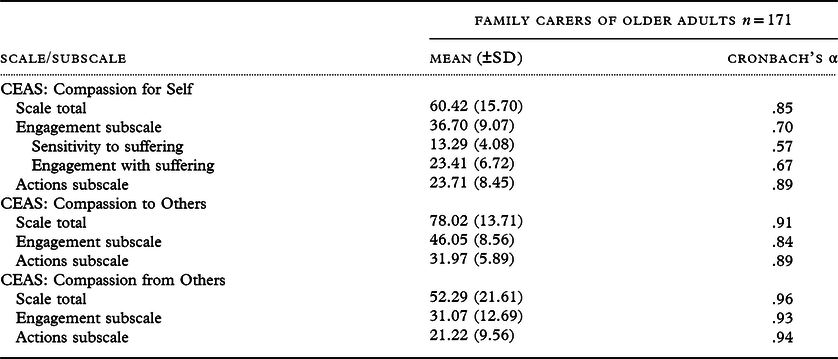
Originally produced in English, the CEAS (Gilbert et al., Reference Gilbert2017) is a collection of three, 13-item measures that individually assess compassion in terms of the three flows, namely Compassion for Self, Compassion to Others, and Compassion from Others. Each scale is divided into two sections to measure the first and second psychologies of compassion, respectively: compassionate “engagement” and “actions”. Within the scale measuring Compassion for Self, there is also the option to analyze two additional dimensions within “engagement”, that of “sensitivity to suffering” and “engagement with suffering”. Three reverse “filler” items are also included in each scale to mitigate the impact of response bias (items 3 and 7 in “engagement”; item 3, referred to as item 11 in this study, in “actions”), and these items are excluded from scoring. All scales use a 10-point Likert scale (1 = “never” to 10 = “always”) to assess the frequency of each item’s occurrence. When summated, these form total scale and subscale scores; higher scores represent higher levels of compassion. Within the original development study (Gilbert et al., Reference Gilbert2017), the CEAS showed reasonable construct validity (including convergent validity) with other established measures of compassion and demonstrated good internal reliability (Cronbach’s α from .67 to .94). Descriptive statistics and internal consistencies of the CEAS within the current study are provided in Table 1. These are largely comparable to those reported by Gilbert et al. (Reference Gilbert2017).
Descriptive statistics and internal consistencies of the three CEAS

Within all scales, items were rated using a 10-point Likert response scale, whereby 1 = never and 10 = always. Higher scores represent higher levels of compassion.
CEAS = Compassionate Engagement and Action Scales.
A range of demographic and caregiving-related data about the family carer and the older adult care recipient were collected (see Table 2).
Demographic and caregiving profile of participants

Continuous variables are reported as mean and standard deviation (±SD). Categorical variables are reported as n (%). Frequencies and proportions may not add up to n = 171 and 100% due to missing data, rounding, or multiple response options.
Data analyses
A sample of n = 189 family carers of older adults completed the CEAS (n = 169 online, including n = 4 in round two of piloting; n = 20 printed hard copy). These data were entered into IBM SPSS Version 26 (IBM Corp, Armonk, NY) for analysis. The online survey automatically produced an SPSS data file, thereby eliminating the need for data entry checks; however, the accuracy of all manually entered data from hard copy surveys was rechecked against raw data. Basic descriptive statistics were produced for all variables to explore missing values and to check the initial spread of responses. On inspection, n = 13 cases did not meet all participant inclusion criteria, and a further n = 5 cases had excessive amounts of missing data (defined as >20% data missing across the three CEAS, with amounts ranging from 23.3% to 60%). These cases were removed. Within the final sample of n = 171, missing values analyses showed small amounts of missing data (across CEAS = .9%; Compassion for Self = .6%; Compassion to Others = .4%; Compassion from Others = 1.7%). These data appeared to be Missing Completely at Random (Little’s MCAR test: across CEAS p = .304; Compassion for Self p = .330; Compassion to Others p = .406; Compassion from Others p = .353) and could be approximated with a normal distribution (i.e. no instances of observed univariate skewness >2.0 and kurtosis >7.0 (Curran et al., Reference Curran, West and Finch1996)). Based on this data profile, the expectation–maximization algorithm was deemed appropriate to impute missing values on the CEAS (Bennett, Reference Bennett2001). No imputation was applied to demographic variables. CEAS totals and subscale totals were calculated, and descriptive statistics and internal consistency estimates (Cronbach’s α) were produced. Bivariate correlations were also undertaken to assess, within each scale, the level of association between total and subscales.
To confirm the factor validity of the three CEAS, a series of confirmatory factor analyses were conducted in the manner described in the original development study (i.e. higher-order factor analysis) using the structural equation modeling program, IBM SPSS AMOS Version 26.0 (IBM Corp, Armonk, NY). Model parameters were estimated using maximum-likelihood methods due to the normal distribution of data (Kline, Reference Kline2015). In determining the extent to which each proposed model fitted the sample data, parameter estimates were first inspected for feasibility and acceptability (loadings of ±.40 or greater (Yang, Reference Yang and Salkind2010)), appropriateness of standard errors, and statistical significance (p < .05). Goodness-of-fit statistics were inspected, as were standardized residual covariances for signs of potential model misspecification. Goodness-of-fit indices were chosen based on their stability and performance when used with sample sizes of less than n = 200 (Brown, Reference Brown2015; Byrne, Reference Byrne2010). Further, as recommended when conducting confirmatory factor analyses with smaller samples, multiple fit indices were considered in relation to model fit under absolute, parsimonious, and comparative conditions, and indices cutoffs were interpreted using close to rather than definitive thresholds (Brown, Reference Brown2015; Hu and Bentler, Reference Hu and Bentler1999). With this in mind, the following five goodness-of-fit indices, and their respective criteria for good levels of model fit, were applied (Byrne, Reference Byrne2010). For statistical model fit, the Chi square statistic was used with nonsignificant values of p > .05 indicating good levels of fit (Byrne, Reference Byrne2010). However, given that this statistic is known to be problematic in fitting real-world data, with significant results often found even in well-fitting models (Byrne, Reference Byrne2010), a number of pragmatic indices were also used. These indices and their desired values are as follows: normed Chi square statistic (χ 2/df) of less than 3 but no greater than 5 (Wheaton et al., Reference Wheaton, Muthen, Alwin and Summers1977); standardized root mean square residual (SRMR) of <.08 (Hu and Bentler, Reference Hu and Bentler1999); comparative fit index (CFI) of close to or between .90 and .95 (Brown, Reference Brown2015); and parsimony comparative fit index (PCFI) expected around >.50 when CFI are within the specified range of close to or between .90 and .95 (Byrne, Reference Byrne2010). It should be noted that, given their known sensitivity to smaller samples and resulting tendency to over-reject true population models, the often reported Tucker–Lewis index (TLI), root mean-squared error of approximation (RMSEA), and goodness-of-fit index (GFI) were not used to assess model fit for any of the conducted confirmatory factor analyses (Hu and Bentler, Reference Hu and Bentler1999). Finally, evidence of model misspecification was explored via inspection of each model’s standardized residual covariances (which are comparable to Z-scores and represent the estimated number of standard deviations from zero residuals if perfect model fit was achieved). A cutoff of >2.58 was used to indicate statistically significant discrepancy suggestive of necessary post hoc model modification (Joreskog and Sorbom, Reference Joreskog and Sorbom1993).
Results
Sample characteristics
The demographic and caregiving profile of participants is shown in Table 2. Overall, participants completing the CEAS had a mean age of 59.4 (±11.5) years, were female (87.7%), lived in Australia (76.0%), had post-secondary qualifications (either certificate/diploma 42.9% or university degree or higher 43.5%), and were either retired (39.2%) or in some form of employment (34.5%). Most were primary carers (86.0%), who lived full-time (64.9%) with either a parent (54.4%) or partner (31.0%) and had been in the caregiving role for more than 3 years (68.1%). The majority of participants provided care to a female (58.5%), with an average age of 80.9 (±8.8) years, and who were most likely to have Alzheimer’s disease or dementia (62.6%), a musculoskeletal disorder (33.9%), and/or cardiovascular disease (19.3%).
Confirmatory factor analyses
CEAS: Compassion for Self
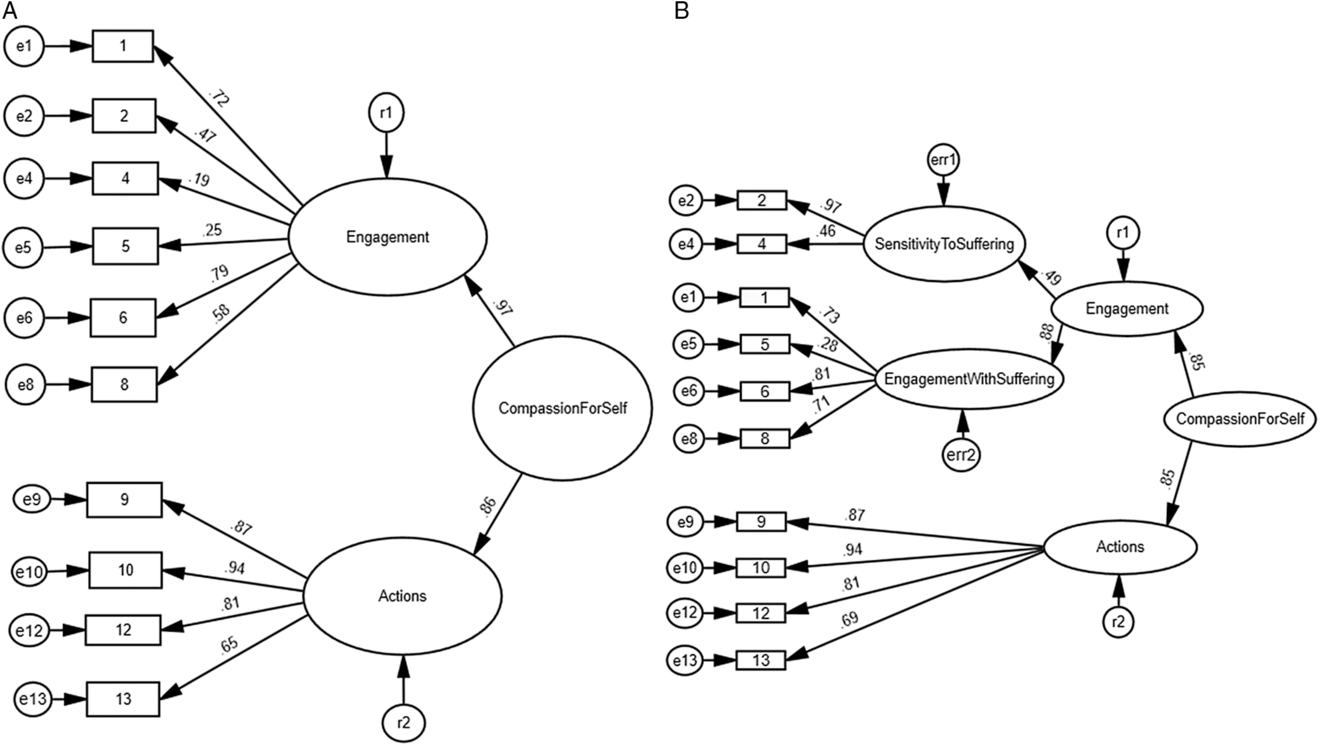
For the CEAS Compassion for Self scale, two models were tested for fit, as consistent with the original theoretical and empirical evidence presented by Gilbert et al. (Reference Gilbert2017). In the first model, two first-order latent factors (“engagement” and “actions”) were loaded onto the second higher-order latent factor of Compassion for Self. This proposed construct of Compassion for Self as dimensions of “engagement” and “actions” was supported, with significant positive correlations found between “engagement” and “actions” (r = .605, p < .001), as well as between Compassion for Self and “engagement” (r = .903, p < .001) and “actions” (r = .888, p < .001). In general, goodness-of-fit indices showed a reasonable fit between the model and the observed data (see Table 3). Although the statistical fit was not achieved (χ 2 = p < .001) – a result not unexpected given the reported problematic nature of this statistic in fitting real-world data (Byrne, Reference Byrne2010) – pragmatic indices were all within the applied cutoff values indicative of reasonable model fit. Parameter estimates (see Figure 1A) were all statistically significant at p < .05, although standardized loadings for items 4 and 5 were notably weak (.19 and .25, respectively), and there was no sign of model misspecification when looking at the standardized residual covariances (values all <2.58). As such, no post hoc modifications were undertaken, and a two-factor solution was supported.
Models of fit summaries from the confirmatory factor analyses of the three CEAS

Note. CEAS = Compassionate Engagement and Action Scales; χ 2 = Chi square statistic, with desired values of p > .05 (nonsig.); df = degrees of freedom; p = p-value; χ 2/df = normed Chi square statistic, with desired values of <3 but no >5; SRMR = Standardized root mean square residual, with desired values of <.08; CFI = Comparative fit index, with desired values of close to or between .90 and .95; PCFI = Parsimony comparative fit index, with values expected around >.50 when CFI are within the specified range of close to or between .90 and .95.
Standardized parameter estimates from the confirmatory factor analyses of the Compassionate Engagement and Action Scales with (A) Compassion for Self two-factor solution and (B) Compassion for Self three-factor solution. Rectangles represent the 10 items comprising the scale, ovals represent the latent factors, and circles represent error and residual variances.

In the second model, a three-factor solution was tested seeing the “engagement” factor analyzed in terms of its two proposed dimensions (“sensitivity to suffering” and “engagement with suffering”). Specifically, the two first-order latent factors (“sensitivity to suffering” and “engagement with suffering”) were loaded onto the second-order latent factor of “engagement” that, along with the factor of “actions”, was then loaded onto the third-order factor of Compassion for Self. Appropriateness of this construct structure was confirmed with significant correlations between all subscales, and between all subscales and the total scale score: “engagement” and “sensitivity to suffering” (r = .726, p < .001); “engagement” and “engagement with suffering” (r = .909, p < .001); “sensitivity to suffering” and “engagement with suffering” (r = .372, p < .001); “sensitivity to suffering” and “actions” (r = .182, p < .05); “engagement with suffering” and “actions” (r = .705, p < .001); and “sensitivity to suffering” and Compassion for Self (r = .517, p < .001); “engagement with suffering” and Compassion for Self (r = .905, p < .001). As shown in Table 3, the goodness-of-fit indices indicated a reasonable fit for the three-factor model and the observed data, particularly from a pragmatic perspective, and were comparable to the two-factor model. Parameter estimates (see Figure 1B) were all statistically significant (all p < .05), although item 5 still indicated weak loading (.28), and no issues were apparent with the standardized residual covariances (all <2.58). Given these data, post hoc modifications were not deemed necessary, and this three-factor solution was supported.
CEAS: Compassion to Others
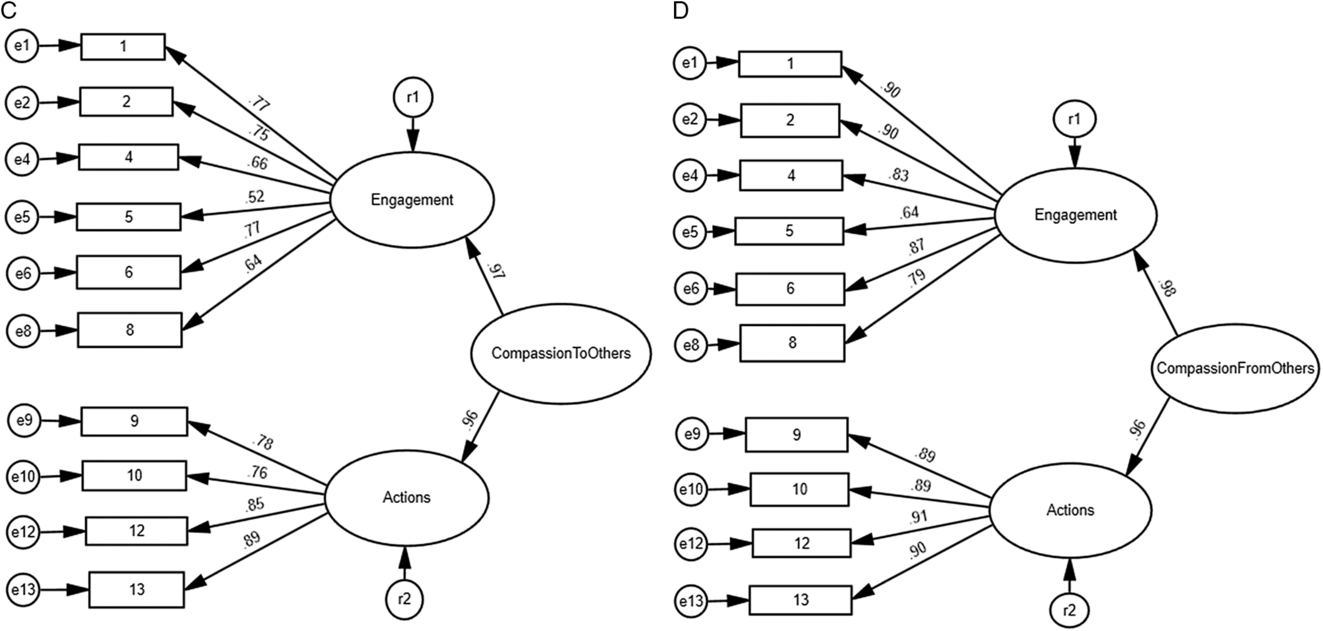
For the CEAS Compassion to Others scale, the two-factor solution proposed by Gilbert et al. (Reference Gilbert2017) was tested, seeing the two first-order latent factors (“engagement” and “actions”) loaded onto the second higher-order latent factor of Compassion to Others. This proposed construct of Compassion to Others as dimensions of “engagement” and “actions” was supported, with significant positive correlations found between “engagement” and “actions” (r = .793, p < .001), as well as between Compassion to Others and “engagement” (r = .965, p < .001) and “actions” (r = .925, p < .001). As presented in Table 3, the pragmatic goodness-of-fit indices showed generally reasonable fit between the model and the observed data, although these tended toward the marginal close to ranges rather than definitive indices cutoffs, and statistical fit was not achieved. The parameter estimates shown in Figure 2C were all statistically significant at p < .05 and above the desired cutoff of .40; however, item 5 again had the weakest loading of all items (.52). Analysis of the standardized residual covariances suggested no concern for model misspecification (values all <2.58), deeming post hoc modifications unnecessary, and the model supportive of a two-factor solution.
Standardized parameter estimates from the confirmatory factor analyses of the Compassionate Engagement and Action Scales with (C) Compassion to Others two-factor solution and (D) Compassion from Others two-factor solution. Rectangles represent the 10 items comprising the scale, ovals represent the latent factors, and circles represent error and residual variances.

CEAS: Compassion from Others
For the CEAS Compassion from Others scale, the two-factor solution originally proposed by Gilbert et al. (Reference Gilbert2017) was tested in which two first-order latent factors (“engagement” and “actions”) were loaded onto a second higher-order latent factor of Compassion from Others. Support for the proposed construct of Compassion from Others as dimensions of “engagement” and “actions” was evidenced in significant positive correlations between “engagement” and “actions” (r = .883, p < .001), as well as between Compassion from Others and “engagement” (r = .978, p < .001) and “actions” (r = .961, p < .001). Goodness-of-fit indices indicated acceptable-to-good levels of model fit to the observed data (see Table 3), with pragmatic indices found within the desired cutoff ranges. Parameter estimates were also all significant (see Figure 2D), although item 5 again had the weakest loading (.64), and standardized residual covariances were all within the desired range of <2.58. These data were considered supportive of a two-factor solution, and no post hoc modifications were undertaken for model misspecification.
Discussion
This study used confirmatory factor analyses to test the factor structures of the CEAS, as proposed by Gilbert et al. (Reference Gilbert2017), within an international sample of n = 171 family carers of adults aged 65 years or older with a broad range of health conditions. To the best of our knowledge, this is the first study to use the CEAS within this population and is the first independent study conducted, post-scale development, to examine the proposed factor structures.
Overall, findings from the confirmatory factor analyses lend preliminary support for the CEAS as measures of Compassion for Self, Compassion to Others, and Compassion from Others, with results largely consistent with the factor solutions proposed by Gilbert et al. (Reference Gilbert2017). Within all three orientations, there was support for the measurement of compassion as an overarching construct made up of the dimensions, “engagement” and “actions”. Specifically, we found positive and significant correlations between total and subscales within each scale, and all the two-factor solutions that we tested showed pragmatically acceptable levels of fit, significant factor loadings, and no evidence of model misspecification. There were also good-to-excellent levels of internal reliability for each scale when measuring compassion using total scores and when using the two subscales of “engagement” and “actions” (Cronbach’s α ranging from .70 to .96).
For the scale of Compassion for Self, there was also some support for the three-factor solution proposed by Gilbert et al. (Reference Gilbert2017), whereby “engagement” was delineated further into two dimensions: “sensitivity to suffering” and “engagement with suffering”. This three-factor solution fitted the data at a similarly acceptable level to the two-factor solution. We, therefore, recommend that both the two- and three-factor solutions can appropriately measure Compassion for Self and suggest that the choice of the solution selected should depend on alignment with the aims and purpose of assessment. Nevertheless, when using this three-factor solution, the internal reliabilities of these two additional dimensions were on the low side of acceptability (Cronbach’s α “sensitivity to suffering” = .57; “engagement with suffering” = .67). In addition, there was also a particularly weak factor loading for item 5 (“I tolerate the various feelings that are a part of my distress”: standardized parameter estimate = .28); and this was also the weakest loading item across all scales (standardized parameter estimates for Compassion to Others = .52, and Compassion from Others = .64). Issues with items measuring aspects of tolerating distress have been reported in previous research exploring compassion, to both self and others (Gu et al., Reference Gu, Cavanagh, Baer and Strauss2017), whereby a similar pattern to our results was reported: weak factor loadings, despite good model fit indices and significant factor loadings. Gu et al. (Reference Gu, Cavanagh, Baer and Strauss2017) recommended further work to explore whether their findings were representative of item-level issues, or whether they represented wider factor-level issues around including tolerating within conceptualizations of compassion. In this subsequent research to develop a new measure of compassion (Gu et al., Reference Gu, Baer, Cavanagh, Kuyken and Strauss2019) – the Sussex-Oxford Compassion Scales – no issues were found for newly generated items representing the factor “tolerating” (which suggested that previous findings were item-level and not factor-level issues), and the factor was maintained in their five-dimensional understanding of compassion.
Within the context of our study findings, the CEAS represent distress tolerance by a single item – item 5. The weak factor loading may be indicative of an issue with this item specifically (although the acceptable pragmatic model-of-fit statistics, significant factor loadings, and absence of model misspecification make this interpretation less clear and are also the reasons why we did not seek to exclude this item in post hoc model modifications). Additional exploratory work would be helpful to determine whether issues such as inadequate wording of the item contributed to the low factor loading. Yet, it is certainly notable that we found a similar issue to another study – and which used a different measure of compassion – around the aspect of distress tolerance. Further work is warranted to explore the specific association between tolerating uncomfortable feelings and conceptualization of the three orientations of compassion.
Limitations
In interpreting these study findings, a number of limitations should be kept in mind. First, a sample of less than 200 is considered small for conducting confirmatory factor analyses, and a sample of 210 would have been desirable for each model that we tested (based on 10 for each of the 21 distinct parameters to be estimated (Byrne, Reference Byrne2010)). Nevertheless, to ensure that we did not produce over-specified models based on the idiosyncrasies of a smaller-than-desirable sample, a pragmatic approach was used to guide the analysis and interpretation (Reference BrownBrown, 2015; Byrne, Reference Byrne2010). Specifically, this included the decision to use sample-sensitive goodness-of-fit tests that covered multiple measures of fit in terms of absolute, parsimonious, and comparative conditions and to use close to rather than absolute indices cutoffs (Brown, Reference Brown2015; Byrne, Reference Byrne2010; Hu and Bentler, Reference Hu and Bentler1999). Second, there is evidence that surveys completed in different response formats (i.e. online or paper and pencil) can produce different results (Zhang et al., Reference Zhang, Kuchinke, Woud, Velten and Margraf2017). Within this study, the vast majority of survey responses were completed online, and a minority were completed by hand. Findings may have been different, therefore, if other response methods were used to complete the survey, and particularly for methods other than online completion.
Implications
In terms of future research, additional studies are needed to build on these promising findings and confirm the results we found in this study when using a larger sample. In doing so, researchers should also consider the psychometric performance of the CEAS more broadly, exploring the convergent validity of the scale when compared with other scales that measure compassion. In addition, studies should consider exploring the unique effect of different participant factors on the scales’ performance. Within transactional models of caregiver stress, background and contextual factors (e.g. characteristics of the carer), as well as the type of stressor (e.g. care needs of the care recipient) and, more recently, cultural- and ethnicity-based values, have been shown to influence carers’ stress (Reference Knight and SayeghKnight and Sayegh, 2010; Lazarus and Folkman, Reference Lazarus and Folkman1984; Pearlin et al., Reference Pearlin, Mullan, Semple and Skaff1990). As such, future studies would benefit from either being more targeted in their recruitment of participants with specific demographic or clinical profiles or by seeking to recruit large enough samples to accommodate more nuanced analyses. Finally, greater exploration of item 5 is needed within the CEAS, which measures the aspect of distress tolerance. Studies using confirmatory factor analyses with larger samples may, if indicated as appropriate by their sample data, consider excluding item 5 in post hoc model modifications to determine if the model fit is improved. Further, given that issues around the measurement of tolerating has been found in other compassion scale studies (Gu et al., Reference Gu, Cavanagh, Baer and Strauss2017), we also recommend additional qualitative work should be undertaken to delve further into understanding how tolerating uncomfortable feelings fits within conceptualizations of the three orientations of compassion.
The cultivation of compassion is a rapidly growing area of scientific inquiry in the field of mental health and adaptive emotion regulation, and it is newly emerging in terms of informal carers of older adults (Murfield et al., Reference Murfield, Moyle and O’Donovan2019). As such, it is important that gerontological researchers and clinical practitioners have evidence-based data that they can use to help their decisions around if, and how, they might assess compassion within family carers of older adults. This study reports the first known data on the factor validity of the CEAS and provides preliminary evidence to support their use as two-factor solutions for all scales, as well as the three-factor solutions for the scale Compassion for Self. To date, no other suite of scales is available to measure all three orientations of compassion together, making these early findings particularly helpful to those interested in exploring compassion as it relates to the three flows.
Conclusion
This study provides promising support for the use of the CEAS with family carers of older adults. Further research is recommended to explore the psychometric performance of the scales in larger samples, as well as further exploration of distress tolerance within conceptualizations and measurement of compassion.
Conflict of interest
None.
Description of authors’ roles
J. Murfield conceived and designed the study, undertook all data collection and statistical analysis, and wrote, revised, and finalized the paper. W. Moyle and A. O’Donovan supervised the study, providing advice in aspects of study design and data collection, and conceptually commented on and revised the paper. R. Ware provided statistical advice on data analysis and conceptually commented on and revised the paper.
Acknowledgments
This work was supported by a Griffith University Postgraduate Scholarship. Thanks are expressed to the organizations, services, and online support groups who assisted with the promotion of the survey, and to the family carers who took the time to complete the survey.