Voters often use information shortcuts to form their political judgment and voting choices (Lau and Redlawsk Reference Lau and Redlawsk2001). For instance, they use party identification (Popkin Reference Popkin1994; Sniderman, Brody, and Tetlock Reference Sniderman, Brody and Tetlock1991) or endorsements from opinion leaders (Lupia and McCubbins Reference Lupia and McCubbins1998) as cues about candidates. Dual processing theories of cognition, including Petty and Cacioppo’s (Reference Petty and Cacioppo1986) Elaboration Likelihood Model and Chaiken’s (Reference Chaiken1980) Heuristic–Systematic Processing Model, suggest that ad endorsements, used as heuristic cues, may prompt attitude change and voter turnout—especially among low-information voters. Indeed, research has found that endorsements alter the way people think about candidates (Arceneaux and Kolodny Reference Arceneaux and Kolodny2009). Yet, even as the theoretical and empirical boundaries of endorsement effects are being mapped, little is known about the antecedent contextual and strategic causes motivating the use of endorsements by campaign communicators—that is, whether aspects of the candidates, the races, or the ads alter how endorsements are used.
Understanding antecedent factors that influence the application of ad endorsements is theoretically useful because it suggests linkages between the information-processing and persuasion models and the actual use of these cues in the real world. In this article, we examine how and when campaign communicators use endorsements and whether practice aligns with theory. Using a content analysis of ads from the 2008 election cycle, we explore how four contextual and strategic factors influence the use of ad endorsements: (1) candidate characteristics such as gender and party affiliation, (2) campaign characteristics such as competitiveness, (3) ad format, and (4) timing of ad airings during an election. Results demonstrate that, by and large, ads that contain endorsements are aired in ways that are consistent with theory and literature.
THE HOW AND WHY OF ENDORSEMENTS
Endorsements function as information shortcuts for voters (Chaiken Reference Chaiken1980; Petty and Cacioppo Reference Petty and Cacioppo1986) in the same way that other cues such as candidate party identification, gender (McDermott Reference McDermott1997), race and ethnicity (McDermott Reference McDermott1998), sexual orientation (Golebiowska Reference Golebiowska2001), and occupation (McDermott Reference McDermott2005) function as signals that help voters—especially those in low-information elections—to understand candidate qualities, ideologies, and issue positions. When voters do not possess the information needed to make a decision, endorsements from trusted and reliable sources (e.g., a daily newspaper) may provide a peripheral cue that a candidate is credible and worthy of receiving their vote.
Campaigns use endorsements because they produce positive informational and persuasive effects. Written endorsements help voters to evaluate complex propositions (Gerber and Philips Reference Gerber and Phillips2003), whereas celebrity endorsements attract attention to ads (Miciah and Shanklin Reference Miciah and Shanklin1994) and increase recall of messages (Friedman and Friedman Reference Friedman and Friedman1979). Endorsements also positively affect voters’ perceptions of a candidate’s viability and their vote choices (Pease and Brewer Reference Pease and Brewer2008), and they increase political engagement among younger voters (Jackson and Darrow Reference Jackson and Darrow2005). However, the factors that lead to the use of endorsements remain unclear.
Using a content analysis of ads from the 2008 election cycle, we explore how four contextual and strategic factors influence the use of ad endorsements: (1) candidate characteristics such as gender and party affiliation, (2) campaign characteristics such as competitiveness, (3) ad format, and (4) timing of ad airings during an election.
WHICH FACTORS PREDICT USE OF ENDORSEMENTS IN POLITICS?
Drawing on campaign-strategy literature, we expect that certain characteristics of the candidates, the campaigns, and the ads will predict the application of endorsements.
Candidate Characteristics
First, candidate gender influences campaign strategies such that women—stereotypically perceived as warm, compassionate, and unsuitable for the masculine world of politics—adopt a tough stance to assert their viability (Dolan Reference Dolan2006; Kahn Reference Kahn1996) and rely on outside influential or expert voices to add credibility to their campaign (Bystrom et al. Reference Bystrom, Banwart, Kaid and Robertson2004).
Second, whether a candidate is an incumbent or a challenger may affect the use of endorsements. Challengers tend to base their campaign on calls for change and they draw more heavily on attack and contrast ads than promotional ads (Lau and Pomper Reference Lau and Pomper2004). Because challengers tend to be relative outsiders to the national political scene, it is logical that they are more likely than incumbents to rely on endorsements as credibility cues. Incumbents, conversely, have a greater chance of winning reelection and therefore are more likely to keep their campaign positive, emphasizing accomplishments (Trent and Friedenberg Reference Trent and Friedenberg2000). Because incumbents tend to be well known relative to challengers, they may use fewer endorsements. Nevertheless, Trent and Friedenberg pointed out that endorsements can be equally effective for both challengers and incumbents because they link a candidate with other leaders who already are well known, thereby giving a candidate “credibility by association” (Trent and Friedenberg Reference Trent and Friedenberg2000, 87).
Campaign Context
We expect that election characteristics—specifically, the level and competitiveness of a race—determine whether endorsements are used in ads. Competitive congressional races tend to be negative, featuring campaign ads that focus on fear to mobilize voters (Brader Reference Brader2005). Extant literature indicates that endorsements are more likely to be featured in positive ads (Kaid and Johnston Reference Kaid and Johnston2001); therefore, we expect that it is unlikely that ads in competitive races will use endorsements. That is, as races become more competitive, we expect that negativity will increase, perhaps resulting in more overall advertising but with a smaller proportion of ads that contain endorsements. This effect also may fluctuate during the course of a campaign.
Ad Format
Aspects of an ad also may affect the use of endorsements. When ads are issue oriented or aim to present “hard facts” about a candidate, they are less likely to feature an endorsement (Kaid and Johnston Reference Kaid and Johnston2001). These ads focus on policy rather than character, and they are more likely to be negative and to use emotional appeals. Conversely, image-oriented ads are largely positive, focus on character, and are more likely to use surrogates to provide testimonials. We expect that image ads are more likely than issue ads to feature endorsements.
Furthermore, attack and contrast ads—that is, negative ads—function similarly to issue ads. We therefore expect negative ads to lack endorsements. Promotional ads—that is, positive ads—share characteristics with image ads. Thus, we expect positive ads to frequently contain endorsements, at least relative to negative ads.
Often, ads feature a prominent celebrity endorser asking that voters take action, such as voting for a particular candidate or signing a petition. Because endorsements—especially those by celebrities—are particularly persuasive (Neddenriep and Nownes Reference Neddenriep and Nownes2014), we expect that ads featuring calls to action are related positively to the use of endorsements.
Timing
Finally, we explore how the use of endorsements changes during the course of a campaign. As Dunaway and Stein (Reference Dunaway and Stein2013) point out, in the early stages of a campaign, candidates tend to focus on providing information about themselves and their issue positions. Therefore, the ads used during this period should have positive appeals and a greater likelihood of using endorsements. However, Leon (Reference Leon2013) found that candidates endorsed by newspapers on Election Day tend to receive a more significant vote share than those who received endorsements in the week before the election. This is due to voters paying more attention to the most recent endorsements—knowing that they might soon need that advice to cast their vote. Thus, we expect the volume of endorsements to fluctuate during an election season.
METHOD
To explore how candidate, electoral, and ad-format factors relate to the use of endorsements in political ads, we used secondary content-analysis data from the 2008 Wisconsin Advertising (WiscAd) Project. The Project tracked and analyzed the content of political ads from 1996 to 2008 across a variety of congressional and gubernatorial races in major US media markets. Footnote 1 In 2008, WiscAd analyzed n = 3,606 advertisements that aired between January 1 and November 4, 2008. The unit of analysis was each ad that aired in the 2008 cycle (n = 1,312,182). We supplemented the WiscAd data with our own codes for the gender of the candidate, the candidate’s status (i.e., incumbent, challenger, or open seat), and the final margin of victory.
Dependent Variable
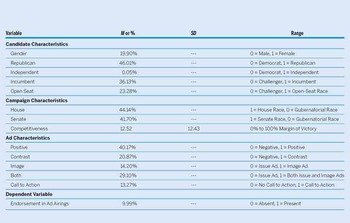
As shown in table 1, the dependent variable in the analysis was the presence or absence of an endorsement.
Descriptive Statistics

Note: n = 1,312,182.
Independent Variables
The independent variables included the candidate’s gender; whether the candidate was an incumbent or a challenger or ran in an open-seat race; and the campaign competitiveness, measured as the difference in final vote share. Larger values indicated larger margins of victory and a less competitive race.
WiscAd Project items that assessed ad characteristics also were used as independent variables. We used items that measured ad tone—specifically, whether the ad aired was positive or negative or else posed a contrast among candidates; whether it was considered image-based, issue-based, or both; and whether it asked viewers to take political action.
Because the dependent variable was dichotomous and categorical, we estimated a logistic-regression model using each independent variable to predict the presence of an endorsement (Long and Freese Reference Long and Freese2006). Because our sample size was large, making it relatively easy to reject a null hypothesis, we interpreted coefficients as significant only at the alpha level of p<0.001.
Likewise, incumbents were more likely than challengers to use endorsements (OR = 1.30, p<0.001), which is perhaps a curious finding considering that challengers typically are political outsiders with low name recognition who need to use endorsements as credibility cues.
RESULTS
Our analyses indicate that campaigns use endorsements strategically to gain an advantage for the candidate.
Candidate Characteristics
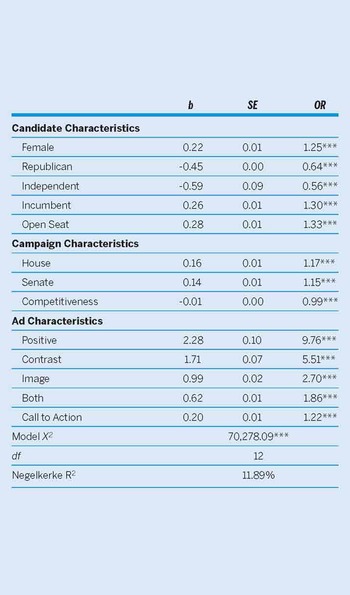
As shown in table 2, we found that female candidates were more likely than male candidates to use endorsements (OR = 1.25, p<0.001). Republicans (OR = 0.64, p<0.001) and independents (OR = 0.56, p<0.001) were less likely to use an endorsement compared to Democrats, a finding that is in line with previous research that shows Democrats as more likely to use endorsements compared to their Republican counterparts (Bystrom et al. Reference Bystrom, Banwart, Kaid and Robertson2004). Likewise, incumbents were more likely than challengers to use endorsements (OR = 1.30, p<0.001), which is perhaps a curious finding considering that challengers typically are political outsiders with low name recognition who need to use endorsements as credibility cues. In the discussion section, we use path analysis to better explain this finding. Incumbents also were more likely to use endorsements than candidates in open-seat races (OR = 1.33, p<0.001).
Logistic Regression Predicting Use of Endorsement in 2008 Campaign Ad Airings

Note: n = 1,312,182. *** p<0.001. Robust standard errors were used to mitigate possible omitted variable bias. Because n is large, making it easy to reject null hypotheses, we checked our estimates by repeatedly running the same logit on randomly selected 1% subsamples. Coefficients were stable in each model, except for those assessing the independent effects of the level of the race (i.e., US Senate versus gubernatorial and US House versus gubernatorial) and candidate party affiliation (Democrat versus Independent) on the dependent variable . The majority of the 1% subsamples showed no significant differences between the level of the race and the Democratic and independent candidate affiliations.
Campaign Context
US House (OR = 1.17, p<0.001) and Senate (OR = 1.15, p<0.001) races were more likely than gubernatorial races to air ads containing endorsements. Footnote 2 Ads aired in competitive races were less likely to contain endorsements (OR = 0.99, p<0.001) than those aired in noncompetitive races.
Ad Format
Both positive (OR = 9.76, p<0.001) and contrast (OR = 5.51, p<0.001) ads were more likely than attack ads to contain endorsements when they aired. Ads aired on candidate image were more likely to use an endorsement than those aired on campaign issues (OR = 2.70, p<0.001), as were ads aired on image and issues equally (OR = 1.86, p<0.001). Ads that aired a call to political action also were more likely to present an endorsement (OR = 1.22, p<0.001).
Timing
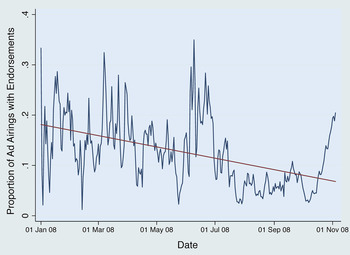
We examined the possibility that the use of endorsements fluctuates over time by plotting the proportion of endorsements in ad airings during the 2008 election cycle. As shown in figure 1, their use changes over time, with more endorsements aired in the January, March, and April primary season. Although there is a spike in the use of endorsements in October immediately before an election, an autoregressive integrated moving average analysis indicated a significant negative trend in their airing during the course of a campaign (b = -0.0004, SE = 0.00004, p<0.001).
Proportion of Ad Airings with Endorsements for 2008 House, Senate, and Gubernatorial Races
Note: n = 1,312,192. The blue line represents the proportion of ad airings containing endorsements using a one-day moving average from January 1 to November 4, 2008. The trend line is shown in red for comparison.

DISCUSSION
Cognitive-processing theories suggest that ad endorsements can have informational and persuasive effects on voters, particularly in low-information contexts. However, the extent to which campaign professionals use endorsements remains unclear, as do factors that relate to the strategic use of endorsements in ads. This article establishes critical antecedent factors that relate to the strategic use of endorsements in political advertising, thereby developing a basis for future-effects research and a framework for consultants and practitioners who want to understand how campaigns deploy endorsements. Rather than examining endorsement effects, we analyzed content-analysis data from a real-world environment to examine “supply-side” factors that affect the actual use of endorsements in ads.
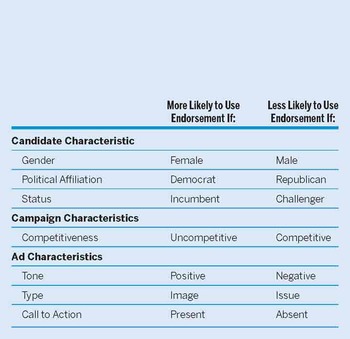
We found that four factors—candidate characteristics, campaign context, ad format, and timing—relate systematically to airing ads that contain endorsements and generally conform to expectations drawn from the strategic-communication literature (table 3). Our first finding—that female candidates are more likely than male candidates to air ads with endorsements—is congruent with the women and politics literature (Dolan Reference Dolan2006; Kahn Reference Kahn1996). This indicates that women are more likely to rely on external sources to enhance their credibility among voters. Although this finding may indicate the persistent gendered nature of campaigns, further research that considers additional factors such as the gender of both the opponent and the endorser is needed to validate this finding.
Prototypical Candidate, Campaign, and Ad Characteristics That Affect Use of Endorsements

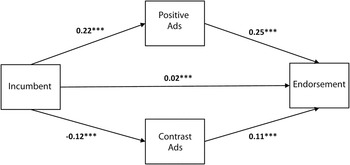
Second, we found that incumbents were more likely than challengers to use endorsements. We examined this further, taking into account the tone of the ads. It has been established that positive ads are more likely to contain an endorsement; therefore, because campaign strategists recommend that incumbents use positive messaging (Sonner Reference Sonner2005), our result could be mediated by tone. We tested this possibility by using path analysis (figure 2) to examine indirect effects via tone. As shown in figure 2, an incumbent’s status has a positive direct effect on the use of endorsements in ads (β = 0.02, p<0.001). However, there is a more significant indirect effect (β = 0.04, p<0.001), which suggests that tone partially mediates the effect of candidate status on the use of endorsements: that is, incumbents use more positive ads, which are more likely to contain endorsements. For challengers, it appears that “going negative” results in fewer possibilities to use endorsements because negative ads are less likely than positive ads to use them.
Path Model Showing Direct and Indirect Effects of Incumbent Status on Use of Endorsements
Note: n = 1,312,192. *** p<0.001. Standardized estimates are reported. Fit statistics are based on a structural-equation model using a randomly selected 1% subsample of the original WiscAd Project dataset to adjust for overidentification. These statistics indicate a good fit with these data: X2 (2, n = 13,113) = 2.34, p = 0.31; Root Mean Square Error of Approximation (RMSEA) = 0.004; Comparative Fit Index (CFI) = 1.00; Tucker-Lewis index (TLI) = 0.99. According to Acock (Reference Acock2013), a CFI value greater than 0.90 and an RMSEA value less than 0.05 indicate an adequate fit.

Third, we found that endorsements are less common in competitive than uncompetitive races. Although this finding was in line with our expectations, it was surprising because the use of endorsements as heuristics should be more common in competitive races that try to persuade independent and undecided voters (Wang Reference Wang2010). Our finding indicated that although competitive races typically have a higher proportion of negative ads (Lau and Pomper Reference Lau and Pomper2004), campaigns might be using endorsements for image building—a strategy that becomes particularly needed in the midst of relentless attacks from an opponent.
This was corroborated in our finding that image ads, positive ads, contrast ads, and ads asking viewers to take action are more likely to use endorsements than both issue and negative ads. It may be that a campaign perceives endorsements as a good tool for image building and recognizes their worth as persuadable information cues for voters. As Tellis (Reference Tellis2004) argued, endorsers transfer their credibility and popularity to the object or person being endorsed, thereby influencing voters; apparently, campaigns are aware of this advantage.
Fourth, our analysis indicated that ad endorsements are most common during the early stages of a campaign and immediately before Election Day; overall, however, they typically decrease as a campaign progresses. During the early stages, a campaign’s communication team tries to establish that a candidate is credible, trustworthy, loyal, and a good fit for office (Trent and Friedenberg Reference Trent and Friedenberg2000), and endorsements can help to achieve those goals. With voters closely watching a candidate’s actions to infer how he or she will behave when elected, endorsements may prove especially helpful in igniting a candidate’s support base by acting as an information shortcut to inform voters about issue positions and by lending credibility.