Introduction
Sea ice covers up to 7% of the total surface area of the oceans at its maximum extent (Comiso Reference Comiso2010). The physical barrier itself has a major impact on the gas exchange between atmosphere and ocean, and recently the discussion has extended to considering how physical and biogeochemical processes within the ice itself can affect diffusion and flux of gases to both atmosphere and ocean (Rysgaard et al. Reference Rysgaard, Glud, Sejr, Bendtsen and Christensen2007, Reference Rysgaard, Bendtsen, Pedersen, Ramløv and Glud2009, Reference Rysgaard, Bendtsen, Delille, Dieckmann, Glud, Kennedy, Mortensen, Papadimitriou, Thomas and Tison2011, Miller et al. Reference Miller, Papakyriakou, Collins, Deming, Ehn, MacDonald, Mucci, Owens, Raudsepp and Sutherland2011, Loose et al. Reference Loose, Miller, Elliott and Papakyriakou2011). On the basis of thermodynamic equilibrium calculations, the precipitation of CaCO3 was predicted to occur during natural sea ice formation (Jones & Coote Reference Jones and Coote1981, Anderson & Jones Reference Anderson and Jones1985) and it was proposed to precipitate as calcite (Marion Reference Marion2001). However, actual evidence was, for a long time, only indirect (Killawee et al. Reference Killawee, Fairchild, Tison, Janssens and Lorrain1998, Papadimitriou et al. Reference Papadimitriou, Kennedy, Kattner, Dieckmann and Thomas2004, Reference Papadimitriou, Kennedy, Norman, Kennedy, Dieckmann and Thomas2012) until Dieckmann et al. (Reference Dieckmann, Nehrke, Papadimitriou, Göttlicher, Steininger, Kennedy, Wolf-Gladrow and Thomas2008) found calcium carbonate as ikaite CaCO3*6H2O in Antarctic sea ice, and more recently in Arctic sea ice (Dieckmann et al. Reference Dieckmann, Nehrke, Uhlig, Göttlicher, Gerland, Granskog and Thomas2010, Rysgaard et al. Reference Rysgaard, Glud, Lennert, Cooper, Halden, Leakey, Hawthorne and Barber2012). Rysgaard et al. (Reference Rysgaard, Glud, Sejr, Bendtsen and Christensen2007, Reference Rysgaard, Bendtsen, Pedersen, Ramløv and Glud2009) showed that with brine, dissolved inorganic carbon (DIC) is rejected from growing sea ice to the underlying waters. They ascribe the high pCO2 (partial pressure of CO2) levels found below sea ice to calcium carbonate precipitation. Rysgaard et al. (Reference Rysgaard, Glud, Sejr, Bendtsen and Christensen2007) proposed that CaCO3 precipitation in sea ice could result in a significant CO2 uptake by the ocean and therefore contribute to a polar carbon pump.
Besides its function as a component in the carbon cycle, the mineral is also thought to have a key role in tropospheric ozone depletion events (ODEs) at high latitudes (Sander et al. Reference Sander, Burrows and Kaleschke2006, Sander & Morin Reference Sander and Morin2010). Simulations of the chemistry occurring in Polar Regions over newly formed sea ice relate the ODE to the transformation of inert sea-salt bromide to reactive bromine monoxide (BrO) when precipitation of calcium carbonate from freezing seawater is taken into account. The discovery of ikaite in firn ice of the Antarctic continent, which appears to be derived from sea ice 300 km away, may also have implications for its use as a sea ice proxy (Sala et al. Reference Sala, Delmonte, Frezzotti, Proposito, Scarchilli, Maggi, Artioli, Dapiaggi, Marino, Ricci and De Giudici2008). However, to date most studies of calcium carbonate in sea ice have been mainly qualitative and little is known about the spatial and temporal distribution of CaCO3 within sea ice.
There is also a lack of knowledge on the exact conditions leading to ikaite precipitation as well as on the amount and fate of ikaite, e.g. one assumption is that phosphate and dissolved organic matter (DOM) may reduce the precipitation of calcium carbonate (Zullig & Morse Reference Zullig and Morse1988, Bischoff et al. Reference Bischoff, Fitzpatrick and Rosenbauer1993). Both dissolved inorganic phosphate and DOM can be present in sea ice in very high concentrations (Thomas et al. Reference Thomas, Kattner, Engbrodt, Giannelli, Kennedy, Haas and Dieckmann2001), and it can be hypothesized that where these parameters are present in high concentrations that precipitation of some polymorphs of calcium carbonate will be inhibited.
The objective of this study therefore was to: 1) provide the first systematic observation and quantification of CaCO3 precipitation in Antarctic sea ice on a spatial and temporal scale, and 2) to investigate relationships between calcium carbonate and alkalinity, phosphate, and dissolved organic matter.
Methods
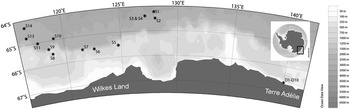
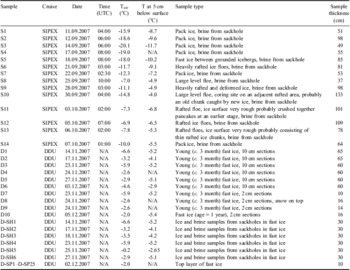
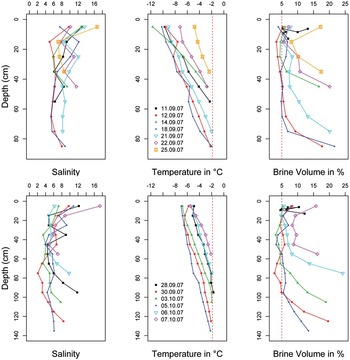
Two campaigns were performed between September and December 2007. During the first campaign (Sea Ice Physics and Ecosystem eXperiment (SIPEX) onboard RSV Aurora Australis from September–October 2007) 14 ice cores (S1–S14) were taken at different locations between 64° and 66°S, and 116° and 128°E (Fig. 1). The cores were cut into 10 cm sections within a few minutes after sampling and stored in plastic containers. Ice cores from station S1–S4 and S6–S14 represent pack ice with different degrees of deformation (Table I). The ice core from station S5 was taken from fast ice between grounded icebergs. For details on ice types, bulk salinity, ice temperature, and brine volume see Table I, Figs 2 & 3, and Meiners et al. (Reference Meiners, Norman, Granskog, Krell, Heil and Thomas2011). A general description of the ice conditions during the expedition can be found in (Worby et al. Reference Worby, Steer, Lieser, Heil, Yi, Markus, Allison, Massom, Galin and Zwally2011). Brine from sackholes from ten out of 14 stations (Table II) was collected for nutrient and DOM analyses (Norman et al. Reference Norman, Thomas, Stedmon, Granskog, Papadimitriou, Krapp, Meiners, Lannuzel, van der Merwe and Dieckmann2011).
Locations of ice stations sampled during Sea Ice Physics and Ecosystem eXperiment (SIPEX) and Dumont d'Urville (DDU) campaigns.

Sample types and thickness of sea ice during Sea Ice Physics and Ecosystem eXperiment (SIPEX) and Dumont d'Urville (DDU) campaigns. N/A = data not available.

Bulk salinity, sea ice temperature, and calculated (Cox & Weeks Reference Cox and Weeks1986) brine volume in different ice cores taken between September and October 2007 in East Antarctic during SIPEX campaign.

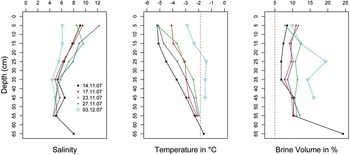
Bulk salinity, sea ice temperature, and calculated (Cox & Weeks Reference Cox and Weeks1986) brine volume in land fast sea ice cores taken between November and December 2007 in East Antarctic during Dumont d'Urville campaign.

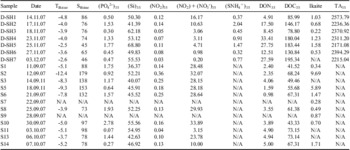
Physico-chemical properties of brine collected from sackholes from land fast ice off Terre Adélie (Dumont d'Urville campaign) in November 2007 (D-SH1 to D-SH7) and from sea ice in East Antarctica (see map) between September and October 2007 (S1–S14). Total alkalinity (TA), dissolved organic nitrogen (DON), dissolved organic carbon (DOC), and nutrients are normalized to S = 35 and in μmol l-1. Ikaite values are from ice cores (30 cm) obtained from the sackholes (D-SH1 to D-SH7, DDU campaign) and ice cores adjacent to the sackholes (S1–S14, SIPEX cruise, sum of the first three 10 cm sections) and presented in mg l-1. N/A = data not available.

During the second campaign (from November–December 2007) sea ice samples were collected close to the French Dumont d'Urville Base (DDU), 66°39′13′′ S, 140°00′5′′E near station C described in Delille et al. (Reference Delille, Jourdain, Borges, Tison and Delille2007). Six complete ice cores (D1–D6) were taken from young fast ice (age approximately three months, Anne Jacquet, personal communication 2007), which had formed in August. This area was predominantly free of snow with only isolated patches of snow being present. The cores were also cut into 10 cm sections and stored as described above. In order to determine small-scale vertical distribution of ikaite, we also collected four surface cores (D7–D10) between 10 and 15 cm length (Table I). Cores D7 and D9 were taken from the main sampling site without any snow on top, while D8 was taken next to it and included snow. Ice sample D10 was taken from older fast ice c. 200 m away from the main sampling site. Ice core D10 was taken from sea ice, which had formed in autumn and had remained intact since its formation, in contrast to cores D1–D9, which were from younger sea ice. Ice cores D7–D10 were cut into 2 cm sections. In addition, to determine horizontal spatial variability of calcium carbonate, we chose an area 50 m away from the first sampling site.
On this site the first top 10 cm of fast ice were sampled every 5 m (x and y direction) in a grid of 20 m x 20 m (D-SP1 to D-SP25, Table I). The partial ice cores obtained were stored in clean plastic containers. At the main sampling site, sackholes (D-SH1 to D-SH7) of 30 cm were cored every two or three days for a temporal analysis of brine and ice. All samples were collected within an area of 10 m x 10 m to minimize bias due to spatial heterogeneity. The partial ice cores obtained from these sackholes were also stored in clean plastic containers. Brine was allowed to accumulate in the sackholes and sampled with a vacuum pump and transferred into different vials for total alkalinity (TA), dissolved organic carbon (DOC), dissolved organic nitrogen (DON), and phosphate analyses. Samples for DOM and nutrients were collected as described by Norman et al. (Reference Norman, Thomas, Stedmon, Granskog, Papadimitriou, Krapp, Meiners, Lannuzel, van der Merwe and Dieckmann2011) and kept frozen until analyses within six months. The TA samples were measured directly in the base laboratory.
Two sediment traps MST6 (HYDRO-BIOS, 0.005 m2 surface) and a current-meter RCM7 (ANDERRA) were deployed under the sea ice at Dumont d'Urville from 13 November 2007 to 4 December 2007 immediately adjacent to the temporal study site. The first sediment trap was at 5 m under the ice and the second one at 25 m. Water depth at the site was 53 m. Mercuric chloride was used for fixation of the samples. Sediment trap samples were immediately analysed under the binocular microscope after the traps were retrieved.
We also sampled glacial firn ice 6 km away from the ice shelf at Cape André Prud'homme to test if calcium carbonates are found on the ice shelf in this region. One surface core (1 m) was collected and cut into three equal sections. The sections were stored in plastic containers and brought to the base laboratory.
All sea ice samples were slowly melted in a climate controlled room where the temperatures never exceeded 4°C to avoid decomposition of the mineral ikaite. Regular monitoring (several times a day) guaranteed a processing of the samples as soon as the cores or sections were melted. This ensured that the temperature of the meltwater never rose above 0°C. The meltwater was filtered through 0.2 μm polycarbonate filters using a vacuum pump and the volume of filtrate measured. The filters with crystals were placed in plastic vials (2 ml Safe-Lock tubes, Eppendorf, Germany) and subsequently filled with 75% v/v ethanol and frozen at -18°C for later mineralogical phase identification and quantitative measurements. In several instances crystals were collected after swirling the melted samples and allowing crystals to settle in the resulting vortex. The crystals were transferred from the vortex to a petri dish using a glass pipette (Dieckmann et al. Reference Dieckmann, Nehrke, Papadimitriou, Göttlicher, Steininger, Kennedy, Wolf-Gladrow and Thomas2008). These were briefly inspected under the binocular microscope and photographed to check the morphology and subsequently also filtered as described above.
Mineral phase identification was conducted by micro X-ray diffraction (μ-XRD) under cryogenic conditions on selected samples at the Synchrotron Laboratory for Environmental Studies SUL-X at the synchrotron radiation source ANKA, Forschungszentrum Karlsruhe (now Karlsruhe Institute of Technology) as described by Dieckmann et al. (Reference Dieckmann, Nehrke, Papadimitriou, Göttlicher, Steininger, Kennedy, Wolf-Gladrow and Thomas2008).
To quantify the calcium carbonate within a sample, the quantity of calcium ions were determined using Inductively-Coupled Plasma Optical Emission Spectrometry (ICP OES). The Safe-Lock tubes containing the filters were rinsed with concentrated ethanol and the content was transferred to larger vials. The transferred samples were dried at 60°C until all the ethanol had evaporated, leaving only the calcium carbonate crystals. Five ml concentrated HNO3 was added to dissociate all molecules according to Eq. (1) before the samples were analysed in the ICP OES. The amount of ikaite was calculated using a molar calcium/ikaite ratio of one.
 $$ {\rm{[CaC}}{{{\rm{O}}}_{\rm{3}}}^{\rm{\ast}}6{{{\rm{H}}}_{\rm{2}}}{\rm{O]}}\, {\rm{ = }}\, {\rm{[C}}{{{\rm{a}}}^{{\rm{2 + }}}} {\rm{]}}\, {\rm{ + }}\, {\rm{[C}}{{{\rm{O}}}_{\rm{3}}}^{{{\rm{2 \hbox- }}}} {\rm{]}}\, {\rm{ + }}\, {\rm{6[}}{{{\rm{H}}}_{\rm{2}}}{\rm{O]}} \eqno\rm$$
Brines from sackholes (D-SH1 to D-SH7 and from ten ice stations during the SIPEX campaign) were analysed for in situ concentrations of phosphate, DON, DOC and alkalinity (Table II). Analysis for the major dissolved inorganic nutrients, nitrate (NO3-), nitrite (NO2-), and of dissolved inorganic phosphorus (DIP) was done using standard colorimetric methodology (Hanson & Koroleff Reference Hanson and Koroleff1983) as adapted for flow injection analysis (FIA) on a LACHAT Instruments Quick-Chem 8000 autoanalyzer (Hales et al. Reference Hales, van Geen and Takahashi2004). Dissolved organic carbon was analysed by high temperature combustion on an MQ1000 TOC analyser according to Qian & Mopper (Reference Qian and Mopper1996). Dissolved organic nitrogen was determined by subtraction of NO3- and NH4+ from the total dissolved nitrogen (TDN) analysed using online peroxodisulfate oxidation coupled with ultraviolet radiation at pH 9.0 and 100°C (Kroon Reference Kroon1993). Total alkalinity (D-SH1 to D-SH7) was measured at the station laboratory within one day of sampling as described by Nomura et al. (Reference Nomura, Yoshikawa-Inoue, Toyota and Shirasawa2010).
For the spatial analysis of the horizontal distribution of CaCO3*6H2O a conventional geostatistical spatial interpolation was applied by using the simple kriging method (Sarma Reference Sarma2009).
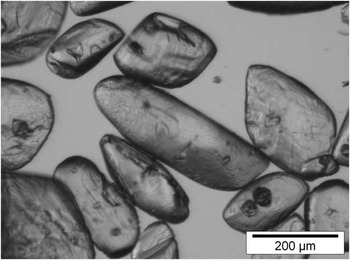
Results
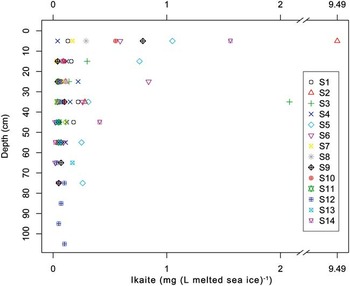
Calcium carbonate crystals were found in all samples analysed, including snow, sea ice and glacial ice. Mineral phase identification of selected samples confirmed that ikaite was the precipitate present. Since all crystals extracted from the ice cores showed the same morphological features, it is most likely that the XRD identification as ikaite is representative for all crystals found in this study (Fig. 4). Ikaite concentrations in melted sample (sea ice or snow) ranged from 0.01–126 mg l-1 (Table S1, which will be found at http://dx.doi.org/10.1017/S0954102012001150) and 0.07–0.12 mg l-1 in glacial ice. The maximum amount of ikaite was found in older fast ice (D10). Data from 14 ice cores of the SIPEX campaign show the highest concentrations of the ikaite crystals in the upper layers of ice (Fig. 5). Although the highest concentration of ikaite in melted sea ice in the pack ice samples was 9.5 mg ikaite l-1, most of the values in the uppermost 10 cm did not exceed 2 mg ikaite l-1. Below a depth of 20 cm (with the exception of two ice cores (S3 and S6)) in the pack ice, ikaite concentrations ranged between 0.02–0.3 mg l-1. Ice texture analyses of cores S3 and S6 showed it to be rafted sea ice (Meiners et al. Reference Meiners, Norman, Granskog, Krell, Heil and Thomas2011).
Light microscopy image of ikaite crystals taken from a single bulk sea ice sample from land fast ice off Terre Adélie.

Distribution of ikaite in sea ice during SIPEX cruise in different ice cores taken between September and October 2007 in East Antarctic.

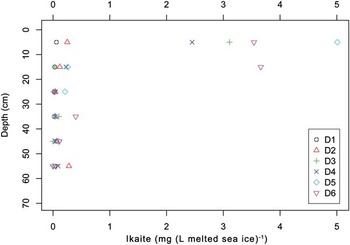
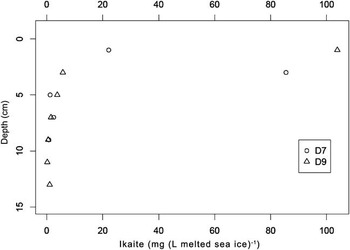
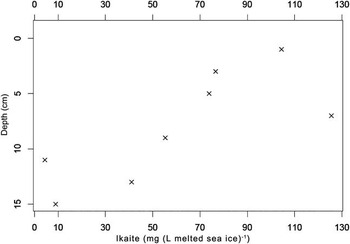
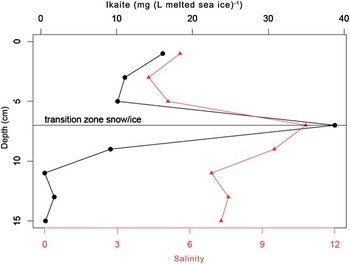
The ikaite concentrations in land fast ice off Terre Adélie were of a similar magnitude, but generally higher than the pack ice cores (Fig. 6): most were between 2 and 5 mg l-1 in the top layer. A higher resolution sampling (2 cm) over the first 10–15 cm showed that the highest concentrations of the mineral were in the top 2–4 cm of the cores (Fig. 7). Ice core D10 (Fig. 8) was sampled from a separate older fast ice (ice thickness 133 cm) location, 200 m away from the initial sampling site. This core had higher mineral concentrations than those from the younger sea ice. Ice core D8 from snow covered ice (Fig. 9) had ikaite crystals throughout the sample and even in the snow itself. The highest concentration (38.77 mg l-1) was measured at the snow/ice interface. The shapes of salinity profiles were similar to those of the amount of ikaite in core D8 (Fig. 9).
Distribution of ikaite in sea ice during Dumont d'Urville campaign in land fast sea ice off Terre Adélie sampled in November 2007.

Distribution of ikaite in the surface layer of young (three month) land fast sea ice off Terre Adélie (Dumont d'Urville).

Distribution of ikaite in the top layer of older (one year) land fast sea ice, off Terre Adélie (Dumont d'Urville) in November 2007 core D10.

Distribution of ikaite across the snow-ice interface from top layer of land fast sea ice off Terre Adélie (Dumont d'Urville) in November 2007, core D8. Black line = amount of ikaite, red line = bulk salinity, in contrast to the general use of the 0 cm for the snow/ice interface, here it indicates the top of the snow.

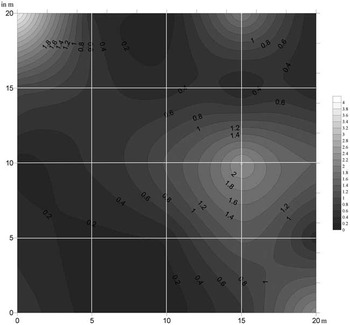
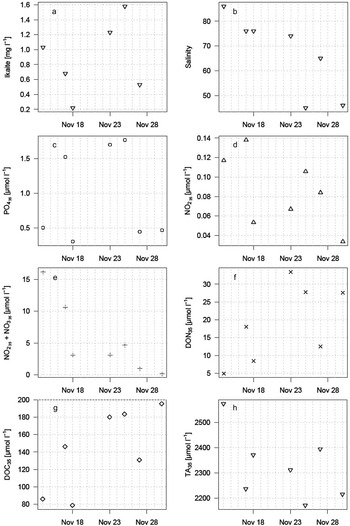
A temporal change in ikaite concentration was not observed during the sampling between 14 and 27 November 2007 at DDU. Values measured in the temporal and spatial experiment were in the same range (0.06 and 3.93 mg l-1, Figs 10 & 11, Table II). Hence, we could not differ temporal from spatial heterogeneity. The spatial experiment showed that the distribution of ikaite in sea ice can be highly heterogeneous. No CaCO3 crystals were found in the sediment traps.
Contour plot of the spatial distribution of ikaite in the upper 10 cm of land fast sea ice off Terre Adélie (Dumont d'Urville) in November 2007 on a 20 m x 20 m grid with sample points every 5 m x 5 m (shown by intersections of the white lines and at the edges). Values are in mg ikaite l-1 melted sea ice.

a. Temporal observation of ikaite in ice cores (30 cm) obtained from sackholes D-SH1 to D-SH7 (Dumont d'Urville (DDU) campaign), b. salinity, c. salinity-normalized PO42-, d. NO2-, e. (NO2) + (NO3-)35, f. dissolved organic nitrogen (DON), g. dissolved organic carbon (DOC), and h. total alkalinity (TA) in Antarctic land fast sea ice, off Terre Adélie (DDU) in November 2007.

When brine concentrations are normalized to a salinity of 35, DON35 and DOC35 concentrations increased non-linearly over a period of time. During the DDU campaign, DIP35 (normalized to S = 35) shows the same trend as DON35 and DOC35 at the beginning, it did not increase over time and remained low. Only NO3- showed a trend, which might indicate biological activity, although no biological parameters were measured in these samples. Total alkalinity fell from almost 2600 to c. 2200 μmol l-1 and did not show a linear trend, similar to the other measured chemical parameters. Neither DIC, DON, DOC concentrations (from SIPEX and DDU campaign) nor TA (DDU campaign) correlated significantly with the amount of ikaite present in the ice horizons from where the brines were collected. Comparison of theoretical values of brine salinity (calculated according to Petrich & Eicken Reference Petrich and Eicken2010) versus measured values (Table II) showed no significant differences. Thus, brine volumes, although being above 5%, most probably were low enough to prevent influences by seawater.
Discussion
These results together with previous observations (Dieckmann et al. Reference Dieckmann, Nehrke, Papadimitriou, Göttlicher, Steininger, Kennedy, Wolf-Gladrow and Thomas2008) indicate that calcium carbonate precipitation is widespread in Antarctic sea ice, albeit highly spatially heterogeneously, as is the case for many other biogeochemical parameters in sea ice (Thomas & Dieckmann Reference Thomas and Dieckmann2010). Although we were not able to verify the CaCO3 polymorph for each sample collected, the visual characterization by light microscopy confirmed that the morphology of all crystals was identical to those analysed by X-ray diffraction. We are therefore convinced that ikaite was always the precipitate. Higher brine salinities in the uppermost layers, resulting from lower temperatures at the sea ice surface, and correspondingly high Ωikaite (ikaite saturation state of seawater) values, resulted in a more likely precipitation of ikaite near the ice surface than in lower parts in sea ice where temperatures are higher and brine salinity can drop to seawater values. However, it is still not clear at what point in time ikaite precipitation occurs, and our interpretation is confounded because the various biogeochemical parameters measured during sample collection do not reflect conditions at the time of precipitation. For example the question arises why a TA decrease by 400 μmol did not result in a correlation with the precipitation of ikaite. As discussed above, the measurements reflect only a small time frame in the seasonal carbon cycle within sea ice and not necessarily the conditions at time of precipitation. Observations of higher values of ikaite in older land fast ice (Fig. 8) also raise the question of whether or not precipitation can take place during subsequent sea ice growth, or if ikaite, after it has formed in young sea ice remains stable under various conditions until the sea ice melts thereby not altering TA or the carbonate system itself.
Based on a thermo-molecular pressure gradient as described by Wettlaufer & Worster (Reference Wettlaufer and Worster1995), brine, as unfrozen liquid, can be transported from the ice interior toward the relatively colder surface (Rankin & Wolff Reference Rankin and Wolff2002). The accumulated brine at the surface has a salinity of about 100 (Perovich & Richter-Menge Reference Perovich and Richter-Menge1994) and favours the precipitation of salts. Under those conditions frost flowers may start to grow (Perovich & Richter-Menge Reference Perovich and Richter-Menge1994, Rankin & Wolff Reference Rankin and Wolff2002) and in turn can initiate CaCO3 precipitation. However, conditions not necessarily leading to frost flower formation, may also lead to CaCO3 precipitation if the temperature is low and salinity is high. The occurrence of calcium carbonate in the snow cover can most probably also be explained by the thermo-molecular pressure gradient and capillary transport. Brine is transported due to these processes into the snow where subsequently the precipitation of ikaite occurs. This is supported by the maximum concentrations of ikaite at the snow ice interface (Fig. 9). It is plausible that ikaite was there before snow accumulation, but this would not explain the different values in different snow layers.
Higher values of calcium carbonate in some middle layers of sea ice (S3 in Fig. 5) were attributable to rafting of floes subsequent to sea ice formation (see Meiners et al. Reference Meiners, Norman, Granskog, Krell, Heil and Thomas2011). Pack ice may be subject to deformation and floes may raft over each other resulting in the translocation of surface layers into interior layers of the newly established ice floe.
It is not possible to determine the temporal development of CaCO3 in the sea ice investigated during the DDU campaign. This is due to the large variability in CaCO3 concentrations even on small spatial scales. The reason for this heterogeneity might be due to the inherent variability in many sea ice properties ranging from temperature, salinity, texture, chemistry, as well as biological activity. The spatial heterogeneity is already apparent on small scales as shown by the spatial study during the DDU campaign. Thus, it is difficult to draw conclusions on the temporal evolution of the precipitation of ikaite. Although CaCO3 concentrations were in the same order of magnitude in pack ice and land fast ice there appear to be differences in the amount of precipitated calcium carbonate indicating a potential temporal evolution. The highest values were recorded in approximately one-year-old land fast sea ice, followed by high amounts in land fast ice and the lowest concentrations in pack ice. The processes responsible for the observed differences in ikaite concentrations in the different types of sea ice observed remain unclear. One explanation could be that CaCO3 is also precipitating during subsequent sea ice growth. Another reason could be that sea ice is experiencing different growth conditions, e.g. higher temperatures resulting in lower salinities and saturation states and thus lower values of ikaite.
The high concentrations of DOC and DON found in fast ice off Terre Adélie were expected to inhibit CaCO3 precipitation (Bischoff et al. Reference Bischoff, Fitzpatrick and Rosenbauer1993). Zullig & Morse (Reference Zullig and Morse1988) and Berner et al. (Reference Berner, Westrich, Graber, Smitz and Martens1978) showed that DOM influences the precipitation of some polymorphs of calcium carbonate. However, these studies refer only to the inhibition for anhydrous polymorphs of CaCO3. Besides the repression by polyphosphate and magnesium ions on the precipitation of anhydrous calcium carbonate in favour of hydrated forms, Dickens & Brown (Reference Dickens and Brown1970) postulated that hydrated salts may play an important part in biological mineralization. Taking this into account, additionally to the elevated Ωikaite, microbial biomass, such as cell surfaces and/or extracellular polymeric substances, could catalyse the precipitation of calcium carbonate (Kandianis et al. Reference Kandianis, Fouke, Johnson, Veysey II and Inskeep2008). This also coincides with findings of elevated abundance of bacteria and exopolymers in frost flowers (Bowman & Deming Reference Bowman and Deming2010) and the top layer of experimentally formed sea ice (Aslam et al. Reference Aslam, Uunderwood, Kaartokallio, Norman, Autio, Fischer, Kuosa, Dieckmann and Thomas2012), which supports the hypothesis of CaCO3 precipitation during frost flower and initial sea ice formation as discussed above.
The reasons why we did not find CaCO3 in the sediment trap are not clear and the absence can at this stage only be attributed to several factors, which cannot be verified. These include the dissolution of crystals during ice melt, which means crystals do not leave the sea ice as temperatures increase (Rysgaard et al. Reference Rysgaard, Glud, Lennert, Cooper, Halden, Leakey, Hawthorne and Barber2012). The dissolution occurred in the sediment trap itself before the trap was retrieved, but this would mean that crystals, which dropped out of the ice a day before retrieval would also have dissolved.
Previous studies have pointed out the importance of sea ice for the carbon uptake in polar oceans due to CaCO3 precipitation (Nedashkovsky et al. Reference Nedashkovsky, Khvedynich and Petrovsky2009, Rysgaard et al. Reference Rysgaard, Bendtsen, Pedersen, Ramløv and Glud2009, Reference Rysgaard, Bendtsen, Delille, Dieckmann, Glud, Kennedy, Mortensen, Papadimitriou, Thomas and Tison2011). An estimation of the contribution of calcium carbonate precipitation to the polar carbon cycle would be useful. However, the large heterogeneity observed in the distribution of ikaite will make such an estimate highly uncertain. Yet, based on our observations we propose a first estimate of the possible contribution of calcium carbonate precipitation to the carbon cycle. For simplicity we take into account only the top 10 cm of sea ice, since the amount in the lower part was negligible. Absolute values of ikaite found in the top 10 cm of sea ice ranged between 0.1 and 6.5 g m-2. Based on the total seasonal ice cover in the Antarctic (Comiso Reference Comiso2010) we calculate that CaCO3 formation in sea ice potentially could represent a contribution of between 0.1 and 6 Tg C to the carbon flux in the Southern Ocean. Assuming the same distribution in Arctic sea ice together with the ice cover from Comiso & Nishio (Reference Comiso and Nishio2008) then the precipitation of CaCO3 would be responsible for a flux between 0.04 and 3 Tg C. For both the Arctic and Antarctic this would be between 0.1% and 4.5% of the air-sea CO2 flux in open oceanic water at high latitudes (Takahashi et al. 2009, Rysgaard et al. Reference Rysgaard, Bendtsen, Delille, Dieckmann, Glud, Kennedy, Mortensen, Papadimitriou, Thomas and Tison2011) or up to 13% for the Southern Ocean south of 50° (Takahashi et al. 2009). Although there is a large amount of ikaite in the snow, the amount of CaCO3 therein was not taken into account for the calculation, since the distribution of CaCO3 crystals in the snow remains elusive. However, if widespread this would be a significant addition to the polar carbon flux.
In addition, considering polynyas with new sea ice forming during the winter, and assuming that CaCO3 precipitation mainly occurs during young sea ice and frost flower formation, this phenomenon might then contribute even to a larger extent to the air-sea flux. However, this would only be the case if CO2, which is released during CaCO3 precipitation, is rejected to the underlying water column. Yet, polynyas are still poorly understood with respect to gas fluxes (Else et al. Reference Else, Papakyriakou, Galley, Drennan, Miller and Thomas2011). Therefore it is essential to determine and quantify the CO2 pathways during sea ice formation to fully quantify the contribution of calcium carbonate precipitation to the air-sea CO2 flux. The fact that ikaite is mainly formed at the surface of sea ice adds support to the work of Sander et al. (Reference Sander, Burrows and Kaleschke2006) and Sander & Morin (Reference Sander and Morin2010) which described the contribution of CaCO3 precipitation to ozone depletion events. It also supports the work of Sala et al. (Reference Sala, Delmonte, Frezzotti, Proposito, Scarchilli, Maggi, Artioli, Dapiaggi, Marino, Ricci and De Giudici2008), since ikaite crystals at the snow-ice interface and in the snow are more likely exposed to aeolian transport and could therefore serve as sea ice proxy.
Conclusions
This study provides an investigation of the spatial and temporal distribution of CaCO3 in sea ice. We showed the heterogeneous occurrence of CaCO3 in sea ice. Large-scale quantification of CaCO3 precipitation in different types of sea ice and during the entire season in both the Arctic and Antarctic is necessary to validate these findings and to provide a quality dataset to estimate its contribution to the polar carbon cycle. Since parameters measured during sample collection do not reflect conditions at the time of precipitation, much work is needed to evaluate the conditions of calcium carbonate precipitation within sea ice and its fate during sea ice melt.
Acknowledgements
We thank the EPONTA (EPONTic micro-algae adapted to sea ice) program for funding and Institut Polaire Francais, Paul-Émile Victor (IPEV) for logistical assistance during the DDU campaign. We thank Harald Zöller, Thomas Spangenberg, Michael Wünsch, and Karlheinz Cerff for technical and computing support before and during the measurements, as well as Christiane Uhlig for preparing the samples for mineralogy and synthetic ikaite. We also thank Frank Gérard, all the scientists, and technicians from the French research station Dumont d'Urville, Antarctica as well as the captain and crew of the polar vessel Astrolabe and the pilots of the Australian Antarctic Division for all their help and support. Andreas Krell, Louiza Norman, and Klaus Meiners are particularly grateful for the support of the SIPEX team and crew of Aurora Australis, especially the expedition leader Tony Worby. David Thomas and Louiza Norman thank NERC (UK) and the Leverhulme Trust for funding. We thank the DFG for financial support through grant NE 1564/2-1 (SPP1158). This project was supported by the Australian Government Co-operative Research Centre Program through the Antarctic Climate and Ecosystems Co-operative Research Centre (ACE CRC) and through Australian Antarctic Science grant #2767. The constructive comments of the reviewers are gratefully acknowledged.
Supplemental material
A supplemental table will be found at http://dx.doi.org/10.1017/S0954102012001150.