

I. Introduction
While other United Nations (UN) bodies have occasionally taken notice of alcohol’s role in health and welfare issues, only the World Health Organization (WHO) has paid sustained attention to alcohol issues; however, that attention has been sporadic and generally poorly resourced.Footnote 1 One factor that has contributed to some increase in the attention given in the new millennium to alcohol-related issues has been the advent of estimations of the Global Burden of Disease Study as a tool for evaluation and priority-setting, including the assessment of contributions of diverse risk factors to the burden of disease.Footnote 2
Since the mid-1990s, there have been Comparative Risk Assessments for the most important risk factors such as alcohol,Footnote 3 and regardless of how many risk factors were compared, alcohol use was ranked in all of these assessments as one of the top 10 contributors to the global burden of disease.Footnote 4 The current mortality burden of alcohol use is estimated to be about 3 million deaths per year.Footnote 5
The realisation of alcohol’s marked public health impact was one of the major reasons behind the WHO’s increased activity since the early 2000s in alcohol policy formulation: indeed, the resolution of the World Health Assembly in 2005 on “Public Health Problems Caused by Harmful Use of Alcohol”Footnote 6 was the first notable activity since its 1983 resolution on “Alcohol Consumption and Alcohol-Related Problems: Development of National Policies and Programmes”.Footnote 7 The 2005 resolution begins by referring to alcohol as a risk factor and references the prior Comparative Risk Assessment,Footnote 8 which was the first such comprehensive assessment, comparing twenty-six different risk factors.Footnote 9
Beginning in 2005, alcohol use was finally included in some international resolutions and statements of political commitment. Three such resolutions deserve the most attention: the WHO’s Global Strategy to Reduce the Harmful Use of Alcohol (Global Alcohol Strategy),Footnote 10 the Global Action Plan for the Prevention and Control of NCDs 2013–2020 (Global NCD Action Plan), with a specific target of reducing the harmful use of alcohol by 10%,Footnote 11 and the Sustainable Development Goals (SDGs), where a reduction of harmful alcohol use is explicitly included in SDG Goal 3, Target 3.5, Indicator 3.52.Footnote 12
The term “harmful use” is used herein in accordance with the terminology used in the original texts. However, in the operationalisation of the monitoring of “harmful use”, adult alcohol per capita consumption is used, in most cases, as an indicator. This is the case with the SDGs and the Global NCD Action Plan.Footnote 13
The use of per capita consumption as an indicator is based, in part, on the fact that any amount of alcohol consumption is associated with the risk of a negative health outcome. For instance, an elevated risk of female breast cancer has been clearly linked to average drinking levels of less than one standard drink per day (ie less than ten grams of pure alcohol per day).Footnote 14
In light of alcohol consumption constituting a leading risk factor for the burden of disease, and with regard to the international resolutions aimed at reducing alcohol use and its attributable burden, this article aims to examine:
Whether the objectives and targets of the relevant international resolutions have been or will be met;
Whether the public health consequences attributable to alcohol use have increased or decreased; and
How international agencies have reacted to the evaluations of alcohol targets.
II. Methods and data analyses
UN documents were searched for evaluations of the progress towards the Global Alcohol Strategy, the Global NCD Action Plan and the SDGs.Footnote 15 In addition, we searched the peer-reviewed literature to obtain documents relevant to the evaluation of the three main resolutions described above.
Mortality and morbidity data were obtained from the Global Health Estimates,Footnote 16 population data were obtained from the UN Population Division (2017 revisions)Footnote 17 and Human Development Index (HDI) data were obtained from the UN Development Programme.Footnote 18 Data on country-specific and global levels of alcohol use were taken from a recent modelling study based on country-validated data and forecasts.Footnote 19 Uncertainty intervals (UIs) were estimated using a Monte Carlo-like approach.Footnote 20 We use the term “UI” rather than “confidence interval” (CI) to avoid misunderstandings created by the latter term.Footnote 21
Based on these materials, a narrative review was conducted and key statistics for alcohol use and the alcohol-attributable health burden were calculated.
III. Results
1. Policy changes following the Global Alcohol Strategy: extent of implementation
The Global Alcohol StrategyFootnote 22 arose from a resolution of the World Health Assembly in 2010. It is a non-binding statement of political commitment from WHO members, which does not specify exact quantifiable objectives, but rather offers a toolkit of dozens of policies from which members may choose. Thus, it is difficult to evaluate.
Nonetheless, the 2019 World Health Assembly asked the WHO “to report to the Seventy-third World Health Assembly in 2020 on the implementation of the Global Alcohol Strategy during the first decade since its endorsement, and the way forward”.Footnote 23 This request led to regional consultations and to a new round of data collection from all Member States (in the second half of 2019).Footnote 24 Based on these consultations and other data collected, in February 2020 the WHO Executive Board adopted a decisionFootnote 25 requesting WHO staff “to develop an action plan (2022–2030) to effectively implement the global strategy to reduce the harmful use of alcohol as a public health priority”, and “to develop a technical report on the harmful use of alcohol related to cross-border alcohol marketing, advertising and promotional activities, including targeting youth and adolescents”. Any clearer objectives, or exploration of the feasibility of developing a more binding international instrument for alcohol control akin to the framework convention on tobacco, as proposed by some Member States,Footnote 26 were not considered, and further steps were put off until 2030.Footnote 27
The decision taken by the WHO Executive Board seems to acknowledge that the Global Alcohol Strategy needs to be accelerated, but does not go further, and it does not address the problems that have been evidenced in the evaluations to date, which will be summarised below.
The World Health Assembly in 2020 was significantly shortened and held as a virtual meeting due to the coronavirus pandemic (COVID-19),Footnote 28 and alcohol use was not considered to be a priority topic in the context of the global health crisis.Footnote 29 Another abbreviated World Health Assembly will take place in the autumn of 2020, but again alcohol use is not expected to play a major role there.
Some interim evaluations of the first five years following the Global Action Strategy’s implementation have been published.Footnote 30 A review of the implementation of the most effective and cost-effective measures among these policies, the so-called “best buys” (ie raising excise taxes for alcoholic beverages, increasing restrictions in physical availability, bans on advertising),Footnote 31 leads to the following assessments about the extent to which these “best buys” have been implemented in domestic law and policy.Footnote 32 It is difficult to evaluate the effects of increases in the price of alcohol due to increased taxation, as it would be necessary to take into consideration inflation in the particular jurisdiction. Thus, increases in taxation are not per se an implementation of the recommended policy if they do not at least keep up with the regular price increases caused by inflation. As a result, no comprehensive evaluation has been done in this respect, but the available information seems to indicate that adjustments for inflation are not frequent; in addition, subsidies for alcohol production are still in place. In other words, alcohol has become cheaper in real terms, and if average income is also considered, alcohol has become more affordable over recent years in almost all countries (eg for beer, see Blecher et alFootnote 33 ). Similarly, there has been no overall success observed as a result of the implementation of availability restrictions or of comprehensive bans on marketing.Footnote 34 There are a few exceptions of note, such as the alcohol control policies in Russia,Footnote 35 in LithuaniaFootnote 36 and in Sri Lanka,Footnote 37 but such exceptions do not change the evaluation overall.
On the other hand, the soft policies – infrastructural measures without any clear impact on harmful use – seem to have been implemented the most frequently (eg the establishment of a national plan or a monitoring system).Footnote 38 In other words, the measures suggested by the Global Alcohol Strategy that were the most widely implemented are the same ones that, to date, have not shown much impact on the main objective of this strategy: a reduction in alcohol-attributable harm.
2. Changes in the harmful use of alcohol
As indicated above, the Global NCD Action Plan specified that, from a baseline of 2010, a relative reduction in the harmful use of alcohol of at least 10% should be achieved for each country.Footnote 39 The SDG Goal 3.5 uses the same indicator, but extends the timeframe to 2030.Footnote 40
The last comprehensive alcohol monitoring study found that global alcohol consumption was almost static, with a change from 2010 to 2017 of only 1.0% (95% CI: –3.1 to 4.9) from 6.4 litres/year in terms of adult per capita consumption (95% CI: 6.2 to 6.6) to 6.5 litres/year (95% CI: 6.0 to 6.9).Footnote 41 This overall stagnation hides some notable regional changes: the greatest proportional decrease was seen in Andean Latin America, in the countries of the former Soviet Union and in the newly independent countries in Eastern Europe and Central Asia, and the greatest proportional increase was seen in South Asia and South-East Asia.Footnote 42
The predictions for change by 2030 do not foresee decreases in consumption; in fact, globally higher levels of consumption are predicted for 2025 and 2030. Obviously, predictions from 2019 could not have taken COVID-19 into account, and availability restrictions resulting from the pandemic will likely cause a temporary reduction in the level of alcohol consumption.Footnote 43
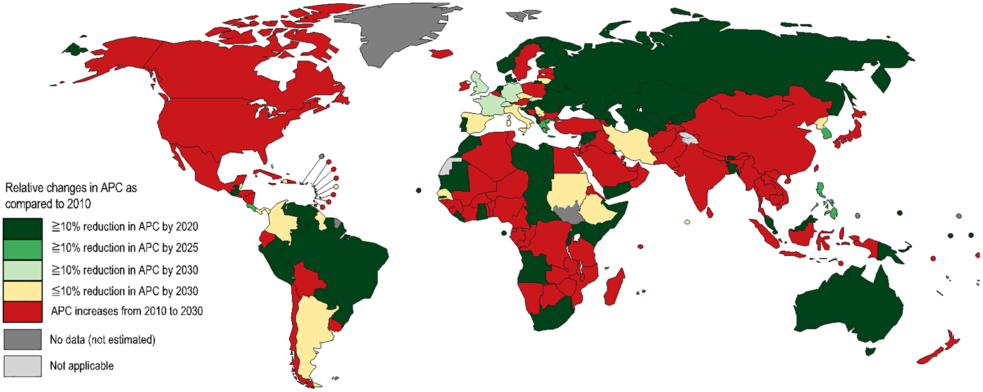
The expected proportional changes in consumption by 2020, 2025 and 2030, by country, are shown in Figure 1.
Estimated or predicted relative changes in the level of alcohol consumption in litres of pure alcohol per adult per year compared to 2010. APC = adult alcohol per capita consumption (in litres of pure alcohol); adult is defined as fifteen years of age and older.

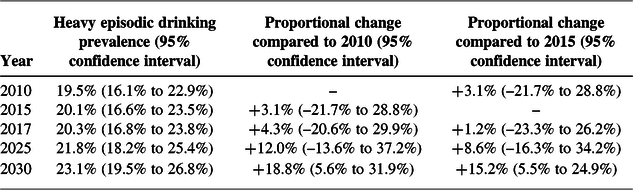
Predicted changes in heavy episodic drinking, another indicator of harmful drinking that was proposed in the last round of UN consultations,Footnote 44 are summarised in Table 1. These changes, although with wide CIs based on the estimation method, also indicate no decreases.
Global prevalence of heavy episodic drinking in selected years and proportional change between years.

3. Changes in alcohol-attributable harms since 2010
The international instruments discussed here are restricted to those that relate to health harms caused by alcohol, leaving out any other kinds of harm (eg social harms). In order to discuss such harms, different indicators have to be considered, as well as the economic wealth of countries, as alcohol consumptionFootnote 45 and harmFootnote 46 have been shown to vary by economic wealth.
There are three main indicators of alcohol-attributable harms. The first indicator compares the numbers of health harms, usually alcohol-attributable deaths and burden of disease, with the latter usually measured in disability-adjusted life-years (DALYs) lost.Footnote 47 This indicator has increased slightly globally since 2010, both overall and for men. The second indicator, the alcohol-attributable fractions of mortality and DALYs lost, indicates the proportion of overall mortality and burden of disease caused by alcohol (defined against a counterfactual scenario of a world without alcohol use).Footnote 48 This indicator has been more or less stable since 2010. Finally, the third indicator measures alcohol-attributable age-adjusted rates of health harm indicators (ie the number of deaths or DALYs per 100,000 or 1,000,000 of the general population caused by alcohol). Alcohol-attributable age-adjusted rates decreased, despite slightly increasing alcohol consumption, both for alcohol-attributable mortality (point estimate: –12.0%; 95% CI: –28.9% to 8.6%) and for alcohol-attributable DALYs lost (point estimate: –8.8%; 95% CI: –24.6% to 10.5%).Footnote 49 All three types of indicators are impacted by changes in population distributions (ie the growth and ageing of populations) and by changes in mortality and disability, but to varying degrees (see below for details). In general, the larger the population size and the older the population on average, the higher the number of deaths and DALYs lost. In addition, over the past century, there has been an overall trend of increasing life expectancies and thus decreasing mortality rates;Footnote 50 although this trend has come to a halt in some countries such as the USA,Footnote 51 it will likely also be interrupted by COVID-19 in many other countries.
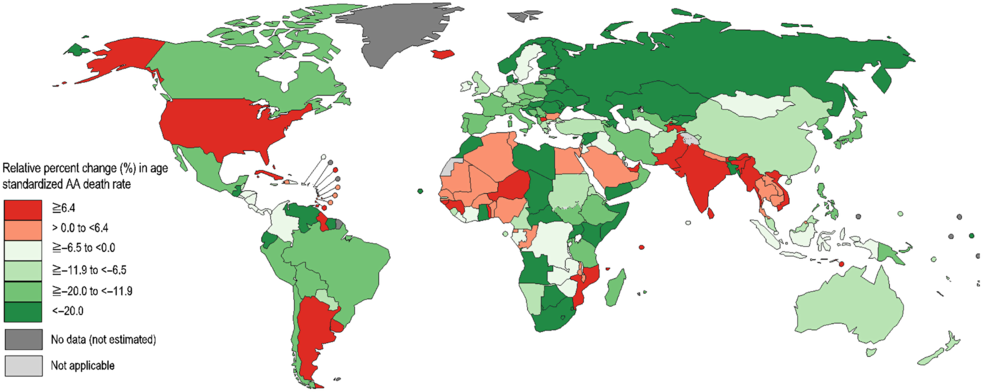
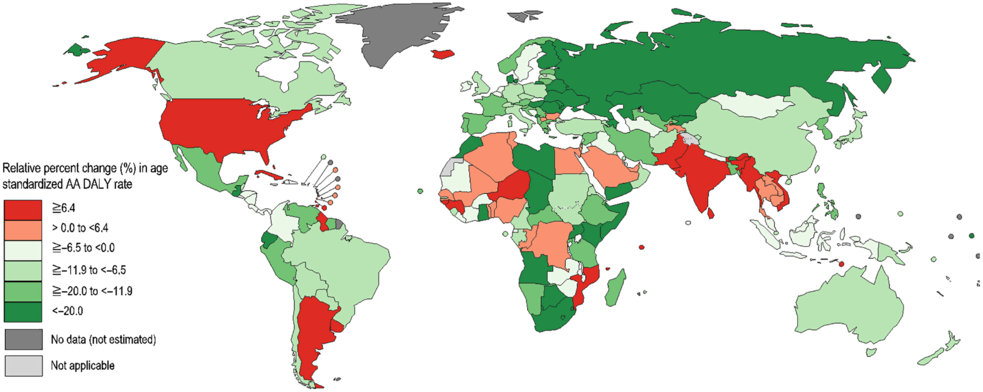
The country trends in alcohol-attributable burden can be seen in Figures 2 and 3.
Relative changes in alcohol-attributable (AA) age-standardised mortality rates for 2010–2016 by country.

Predicted relative changes in alcohol-attributable (AA) age-standardised burden of disease rates for 2010–2016 by country. DALY = disability-adjusted life-year.

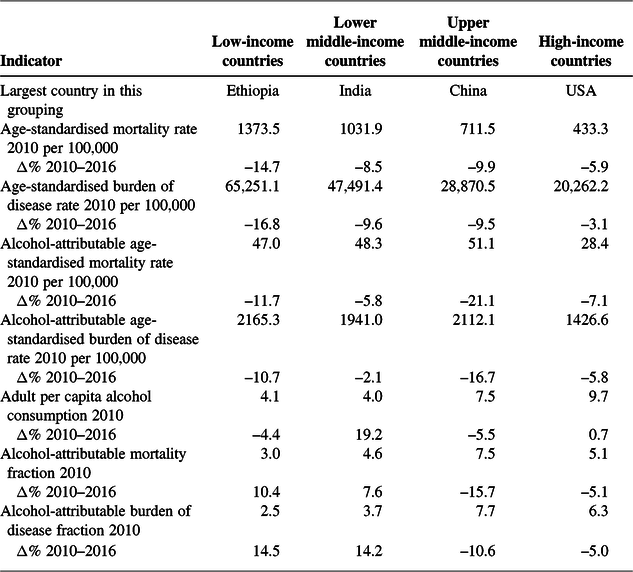
Despite stable or slightly increasing levels of alcohol consumption, alcohol-attributable health burdens have decreased significantly since 2010 due to overall trends in these burdens. Both age-standardised mortality (–9.0%) and DALYs lost (–9.5%) decreased markedly between 2010 and 2016, most notably in low-income countries (see Table 2). Analyses done only on European countries have indicated that alcohol-attributable mortality between 2010 and 2016 was even more impacted by trends in mortality than by trends in alcohol use;Footnote 52 however, this would not have been the case had all countries been included in the analyses.
Trends for 2010–2016 for indicators impacting on the alcohol-attributable burden of mortality and disease.

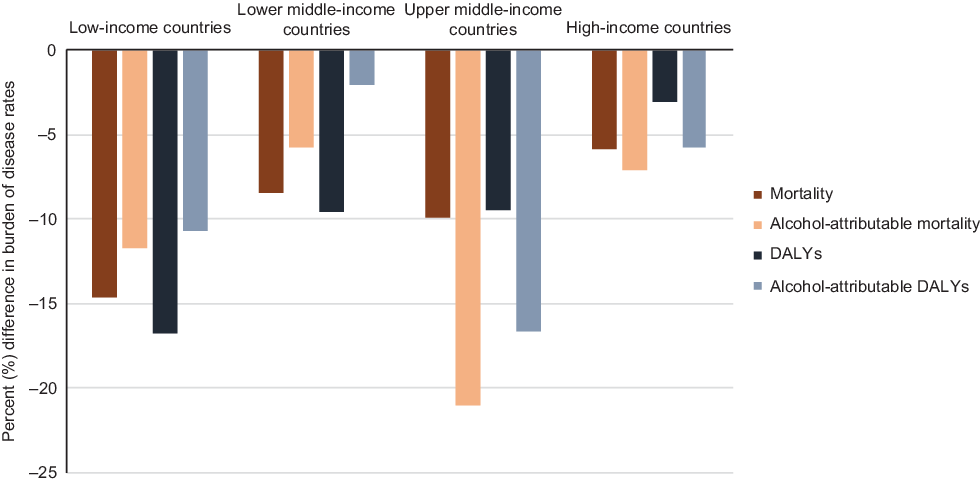
Since 2010, age-adjusted mortality and the burden of disease have both decreased and life expectancies have increased. These trends follow a gradient of wealth and are most pronounced for low-income countries and least pronounced for high-income countries. Second, as indicated above, alcohol-attributable age-adjusted mortality and burden of disease rates have also decreased, at approximately the same rate globally. Notably, alcohol-attributable health harms decreased faster than overall health harms for upper middle-income and high-income countries, but more slowly than overall health harms in low-income and lower middle-income countries (Figure 4 and Table 2). As a result, the proportions of alcohol-attributable mortality and of burden of disease – which both remained stable globally – increased markedly for low-income and lower middle-income countries and decreased for upper middle-income and high-income countries (Table 2).
Changes in overall and alcohol-attributable age-adjusted mortality and burden of disease rates between 2010 and 2016. DALY = disability-adjusted life-year.

Finally, when all relevant variables were entered into regression equations to explain the changes in the alcohol-attributable mortality and DALYs lost rates, the following results emerged (see Rehm et alFootnote 53 ):
Changes in adult per capita alcohol consumption had the most significant impact (ie the higher the adult per capita consumption, the higher the alcohol-attributable burden), but changes in the age-standardised death or DALYs lost rates were also notable.
Neither changes in heavy episodic drinking nor changes in economic wealth as measured by the gross domestic product based on purchasing power parity had a significant impact in either regression model.
IV. Discussion
While there were decreases between 2010 and 2016 in the age-adjusted alcohol-attributable mortality and burden of disease rates, these decreases primarily reflect overall progress in global health during this time; indeed, during this time, the impact of alcohol remained stable or increased in low- and middle-income countries. Predictions are for a worsening of the situation: levels of alcohol use are expected to increase globally despite a predicted decrease in consumption in high-income countries.
However, as indicated above, these predictions do not take into account changes in alcohol consumption caused by COVID-19 and triggered by the resulting reduced availability and lower affordability for some groups.Footnote 54 It is not yet clear if such changes will be permanent or temporary.Footnote 55 Other major public health crises have caused short-term reductions in alcohol use, but consumption and harm actually increased in the long run, especially for some populations.Footnote 56 However, any changes in alcohol consumption caused by COVID-19 and associated economic changes are clearly independent of the resolutions and statements discussed here.
The international attempts to control alcohol use and its attributable burden have not been successful overall, and reactions from UN agencies to the largely negative evaluations of international goalsFootnote 57 have not, thus far, resulted in any changes in strategy. In the most recent example, which was discussed in more detail above, the Executive Board of the WHO, while asking for acceleration of the Global Alcohol Strategy, maintains its continuation despite no evidence of its success in reducing the harmful use of alcohol. Moreover, the Executive Board rejected requests from low-income and middle-income countries to even explore the feasibility of more powerful and normatively persuasive instruments, such as a treaty or convention.Footnote 58 This will mean that changes in policy will be left up to countries and civil societies in a globalised world, where such changes face more and more international barriers.Footnote 59 The burden of alcohol use is borne primarily in low-income and middle-income countries, and the UN system appears unwilling or unable to effect real change, in part because of the influence of high-income countries, where most of the alcohol producers are situated.
V. Conclusions
If the current trends in international policymaking and the resulting increases in alcohol consumption continue, more than 3 million deaths will be caused by alcohol use each year. The only way to change this situation seems to be the implementation of normatively more persuasive instruments, such as a treaty or a framework convention.Footnote 60 The example of tobacco has shown us that such instruments require more pressure from national governments and from international non-governmental organisations to counter the pressures exerted from the alcohol industry. Unfortunately, there seems to be a lack of such non-governmental organisations that are willing to participate in the field of alcohol policy.Footnote 61