Decades of research have concluded that party identification has its origin in pre-adult political socialization.Footnote 1 Even though new work suggests that genetic inheritance may account for some of the effect attributed to parental socialization, there is little evidence that parent-child similarity in partisan predispositions can be explained by genetics.Footnote 2 Instead, children develop a partisan identity as they learn about politics from the parents’ point of view. As Greenstein put it, one of the first political messages that parents convey to their children is that ‘we’ are Democrats or ‘we’ are Republicans.Footnote 3 In this way young individuals are introduced to the ‘goodies’ and ‘baddies’ of the political world.Footnote 4 Accordingly, they form their partisan preferences before they develop a sophisticated understanding of politics.Footnote 5 These attachments may not be strongly felt, but children rarely declare a party identification with the main rival of the party to which their parents are loyal.Footnote 6
Research in social psychology agrees on this point. In what probably constitutes the most influential critique to the long-standing notion that children's personalities are shaped by their parents, Harris suggests that what matters for the formation of an adult is genes and peers. Still, as the author acknowledges, the ‘nurture thesis’ does not hold for the development of political preferences. Political views acquired at home are not undermined by conformity within peer groups. Partisan identities brought to the peer group are not modified, at least not during childhood, because they are not defining features that link the members of the group.Footnote 7
As children enter and move through early adulthood, however, the strength and direction of their partisan orientations do sometimes shift.Footnote 8 The flux is greatest in early adulthood and dissipates with age, with strength and stability of party identification the norm by middle age.Footnote 9 Thus while a childhood party identification is more likely to persist into adulthood than any other political attitude, it is not immune to revision based on the individual's own experience with politics.
Beneath these generalizations lies significant variability. For some, the partisan affiliation expressed in childhood persists, and for others it does not. Efforts to explain this variation have focused on the strength of the socialization experienced in childhood. For example, Jennings, Stoker and Bowers showed that a childhood party identification (PID) was more likely to be retained later in life if it matched the PID socialized by parents, while Zuckerman, Dasovic and Fitzgerald found that stability in PID over the lifespan declined among those whose parents were weak identifiers.Footnote 10
These explanations of variation in the endurance of childhood PID emphasize one side of what is a two-sided question. They consider the strength of the initial socialization, but neglect the strength of the change-inducing circumstances that individuals confront later in life. Both must be considered in order to understand the development of political attitudes over the lifespan.
Once they leave their parental home, young adults are apt to encounter new political stimuli, some of which may contradict their parental partisan lessons. Political learning may be prompted by mass media communications or through experiences in college, in the workplace, or in newly formed social networks and families.Footnote 11 Exactly how these experiences affect young adults’ political attitudes is not easily ascertained, as it depends on their particular social location and political experiences. However, the frequency with which these cues are received is expected to depend on an individual's level of political interest and attentiveness.Footnote 12 Those who are politically engaged are most likely to be exposed to new political stimuli in early adulthood.
Here again, political socialization enters in, since a person's attentiveness to public affairs is shaped by their experiences during childhood and adolescence. Although they are not the only agent of socialization,Footnote 13 families play an important role in inspiring children to take an interest in the political world.Footnote 14 The more politicized the parents are, the more successful is the transmission of political interest to the child.Footnote 15 Thus a person who exhibits high levels of political engagement in young adulthood is likely to have come from a home in which the parents were highly politically engaged too.
Parents’ level of political engagement thus plays a dual role in the political socialization of the young. It boosts the intensity of pre-adult political learning, strengthening the transmission of political attitudes from parent to child. It also makes children more politically engaged themselves. Taken together, a seemingly counter-intuitive hypothesis arises. Youth from politicized homes may be more likely to acquire an initial partisan orientation from their parents, but they are also more likely to abandon that preference as they enter adulthood and experience politics for themselves.
This article examines this hypothesis and sheds light on the mechanisms driving this pattern. Before doing so, however, it is important to develop the idea further by considering the findings from the existing literature.
Transmission and Its Endurance: The Role of Parental Politicization
Based on an individual's perceptions about their parents’ political views, the early political socialization research suggested an almost photographic reproduction of political values within the family.Footnote 16 This pattern left little room for a more nuanced exploration of possible sources of variability in the rates of political reproduction. Studies based on data collected independently on children and parents challenged this established wisdom, however.Footnote 17 Reported coefficients of association between parents and children were only modest, calling for an investigation of the conditions that favour the transmission of parental political beliefs.Footnote 18 Drawing on the insights of social learning theory,Footnote 19 few studies have pointed to the importance of parental politicization. After analysing a long series of political measures, Jennings, Stoker and Bowers conclude that ‘[f]amilies marked by parent political engagement and frequent political interchanges are families fostering the transmission of political attitudes and identities from parent to child’.Footnote 20 Looking at 2006 high school seniors, Wolak reaches the same conclusion.Footnote 21 By discussing politics at home, parents produce less ambiguous partisan signals and thus facilitate reproduction, either as the outcome of role modelling or as a result of overt transmission.Footnote 22
As offspring grow up, however, the initial impact of parental socialization seems to diminish.Footnote 23 Although the question of how this influence wanes as the offspring age has not been systematically addressed, some studies have reconsidered the role of political engagement. Beck and Jennings found that young adults who came from highly politicized families in the United States were more likely to switch into independence from 1965 to 1973 than those from less politicized families.Footnote 24 The authors interpreted these results in light of the turbulent political period of the 1960s and early 1970s, arguing that the more politicized youth were more susceptible to the forces of the times.Footnote 25 Likewise, Jennings, Stoker and Bowers found that in the 1960s, children from politicized homes were more likely to disagree with their parents on the issue of school integration than those from apolitical homes.Footnote 26 The former were more likely to hold pro-integration views, presumably due to their greater exposure to the civil rights movement.
As with these examples, the argument developed here emphasizes the indirect role that parental politicization plays in determining the longevity of parents’ influence. The initial premise is based on Converse's theory of how party identification develops over the lifespan. According to Converse, political attitudes in early adulthood are a function of prior attitudes, shaped by parental socialization, and new experiences and communications.Footnote 27 Achen formalized this intuition by modelling the formation of partisan preferences as the outcome of a Bayesian learning process that pulls young people towards the current trend within society.Footnote 28 Any deviation from parents’ views will thus reflect the direction of new information flows during early adulthood.
Although the partisan direction of these cues will depend on the time period and the specific social locations of individuals, the magnitude of their influence on youth's partisan outlooks should vary according to the individual's latent predisposition to receive such cues, which in turn will depend on her level of political involvement. Although selective exposure will shape some information flows,Footnote 29 others can be thought of as operating exogenously. People do not tend to choose colleges or jobs on partisan grounds. And while sorting is strong in the selection of spouses,Footnote 30 it is much weaker when it comes to whom a young person interacts with in college or the work environment. Exposure to political discussion in such contexts may challenge previously held views.
Social learning theories provide ample support for this argument. Mutz and Mondak show that the social context with the highest potential to generate cross-cutting political influences is the workplace.Footnote 31 Klofstad analyses panel data of undergraduate students who were randomly assigned a roommate in their first year of studies.Footnote 32 He finds that political discussions with the roommate boosted civic engagement and political participation. These findings reaffirm the importance of ‘weak ties’: people often lack the necessary discretion to control their agenda of social contacts.Footnote 33 Thus, as Huckfeldt and Sprague argue, ‘people who are strategically located to affect political preferences and choices are not necessarily close friends or family but rather the structurally provided associates with whom we share a common space’.Footnote 34
Political discussions are typically fuelled by the occurrence of political events, which often carry significant partisan connotations. Previous research has shown that individuals’ political attitudes are particularly sensitive to new events during the years of early adulthood.Footnote 35 In the words of Alwin and McCammon, this ‘unique intersection of biography and history’ gives room for what Mannheim referred to as the ‘historical dimension of the social process’.Footnote 36
The occurrence of new political events, and the presence of new political networks and contexts, will not necessarily lead to a change in PID, however. Two further attributes are essential. First, the individual must be attentive to the political cues and messages that others are providing. The probability of exposure to such cues and the attention given to them are both positively associated with higher levels of political awareness and interest.Footnote 37 Secondly, young adults must develop accurate beliefs about others’ opinions. This is true both when parents are the providers of political stimuli and when the young individual acquires new extrafamilial discussion partners.Footnote 38 Perceptual accuracy is higher when the attitudinal domain is more salient to the recipient of these cues. Again, this is more likely to be the case when young adults are interested in politics.Footnote 39
Finally, politically interested young adults are likely to have grown up in politicized families. An adolescent acquainted with political discussions within the family will probably continue to talk about politics in her new social contexts. A person whose early socialization promoted knowledge of and interest in politics will likely continue to be attentive and interested as she moves through her adult years. This contact will bring her closer to external influences that might induce her to revise her political worldview. These ideas lead, first, to the following hypothesis:
Hypothesis 1: Young adults from highly politicized homes are more likely to deviate from their parents’ partisan preferences.
Hypothesis 1 is predicated on the idea that individuals whose parents are highly politically involved are more likely to be exposed to (and affected by) political cues transmitted during their adulthood. Drawing on the ideas developed above, at least two factors provide such cues: new social contexts and political events. We should thus expect individuals from highly politicized homes to be more likely to:
Hypothesis 2A: Revise their partisan preferences as a result of entering into new social contexts.
Hypothesis 2B: Revise their partisan preferences in response to new political events.
A change in partisanship should, in most cases, not result from a direct confrontation between peers’ PID and parental PID. Rather, it should follow the accumulation of information that questions the initial political views of adolescence. The literature on the development of party identification has emphasized the dynamic interplay between issues and partisanship.Footnote 40 Partisan divergence should thus be accompanied by a shift in issue orientations, away from parental views:
Hypothesis 3: Individuals from highly politicized homes are more likely to abandon their parents’ opinions on salient political issues.
The empirical analysis starts by examining whether parental politicization increases their offspring's deviance from parental partisan preferences during early adulthood (Hypothesis 1). I then assess the indirect role of parental politicization, looking at whether young adults from highly politicized families are more likely to qualify their partisanship as a result of (1) entering a new social context (Hypothesis 2A); or (2) experiencing a salient political event (Hypothesis 2B). The next test examines whether young individuals from more politically engaged families are also more likely to abandon their parents’ views on two salient issues of the period under investigation (Hypothesis 3).
This analysis is followed by three important extensions. First, I test an observational implication of Hypothesis 1. The Southern realignment coincided with the period of early adulthood of our respondents. My theory predicts that the shift away from the Democrats was primarily driven by the politicized youth of that period. Secondly, I explore the long-term trajectory of parent-child similarity during the offsprings’ lifespan. Thirdly, I test the generalizability of Hypothesis 1 in different political settings and periods. The concluding remarks discuss how the findings from this analysis complement important insights from recent studies that focus on the role of parental influence in the development of PID.
Data
For the core set of analyses I use data from the Jennings-Niemi-Stoker Parent-Youth Socialisation Study.Footnote 41 The first wave of this study took place in 1965 when a nation-wide random sample of high school seniors (second generation, born in 1947 or 1948), together with one or both of their parents (first generation), were interviewed.Footnote 42 Both cohorts were re-interviewed in 1973 and again in 1982. The last wave of this study came in 1997 when the initial youth cohort, then fifty, was re-interviewed for a fourth time.
The use of this particular dataset is justified for three reasons. First, it is one of the very few studies that is based on a random sample of young individuals.Footnote 43 Secondly, since it is a long-term panel study, it allows an examination of change in the level of parent-child convergence as children move through adulthood. Thirdly, it interviews the parents of the 1965 generation, thus providing direct measures of the political views and level of political involvement of the parents when the children were growing up.
Model
The core hypothesis (Hypothesis 1) asserts that parental politicization causes greater partisan deviations between parents and children when the latter leave their parents’ home. The empirical configuration of this statement implies a difference-in-difference framework, as denoted by Equation 1:
 $$ { & \left\{ {{\rm{\Delta }}PID\left| {Chil{{d}_{{\rm{73}}}}{\rm{ - }}Paren{{t}_{{\rm{65}}}}} \right|{\rm{ - \Delta }}PID\left| {Chil{{d}_{{\rm{65}}}}{\rm{ - }}Paren{{t}_{{\rm{65}}}}} \right|} \right\}\, \cr & = \,a\, + \,bParentalPoliticisation\, + \,Xc \,+ \,{{e}_{is}} \cr} $$
X denotes the matrix of control variables and c denotes the vector of coefficients associated with X. The subscript s in eis denotes a clustering of the errors at the school level. The key coefficient is b. Given that Hypothesis 1 does not have a directional component, I examine the absolute partisan difference between parents and offspring. The expectation is that b > 0, reflecting the positive impact of parental politicization on deviations from parental partisanship between 1965 and 1973.
I begin with the period 1965–1973 because it covers what is thought to be the most important period of adult political development – the so-called impressionable years.Footnote 44 During this time, the younger generation aged from eighteen to twenty-six and experienced many important developments in their lives. Most of them had finished their studies, found a job and gotten married by 1973, as was the norm at that time.Footnote 45 Using the three first waves of the same study, Plutzer found that the only significant predictors of the growth curve of electoral participation after the age of eighteen took place during this period.Footnote 46 The greatest gains in attitudinal stability also occurred between 1965 and 1973.Footnote 47 I also consider later adult years in the long-run analyses presented below.
Measurement
The estimation of Equation 1 needs appropriate measures for each of its terms. Three points need to be made about measurement. The first regards how parental partisanship was constructed to represent the views of both parents in two-parent homes. The second refers to the measurement of the differenced dependent variable. The third involves the measurement of family politicization.
Parental Partisanship
To capture the partisan environment during childhood and adolescence, we need to employ information about the partisan attitudes of both parents when two are present, which was true of the overwhelming majority of cases in the study (93.5 per cent).Footnote 48 This task is made partially feasible due to the structure of the study. The parental survey is randomly divided into three parts. For one-third of the youth sample, only the father was interviewed, for another third only the mother was interviewed and for the last third both parents were interviewed. In all cases, however, each parent was asked not only about his/her PID but also about the PID of his/her spouse. Accordingly, I use the information from the two-thirds of the sample for which one of the parents was interviewed to construct a summarizing indicator about the distribution of partisanship within the family. The resulting family-PID variable ranges again from 0 to 6, with scores in the midpoints between each set of adjacent integer values (0.5, 1.5, …, 5.5), since it comprises the average of the PID score of each parent.Footnote 49
The Dependent Variable
This variable now needs to be combined with the measure of child PID in order to construct the two indicators of parent-child similarity (for 1965 and 1973). At this point, the original ordinal-level character of the PID scale needs to be reconsidered. The literature on the measurement properties of the PID scale has highlighted problems of transitivity.Footnote 50 Although ordinal regression techniques have partly resolved this problem when PID is used as an outcome variable, here it is still important because PID is used as the initial variable in the construction of the final dependent variable. If the difference between being a weak partisan and a leaner is not the same as the difference between a leaner and an independent (or the difference between a weak partisan and a strong partisan), assuming that this is the case would lead to a final scale that does not do full justice to the level of congruence between parent and child. To capture such differences, the PID measure needs to be transformed before taking the absolute value of the difference between parents and children. This is done with optimal scaling. Details about this procedure can be found in the online supplementary material (Appendix A).
Parental Politicization
The 1965 parental questionnaire includes many relevant items that capture both subjective interpretations and behavioural aspects of this concept. I distinguish between three sets of indicators: subjective evaluations of political interest, actual political involvement and media consumption. Three corresponding subscales are constructed and eventually combined through factor analysis. The resulting scale ranges from 0 to 8, with a mean value of 4.57. In cases in which both parents were interviewed, the mean value of their politicization scores was used.Footnote 51
Full details about the measurement strategy used in the construction of the parental politicization index are provided in the online supplementary material (Appendix B). Here I evaluate the properties of the resulting scale by engaging in convergent and construct validation. Regarding the first (‘the comparison of the key measure against one or more measures of the same or a closely related underlying concept’),Footnote 52 the scale correlates significantly with an index of parental political knowledge (0.48) and with parental political efficacy (0.38). Moreover, parents who talk more about politics at home are more likely to correctly predict the partisanship of their child.Footnote 53 To evaluate the scale's construct validity (that is, to examine whether ‘the empirically observed outcomes are consistent with the theoretical predictions’),Footnote 54 I focus on the offspring. Children from more politicized families talk more about politics both at home (polyserial correlation 0.24, SE = 0.03) and with their friends (r = 0.16, SE = 0.03). Moreover, parental politicization is a significant predictor of offspring political knowledge in 1965 (polyserial correlation 0.24, SE = 0.03). A final check asks whether parental politicization helps the child acquire a coherent understanding of the ideological underpinnings of the observed differences between the parties. Using the ideology index from the student survey, based on Converse's model of mass perceptions about political issues,Footnote 55 we find that children of more politicized families are more likely to have a consistent understanding of the ideological differences between the parties than children from less politicized families (r = 0.23, SE = 0.03).
The Transmission of Political Interest
For the theoretical argument to hold, parental political interest needs to be transmitted to the offspring and to persist when the latter leaves the parental home. To see whether this is the case, four measures of 1973 offspring politicization were constructed. The first constitutes an encompassing measure of media consumption that consists of the following four indicators: reading magazines about politics, watching political programmes on TV, reading the newspaper and listening to political shows on the radio. The resulting scale ranges from 0 to 13, with a mean value of 8.7. The second is a 1 (not interested) to 4 (very interested) measure of interest in public affairs. The third is a dummy denoting respondents who talk very often with their spouses about politics. The fourth is a political knowledge index, ranging from 1 (no correct answer) to 8 (six correct answers). To gain a point of reference about the strength of the association between parental politicization in 1965 and youth political interest in 1973, I compare the former with parental education, using two dummies about whether each of the parents has attended college. The parental politcization variable [ParPol] is also recoded so that it ranges from 0 to 1.
With respect to media consumption, the ordinary least square (OLS) coefficient attached to ParPol is 1.81 (0.487). The equivalent figures for the two parental education dummies are 0.438 (0.262) for the father and −0.252 (0.284) for the mother. Using the measure of interest in political affairs, the equivalent figures are 0.373 (0.108) for ParPol and 0.118 (0.077) and −0.056 (0.826) for father's and mother's education, respectively. Focusing on the frequency of political discussions with the spouse, we get the following OLS coefficients: ParPol 0.200 (0.073); father education: 0.015 (0.048); mother education: 0.020 (0.049). Finally, the political knowledge OLS regression provides a similar pattern: ParPol 1.35 (0.235); father education: 0.662 (0.131); mother education: 0.235 (0.152).
It is thus safe to conclude that parents leave their imprint on their offspring's levels of political attentiveness. The transmission of political interest does not evaporate as young individuals leave their parental homes. Rather, engaging in political discussions at home and participating in politics seems to contribute to young adults’ interest in political affairs.
Controls
Before moving to the estimation of Equation 1, it is necessary to describe the set of controls included in the equation. Two possible confounds need to be controlled for, namely the strength of partisan attachment and the degree of partisan homogeneity within the family. Both of these characteristics may boost political interest within the family and may also account for the longevity of parental partisan signals.Footnote 56 Although strength of partisanship can be regarded as post-treatment, its inclusion in the model is also an important way to account for differential ceiling effects. Offspring with parental PID = 3 can score above or equal to −3 and below or equal to 3 in the dependent variable. The possible range of values for offspring with strong Republican or strong Democrat parents is −6 to 6. If highly politicized parents are also more likely to be strong partisans, this gap may produce an upward bias in our estimates. Further controls include race, gender and two dummies denoting whether the father or mother of single-interviewed families was interviewed and whether both or one of the parents were interviewed.
Results: HYPOTHESIS 1
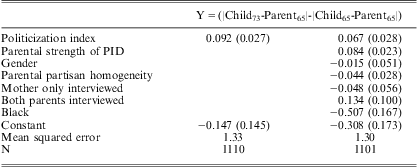
The results appear in Table 1. The first column shows the model without controls, whereas the second column includes all controls described above. ParPol exerts a positive effect in both cases, with a bivariate coefficient of 0.092 and a multivariate coefficient of 0.067. The reduction in the magnitude of the coefficient is primarily due to the inclusion of the variable measuring parental strength of partisanship. Excluding this variable, the coefficient of ParPol becomes 0.085. Recall that the dependent variable varies from −6 to 6 (SD = 1.33), while ParPol varies from 0 to 8 (SD = 1.78). The 0.067 net increase in the partisan gap between parents and offspring for a unit increase in the scale of ParPol amounts to a shift of 0.538 when comparing those from most and least politicized families, which is 40 per cent of a standard deviation change in the dependent variable.Footnote 57
The Impact of Parental Politicization on Change in Partisan Similarity between Parents and Offspring

Note: entries are OLS coefficients, standard errors, clustered at the school level, in brackets. When factorizing parental strength of PID and parental partisan homogeneity, ParPol becomes 0.060 (0.027).
Following the arguments elaborated above, this pattern is attributed to the fact that political influences during early adulthood are given more weight among those coming from more politicized homes. Online Appendix C addresses two competing explanations for the role attributed here to parental politicization. It shows that neither parental partisan stability, as a marker of the consistency of the parental cue, nor socio-demographic concordance wipes out the effect of parental politicization. The next sections try to gauge the mechanism driving this effect, focusing on the role of new social contexts, emerging events and salient political issues.
Identifying the Mechanism I: New Social Contexts (HYPOTHESIS 2A)
Leaving home at the start of adulthood, young adults either go to college or find a job. Here I focus on the first option, because this is the only one that can generate expectations about the partisan direction of a new context in which many of the high school seniors found themselves after 1965. Different work environments generate diverse partisan cues, thus without specific information about each individual's working environment we cannot formulate expectations about their effects on PID. Universities, however, are traditionally liberal institutions in the United States.
This was probably never more the case than in the 1960s, especially in its second half, when colleges were prominent sites of mobilization for liberal causes.Footnote 58 Although in that period the link between ideology and parties was not as strong as it appears to be in the beginning of the twenty-first century,Footnote 59 a liberal context should work more in favour of the Democrats than the Republicans.
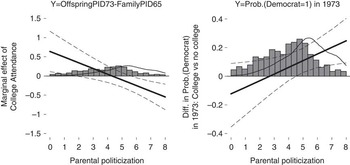
If children from more politicized families are more likely to question their parental cues due to being more attentive to competing partisan cues encountered within the university, parental politicization should boost the impact of higher education on PID. That is to say, those from politicized homes should move more decidedly in the pro-Democratic direction as a result of acquiring a college degree than those from apolitical homes. The dependent variable used to test this hypothesis is the difference between offspring PID in 1973 and parental PID in 1965. PID is always measured on a 0 to 6 scale, from strong Democrat to strong Republican. This variable is regressed on ParPol, college attendance (0 = no college; 1 = some college; 2 = completed college studies), their interaction and the set of controls. The marginal effect of college attendance, conditional on ParPol, is depicted in the first graph of Figure 1. College seems to cause a shift to more Democratic scores but in a non-homogenous way. Providing support for Hypothesis 2A, this effect appears to be only significant for offspring from highly politicized families.
Deviating from parental partisanship as a result of college attendance. Note: the solid line of the first graph depicts the average effect of college attendance on OffspringPID73-FamilyPID65 across all levels of parental politicization. PID ranges from 0 = strong Democrat to 6 = strong Republican. Thus the dependent variable ranges from −6 {Parent strong Republican in 1965, child strong Democrat in 1973} to 6 {Parent strong Democrat in 1965, child strong Republican in 1973}. The solid curve of the second curve presents the difference in the probability of denoting a Democrat ID while stemming from a Republican background (both offspring and parents declaring themselves Republicans in 1965), as a result of completing college education versus not going to college. The marginal effects shown in the first graph are based on an OLS model, whereas the predicted values of the second graph come from a probit analysis. In both graphs, the dotted curves display the associated 95 per cent confidence intervals. The histograms show the density of parental politicization among respondents not attending college and the kernel density (solid black, Epanechnikov kernel) curve denotes the same density for those who completed college education. Despite some imbalance, there is support in the data for higher politicization values, reducing the danger of extreme out-of-sample extrapolations.

The second graph of Figure 1 addresses a more specific scenario: what is the change in the probability of a young Republican in 1965 (from a Republican family) switching to the Democrats as a result of finishing college versus not going to university, according to her level of parental politicization? Negative values in the vertical axis indicate that graduating from university decreases the chances of denoting Democrat partisanship. Positive values denote an increase in this probability. As Figure 1 makes clear, only young Republicans coming from politicized families switched to the Democrats as a result of their experience in university during the 1965–1973 period.
A potential point of caution could be that this finding may conceal some heterogeneity between most prestigious universities (where a liberal culture did prevail) and community colleges or parochial universities (where it probably did not). If offspring from more politicized families are more likely to go to large universities, the effect attributed to parental politicization might stem from this increased probability of receiving liberal signals in college. To evaluate this competing explanation, I further distinguish whether individuals attended a public or non-denominational private university versus a community or denominational college. ParPol matters more in determining the effect of college attendance for the former, as expected. Replicating the analysis of the second graph of Figure 1 separately for the two types of colleges, the interaction term between college attendance and ParPol is 0.082 (0.032) and 0.036 (0.062) for the first and second groups, respectively.
Identifying the Mechanism II: Political Events (HYPOTHESIS 2B)
Are people from politicized families more influenced by events taking place during their early adulthood? In the political context of the period covered in our data, one salient event that endured throughout the period between the two waves of the study was US involvement in the Vietnam War. The military intervention of the United States had already started by early 1965 but peaked in 1968 and went on until 1975. Between 1965 and 1973 it remained high on the public agenda and engendered polarizing sentiments, especially among the young.Footnote 60 Although it caused a severe decline in support for both parties, it mainly affected the Republicans since they were in office from 1969–1973, when public opinion turned against the war.Footnote 61 This means that by 1973, young adults who approved of the US policy in Vietnam should have become more attached to the Republican Party, whereas those against the war should have developed a more pro-Democrat identification.
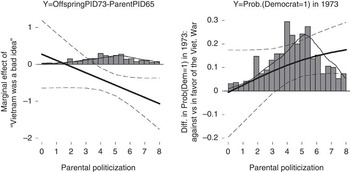
But the core question is whether any deviation from parental PID as the result of the Vietnam War is systematically related to the level of parental politicization. To address this question, I replicated the analysis of the previous section; the only difference was that a binary variable about whether US involvement in Vietnam was a good (0) or bad (1) idea was interacted with parental politicization. Again the first graph uses the difference between OffspringPID 73 and ParentPID 65 as the dependent variable and the second graph depicts a more specific scenario: for those who came from Republican homes, how does the probability of identifying as a Democrat in 1973 vary by level of family politicization and attitude toward the Vietnam War? As shown in Figure 2, children from politicized homes were more likely to abandon their parental partisanship as a result of their attitudes toward the Vietnam War. Objecting to the war boosts the probability of switching to the Democrats by 20 per cent among offspring from highly politicized Republican families, but exerts no significant effect among offspring from less politicized families.
Deviating from parental partisanship as a result of the Vietnam War. Note: the structure is identical to Figure 1, the only difference being that now ParPol is interacted with attitudes towards the war. The solid line of the first graph depicts the average effect of attitudes towards the war on {OffspringPID73-FamilyPID65} across all levels of parental politicization. The solid curve of the second graph presents the difference in the probability of denoting a Democrat ID while stemming from a Republican background (both offspring and parents declaring themselves Republicans in 1965), as a result of disapproving of the US intervention in Vietnam. The marginal effects shown in the first graph are based on an OLS model, whereas the predicted values of the second graph come from a probit analysis. In both graphs, the dotted curves display the associated 95 per cent confidence intervals. The histograms show the density of parental politicization among respondents favouring the war and the kernel density curve denotes the same density for those disapproving the war. Here, there is clearly support in the data for both groups.

Identifying the Mechanism III: Salient Issues (HYPOTHESIS 3)
The last hypothesis examines the extent to which the shift away from parental partisanship is also coupled by a change in issue attitudes. Although examining whether changes in issue opinions drive partisan change or vice versa is impossible with the data at hand, it is still important to see whether, apart from changing their PID, offspring from more politicized families were also more likely to change their issue opinions in a way that is consistent with the political mood of their generation.
School integration and the role of religion in public high schools were two issues that engendered public discussion during the 1960s and 1970s in the United States. Accompanied by an egalitarian media framing, the ‘tide of opinion’ in elite communications or elsewhere was moving in a liberal direction on these issues over this period.Footnote 62 In a systematic study of the dynamics of issue attitudes in the United States, Mayer shows that American public opinion was shifting likewise. He divides the years between 1960 and 1988 into four periods. The second period starts in 1966 and ends in 1973, coinciding almost perfectly with the first two waves of the Socialisation study. He classifies various issues into three categories, with regard to whether public opinion became more liberal, exhibited little or no change, or became more conservative. Both school prayers and racial integration in schools are included in the first category.Footnote 63
According to Hypothesis 3, we should expect that young people from highly politicized homes were getting that message and moving along the same lines. Questions on school prayer and school integration were asked of both generations of Socialisation Study respondents in 1965 and 1973. The first asked whether public schools should start every day with a prayer. The second asked respondents if they think the government should take measures to racially integrate the schools. Respondents could only state whether they agreed or disagreed with these statements, without giving an indication of how strongly they felt about each issue. Each variable is coded −1 if respondents believed government should not induce school integration/schools should start with a prayer and 1 otherwise (with 0 denoting neutral stances). The 1973 offspring measures are regressed on the 1965 parental measures plus parental politicization and the list of controls that are also included in all models above.Footnote 64
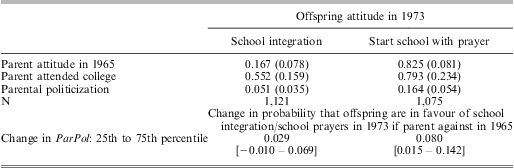
The entries in Table 2 are log odds from a generalized ordinal logit, which tests the proportional odds assumption.Footnote 65 Only one coefficient is shown for parental politicization, because this assumption appears to hold in both occasions for this variable. As can be seen, the effect of ParPol is positive in both issues, although it is much lower in the first column. The last part of the table presents the change in the probability that the offspring will adopt a liberal stance in either issue when shifting ParPol from the 25th to the 75th percentile. In both cases, the 1965 parental values are set to −1. Parental politicization increases the chances of shifting from parental views towards more liberal attitudes by three and eight percentage points in the issues of school integration and prayers, respectively.
Change in Issue Attitudes towards More Liberal Stances from 1965 to 1973

Note: entries in the first part of the table are log odds from generalized ordinal choice models. The 1965 parental and the 1973 offspring scales take the following values: −1 (do not integrate schools/start with prayer); 0 (depends, no opinion); 1 (integrate schools/do not start with prayer). Robust standard errors, clustered at the school level, are in brackets. The last row denotes the change in the probability of adopting a liberal position on each issue in 1973 if parents adopted a conservative stance in both issues between low and high levels of ParPol.
An Observable Implication: Parental Politicization and the Southern Realignment
The previous results seem to suggest that members of the class of 1965 who grew up in politicized homes were especially likely to shift to the left during their early adult years. Is the direction of this shift driven by the context-specific partisan influences of this period, or does it signal a more general tendency, whereby parent-child divergence only occurs when the political context prompts youth to develop more liberal stances? The former is consistent with the argument of this article, while the latter would undermine it.
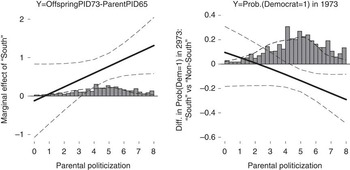
To examine this question, we need to find a political process characterized by salient anti-Democrat cues. A good case for this purpose is the Southern Democratic dealignment. While the Vietnam War was leaving its stigma in American politics writ large, a parallel and equally important development was taking place in a specific area of the country: since the mid-1960s and until at least the end of the 1970s, the until-then solid Democratic South gradually but steadily moved away from the party. There has been solid evidence that young cohorts of that period constituted the frontline of this shift.Footnote 66 Even if the realigning process had already initiated before 1965, our young cohort was in the heart of this change. If parental political involvement is important because it introduces the youth to new political stimuli – rather than simply pushing the offspring to more liberal attitudes – we should observe that the offspring of more politicized Southern families are more likely to abandon the Democrats than those coming from less politicized homes.
Empirical evidence addressing this question is provided in Figure 3. The first graph again uses the difference between OffspringPID 73 and ParentPID 65 as the dependent variable and shows the gap between Southerners and non-Southerners across all levels of ParPol. The second shows the probability of identifying as a Democrat in 1973 among Southerners and non-Southerners. In generating the predicted values used in the graph, the following scenario was assumed: all high school seniors came from Democratic homes and declared themselves as Democrats in 1965. This exact scenario is at the heart of the Southern realignment. As the figure shows, young Southerners growing up in politically engaged homes primarily drove the shift away from the Democrats.
Abandoning the Democrats in the South. Note: the structure is again similar to Figures 1 and 2. The solid line of the first graph depicts the average difference in {OffspringPID73-FamilyPID65} among Southerners and non-Southerners, across all levels of parental politicization. The solid curve of the second graph presents the difference in the probability of denoting a Democrat ID while stemming from a Democratic background (both offspring and parents declaring themselves as Democrats in 1965), among Southerners and non-Southerners. The marginal effects shown in the first graph are based on an OLS model, whereas the predicted values of the second graph come from a probit analysis. The histogram and the density curve suggest that the distributions of ParPol in the two areas are quite similar.

In the Long Run: Tracing the Footprints of Parental Influence over the Offsprings’ Life Trajectory
Do the differences attributed to the level of parental politicization persist after 1973 or do they evaporate as the class of 1965 becomes older and as the political environment of the late 1960s and early 1970s is replaced by that of the 1980s and 1990s? To explore these long-term patterns I use all four waves of the youth socialization panel. The third wave came in 1982 and the fourth wave took place in 1997.Footnote 67 I employ a growth curve model to estimate the long-term impact of parental politicization. Growth curve models are based on an interaction between the predictor of interest [ParPol] and a function of time. By coding time accordingly, the main effect of ParPol represents its effect on the starting level (1965), whereas the interaction term indicates its effect on the growth rate of this relationship. To avoid functional form assumptions regarding how parental-child similarity evolves over the offsprings’ lifespan, time is modelled using a set of dummies denoting the year of the panel waves. Thus instead of one parameter indicating the growth rate of parental-child convergence, three such parameters are estimated, each one corresponding to a given wave of the panel study.
Following the logic of Hypothesis 1, the dependent variable measures the absolute partisan distance between the parent in 1965 and the offspring in each of the four waves. The model used in the analysis is:
 $$ & PID\left| {Offsprin{{g}_{{\rm{73}}}}{\rm{ - }}Paren{{t}_{{\rm{65}}}}} \right|{\rm{ = }}{{a}_{{\rm{0}}is}}\, + \,{{a}_{1is}}(t\, = \,1)\, + {{a}_{2is}}(t\, = \,2)\, + {{a}_{3is}}(t\, = \,3)\, + \,{{e}_{tis}}\,\,\, $$
where i = 1,…,N indexes individuals, t = 0,…,T–1 indexes the number of observations for each individual and αki is the growth curve parameter for i with k = {0,1,2}.
Growth curve models are based on the idea that the baseline and growth curve parameters vary across individuals. By obtaining estimates for αki for each i, we have N different values for these parameters, which we can then treat as random variables. This leads to an intercept- and slopes-as-outcomes model, represented by the level-2 equations, given below:
 $${{a}_{0is}}\, = \,{{\gamma }_{00s}}\, + \,{{\gamma }_{01s}}X\, + \,{{u}_{0is}}$$
 $$ {{a}_{1is}}\, = \,{{\gamma }_{10s}}\, + \,{{\gamma }_{11s}}X\, + \,{{u}_{1is}} $$
 $$ {{a}_{2is}}\, = \,{{\gamma }_{20s}}\, + \,{{\gamma }_{21s}}X\, + \,{{u}_{2is}} $$
 $$ {{a}_{3is}} = {{\gamma }_{30s}} + {{\gamma }_{31s}}X + {{u}_{3is}} $$
Since both the main variable of interest [ParPol] and all controls are measured in 1965, all variables included in the model (X) are deemed to influence both the starting level (α0) and the growth rate (α1, α2, α3). The estimation substitutes (3), (4), (5) and (6) into (1), giving room to a three-level mixed-effects model.Footnote 68 Level-3 units represent the school clusters. Level-2 units represent the respondents available in any of the four waves and level-1 units consist of the repeated observations (individuals stacked within the four waves of the study). In other words, repeated measures of observations are nested within individuals, who are nested within high schools.
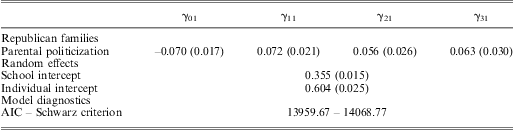
In this model, α0is denotes the level of parent-child partisan similarity when individuals are eighteen years old. Accordingly, γ01s estimates the impact of parental politicization on the starting level of parent-child convergence, that is, before individuals leave their parental home. α1i measures the growth rate of this relationship by the time youngsters are twenty-six years old. γ11s estimates the impact of parental politicization on the change in the probability of parent-child partisan congruence from 1965 to 1973 and γ21s and γ31s estimate the same effect but compare 1965 to 1982 and 1997, respectively.
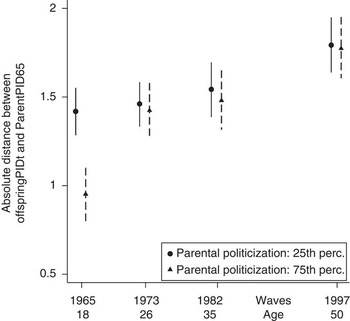
Table 3 presents the results and Figure 4 visualizes them. The small circles in Figure 4 display the average absolute distance in partisanship between children and parents for the less politicized group, that is, those located at the 25th percentile of the empirical distribution of the variable. The triangles represent the more politically engaged families: those located at the 75th percentile of the empirical distribution of the variable. The vertical spikes denote the 95 per cent confidence intervals accompanying each point estimate.
The Impact of Parental Politicization on the Starting Point and the Growth Curve of Parent-Child Partisan Concordance, 1965–1997

Note: entries in the first row are log odds from a mixed-effects logit model, standard errors in brackets. Controls, and their interactions with time, are not shown. Level-3 N: 97; Level-2 N: 1,335; Level-1 N: 4,526.
Parent-child partisan divergence in the long run. Note: the black circles denote the average distance (in a 0 to 6 scale) between parents and offspring among respondents coming from families with lower scores of political engagement. The triangles represent the equivalent estimates for offspring coming from politicized homes. The solid and dashed spikes indicate the 95 per cent confidence intervals. The predictions are based on the growth curve estimates shown in Table 3.

Offspring from more politicized families are more likely to change their views during early adulthood; doing so makes their increased level of initial similarity with their parents disappear. Parental politicization boosts the starting point but decreases the growth rate of parent-child partisan similarity. On the whole, the results of the growth curve analysis confirm the findings from the period between 1965 and 1973. What is new from this analysis, and crucial for the appreciation of the importance of the ‘impressionable years’ in shaping people's partisan profiles, is that deviations occurring during early adulthood largely persist over the individual's lifespan. I discuss the implications of this finding in the concluding section after I examine the generalizability of Hypothesis 1 in different political generations and political contexts.
A Generalizable Dynamic?
The youth sample from the Jennings-Niemi Socialisation Study entered into early adulthood during a very turbulent period in American politics. Between the mid-1960s and the early 1970s, American youth experienced various dramatic events that provided a common bond that helped this cohort develop into an actual generation.Footnote 69 Consequently, the results might be cohort specific.
To assess the generalizability of the findings, I provide two tests from different cohorts. The first test uses data on a younger generation obtained in the last wave of the Political Socialisation Study. In 1997 the children of the initial youth sample – then aged fifty – were also interviewed (N = 769). Members of this third generation were raised in a rather placid political period that did not resemble the exceptional circumstances of the 1960s.
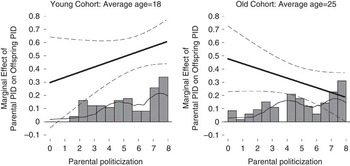
These offspring differ from their parents in that they do not constitute a school-year cohort, that is, they vary in terms of age. Although this might seem an inconvenience, it can be helpful for the present purposes.Footnote 70 I divide the third-generation sample into two categories. The first includes offspring between twenty-three and twenty-nine years old, with a mean age of twenty-five (N = 370). This is approximately the age of the 1965 cohort in 1973. The second group comprises those between sixteen and twenty-one years old (N = 203), with a mean age of eighteen –the same age as the original youth sample in 1965. Although the third generation was only interviewed in 1997, and thus a truly dynamic empirical model is impossible, we can compare the younger and older third-generation cohorts. The relationship between parental PID and child PID for those with an average age of eighteen would correspond to the 1965 parent-child similarity of the previous analysis. Here we would expect a positive relationship between parent politicization and parent-child similarity, reflecting the consequence of the former on parent-child transmission during the pre-adult years. The relationship between parental PID and child PID for those with an average age of twenty-five would correspond to the level of parent-child similarity in 1973. Here we would expect a reversal in the relationship, with those coming from highly politicized homes holding views that are less similar to their parents than those from apolitical homes – a pattern driven by the former group's greater political learning and engagement during their ‘impressionable years’.
To examine this, I regress child PID (on the 0 to 6 scale) on parental PID, parental politicization (measured in the same way as in 1965 and again ranging between 0 and 8) and the interaction of the last two terms. The analysis is implemented separately for each of the two age cohorts. The marginal effect of parental PID conditional on parental politicization is presented in Figure 5. For the younger group, the level of parent-child partisan similarity is enhanced when parents are engaged in politics. For the older group, the pattern reverses, as expected. Partisan similarity drops as a result of parental politicization. The coefficient of similarity between parental and offspring PID doubles (from 0.3 to 0.6) among politicized families for the young group and drops to almost half for the old group (from 0.5 to almost 0.25). The small number of observations creates high levels of uncertainty accompanying these estimates. However, we see that even when a different cohort with completely distinct political experiences is analysed, the pattern identified earlier is repeated.
The marginal effect of parental PID on child PID for two age cohorts of the 3rd generation (wave of 1997) across all levels of parental politicization. Note: the solid line presents the marginal effect of ParentPID97 on OffspringPID97, both of which are measured with the same 0 (Strong Democrat) to 6 (Strong Republican) scale. The histogram in both graphs shows the distribution of parental politicization for ParentalPID ≥ 3 and the black solid curve displays the density curve for ParentalPID < 3.

The second test relates to British youth during the 1990s and uses information from the British Household Panel Study (BHPS), one of the very few datasets that allows us to assess the level of parent-child partisan similarity in a longitudinal perspective while providing independent measures of parental characteristics as well.
The BHPS began in 1991 with a sample of some 5,500 households and 10,300 individuals drawn from 250 areas of Great Britain. All household members aged sixteen or more were re-interviewed in successive yearly waves and, if they split off from original households, all adult members of their new households were also interviewed. To gauge the trajectory of parent-offspring partisan similarity, I focus on respondents aged between sixteen and twenty years old in 1991 who still lived with one or both of their parents (N = 710). The analysis traces these individuals from 1991 (median age: eighteen) to 2008 (median age: thirty-five).
Only a few questions in the BHPS are devoted to political issues and attitudes. Parental politicization is captured only through parents’ self-evaluation of their level of interest in politics (ranging from ‘not at all interested’ [1] to ‘very interested’ [4]). Given that the British party system has more than two parties, a unifying PID measure equivalent to the American PID scale used in the previous sections is not appropriate.Footnote 71 The dependent variable is constructed by first creating a measure of concordance in party support between parents and children in 1991. If parents and children show support for the same party they score 1 (0 otherwise). Following the logic in Hypothesis 1, the resulting measure of party concordance in 1991 is used as a baseline to denote the impact of parental socialization during adolescence. For 1992 this measure is then subtracted from the degree of concordance between children in 1992 and parents in 1991. The same logic is followed until the 2008 wave of the study. The analysis includes respondents between sixteen and twenty years old in 1991, thus on average of equal age as the class of 1965 in that year. The generic form of the model used to capture the trajectory of parent-child convergence according to the level of parental politicization is:
 $$ \displaylines{ & \left\{ {Chil{{d}_t}{\rm{ - }}Paren{{t}_{{\rm{91}}}}} \right\}{\rm{ - }}\left\{ {Chil{{d}_{91}}{\rm{ - }}Paren{{t}_{{\rm{91}}}}} \right\}\, = \,{{a}_t}\, + \,{{b}_t}ParentalPoliticisation\, + \,e_{{i}{ft}} \cr} $$
where t = 1992, 1993,…,2008. The subscript f denotes error clustering at the family level.Footnote 72 The dependent variable takes values between −1 and 1. A score of -1 means that parents and children agreed in their party preference in 1991 but disagreed in t. A score of 1 implies that although there was no agreement in 1991, parents and offspring agree in t. A score of 0 implies that members of the two generations either agreed at both time points or disagreed at both time points. The validation of Hypothesis 1 in the British context requires that bt become negative as the offspring enters into early adulthood (as t becomes larger). Moreover, if the long-term pattern found above also holds in Britain, bt should remain stable once the offspring reach the age of mid- or late twenties.
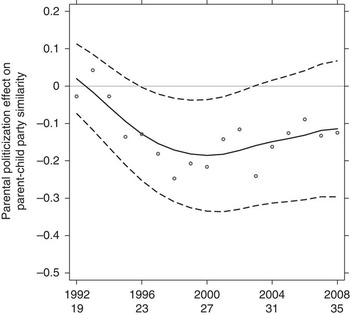
Figure 6 summarizes the results. The scatterplot represents the coefficients of parental politicization across all yearly waves from 1992 to 2008. The solid line denotes a local regression curve (loess) fitted into the scatterplot. The two dashed curves display the point-wise 95 per cent confidence intervals of the loess estimates. The overall pattern seems to confirm prior expectations. The downward trend indicates that offspring from more politicized homes are more likely to deviate from their parents’ partisan influences. This trend stabilizes after 2000, when the average offspring age is twenty-eight. This is exactly what we should expect if the findings of the previous sections denoted a more general tendency that is not confined only to the ‘Vietnam generation’ in the United States.
The effect of parental political interest on the longevity of parent-child partisan similarity. Note: the solid curve summarizes the yearly coefficients denoting the effect of parental political interest on parent-child partisan similarity. The dashed curves denote the point-wise 95 per cent confidence bands of these point estimates. BHPS data, 1991–2008.

Discussion
It has often been treated as common wisdom in the political socialization literature that parental partisan preferences are more likely to stick with the offspring when parents are involved in political affairs. By looking at the long-term dynamics of partisan similarity between parents and children, this study has challenged this claim, suggesting a different mechanism through which parental politicization affects the longevity of parents’ partisan influence. Rather than boosting intergenerational partisan similarity, parental politicization increases the frequency and potential influence of change-inducing stimuli that individuals encounter in early adulthood. Therefore, although children who grow up in politicized homes are more likely than those from less politicized or apolitical homes to adopt their parents’ party identification as adolescents, they are also more likely to revise their partisan affiliations when they experience politics as adults.
The reason politicized parents are more likely to end up with adult children who have divergent partisan preferences is that, by facilitating political discussions at home, they make the offspring more attentive to the political messages of their times. New social contexts, new political events and issues may challenge parents’ partisan ‘legacy’. Young people coming from more politicized backgrounds are more likely to update their partisan views as a result of these stimuli.
The findings mesh nicely with the conclusions of recent studies about the role of parental partisan influence. In their analysis of German longitudinal data, Kroh and Selb found that partisanship is more stable among less politically interested respondents.Footnote 73 In their empirical formulation, instability means naming a different party than the party initially referred to in late adolescence. Accounting for their findings, Kroh and Selb attributed this pattern to the possibility that partisanship can be a more useful heuristic device among less politicized voters, whereas it is not needed to the same degree among politically knowledgeable citizens. An alternative explanation, reflecting the ideas laid out here, could be that party support at the age of eighteen simply reflects parental influence – which is more likely to hold in the long run among the offspring of less politicized homes than those coming from more politically involved families. Because the former end up less politically engaged as adults, their partisanship is not as subject to the social and political forces that prompt partisanship changes among the latter.
The findings may also have important implications for our understanding of the sources of heterogeneity in the character of party identification. Examining the role of parental socialization on the type of partisan identities formed by young individuals, Kroh and Selb find that for those who inherit the partisanship of their parents, PID is predominantly based on an affective attachment to political parties.Footnote 74 In contrast, in cases in which partisan parental upbringing is absent, PID acquired later in one's trajectory resembles the revisionist view of PID, based on the cognitive evaluations of parties’ records. The findings presented here call for the investigation of another potentially important factor in distinguishing between Bayesian updaters and Michigan-like partisans: parental political interest. The offspring of politicized families are more likely to form their partisan preferences influenced by the political stimuli of early adulthood than the offspring of less politicized families. The former are thus better suited to link their partisan identities with their own ideological attitudes and issue predispositions than the latter. Accordingly, increased parental politicization may give room to a ‘running tally’ logic of partisan learning.Footnote 75 Low levels of parental politicization, however, may foster more affect-laden partisan orientations. Extending our focus on the role of parental socialization from the provider of a party label to the cultivation of political interest may contribute to a long-standing debate in the study of party identification.
Finally, the overall results touch on an ongoing puzzle for students of political behaviour: how political change takes place over time. If partisan transmission through the family were perfect, intergenerational change would be negligible. The observed aggregate-level discontinuities refute this picture of political steadiness. However, how this change in political attitudes and predispositions takes place remains a largely pending question. The existing literature agrees on the following two points. First, the driving engine of change is political events and new political issues, which generate new political circumstances, causing some individuals to update their prior views. Secondly, the formative years of early adulthood constitute a period in which political opinions are more labile and can thus be more easily affected by these developments. Where there is no consensus, however, is whether it is young adults with a lack of political interest or the more politicized youth who drive this intergenerational shift. According to the findings of this study, the second group is particularly important in this process. Jennings and Stoker showed that period forces give room to the formation of generational units only when they are infiltrated by one's own active involvement.Footnote 76 By the same token, new political climates are only a necessary condition for political change. The sufficient condition is political engagement. Thus if knowledge of parental partisanship is important in explaining continuity, knowledge of parental politicization may be more vital for our understanding of partisan and attitudinal change.