Introduction
Chagas disease is a neglected anthropozoonosis caused by the protozoan parasite Trypanosoma cruzi (Pérez-Molina and Molina, Reference Pérez-Molina and Molina2018). It is estimated that at least 8 million people are currently infected by T. cruzi worldwide, and symptomatic clinical forms of Chagas disease are responsible for around 10 000 deaths every year (WHO, 2019). This disease is endemic in South and Central America, where oral and vector (triatomine insects) transmission routes are the main routes of contamination (Nogueira et al., Reference Nogueira, Felizardo, Caldas, Gonçalves and Novaes2018; Pérez-Molina and Molina, Reference Pérez-Molina and Molina2018). However, there are increasing cases of infection in non-endemic areas, mainly due to the migration of infected individuals, congenital transmission (mother to fetus), and iatrogenic events related to laboratory accidents, blood transfusion and transplantation of infected organs (Bern, Reference Bern2015; WHO, 2019). Recent estimates suggest at least 350 000 cases of infection in North America (Echeverria and Morillo, Reference Echeverria and Morillo2019) and 181 181 cases in European countries (Antinori et al., Reference Antinori, Galimberti, Bianco, Grande, Galli and Corbellino2017).
Chagas cardiomyopathy is the most severe and disabling manifestation of T. cruzi infection (Bern, Reference Bern2015). It is associated with extensive inflammatory processes, oxidative damage, cardiomyocytolysis, necrosis, progressive heart fibrosis, electromechanical insufficiency, heart failure and death (Bern, Reference Bern2015; Pérez-Molina and Molina, Reference Pérez-Molina and Molina2018). Chagas disease is the leading cause of nonischemic cardiomyopathy and the third highest indication for heart transplantation in Latin America (Mendonça et al., Reference Mendonça, Coelho, Veloso, Caldas, Gonçalves, Teixeira, de Miranda and Novaes2018; Nogueira et al., Reference Nogueira, Felizardo, Caldas, Gonçalves and Novaes2018). Chronic Chagas cardiomyopathy (CCC) is associated with a worse prognosis and 2.48-times greater risk of death than noninfectious cardiomyopathies (Freitas et al., Reference Freitas, Chizzola, ÂT, Lima and Mansur2005; Nogueira et al., Reference Nogueira, Felizardo, Caldas, Gonçalves and Novaes2018).
After more than four decades, benznidazole (Bz) is still the first-line drug for the etiological treatment of T. cruzi infection (Urbina, Reference Urbina2010; Nogueira et al., Reference Nogueira, Felizardo, Caldas, Gonçalves and Novaes2018). However, this drug has high toxicity and low cure rates (10–20%) after the parasites have spread and established quiescent amastigote reservoirs in multiple tissues (Urbina, Reference Urbina2010; Mendonça et al., Reference Mendonça, Coelho, Veloso, Caldas, Gonçalves, Teixeira, de Miranda and Novaes2018). As the prospect of new drugs for the treatment of T. cruzi infection is not promising, supporting drugs (e.g. antiarrhythmic, anti-inflammatory and antioxidant drugs) (Santos et al., Reference Santos, Novaes, Cupertino, Bastos, Klein, Silva, Fietto, Talvani, Bahia and Oliveira2015; Novaes et al., Reference Novaes, Sartini, Rodrigues, Gonçalves, Santos, Souza and Caldas2016a; Mendonça et al., Reference Mendonça, Coelho, Veloso, Caldas, Gonçalves, Teixeira, de Miranda and Novaes2018) and non-pharmacological strategies (e.g. exercise training) (Novaes et al., Reference Novaes, Goncalves, Penitente, Bozi, Neves, Maldonado, Natali and Talvani2016b, Reference Novaes, Gonçalves, Penitente, Cupertino, Maldonado, Talvani and Natali2017; Lucchetti et al., Reference Lucchetti, Zanluqui, de Ataides Raquel, Lovo-Martins, Tatakihara, de Oliveira Belém, Michelini, de Almeida Araújo, Pinge-Filho and Martins-Pinge2017) have been proposed to increase host resistance against T. cruzi. Unlike cardiomyopathies with noninfectious etiologies, exercise training was contraindicated for decades for patients with Chagas disease, primarily because exercise could be limited by autonomic dysfunction, together with the belief that cardiovascular overload could potentiate cardiac deterioration (Gallo et al., Reference Gallo, Neto, Manço, Rassi and Amorim1975; Bocchi, Reference Bocchi2010). However, recent studies have shown that physical training can increase host resistance against T. cruzi infection (Schebeleski-Soares et al., Reference Schebeleski-Soares, Occhi-Soares, Franzói-de-Moraes, De Oliveira Dalálio, Almeida, De Ornelas Toledo and De Araújo2009; Novaes et al., Reference Novaes, Goncalves, Penitente, Bozi, Neves, Maldonado, Natali and Talvani2016b), a protective effect mainly attributed to the immunomodulatory and antioxidant mechanisms activated by exercise (Novaes et al., Reference Novaes, Goncalves, Penitente, Bozi, Neves, Maldonado, Natali and Talvani2016b; Lucchetti et al., Reference Lucchetti, Zanluqui, de Ataides Raquel, Lovo-Martins, Tatakihara, de Oliveira Belém, Michelini, de Almeida Araújo, Pinge-Filho and Martins-Pinge2017). Accordingly, exercise was found to be effective in attenuating parasitemia, heart parasitism and microstructural damage in T. cruzi-infected rats, effects which are potentially linked to an improved Th1 immunological response and upregulation of antioxidant enzymatic defenses in trained animals (Novaes et al., Reference Novaes, Goncalves, Penitente, Bozi, Neves, Maldonado, Natali and Talvani2016b). In addition, clinical trials demonstrated that a 12-week training program was effective in reducing brain-derived neurotrophic factor levels, thereby improving autonomic modulation, oxygen consumption, exercise tolerance and quality of life in patients with CCC, with no significant adverse effects observed at 12 weeks follow-up (Lima et al., Reference Lima, Rocha, Nunes, Sousa, Costa, Alencar, Britto and Ribeiro2010, Reference Lima, Nunes, Nascimento, Costa, Sousa, Teixeira, Rocha and Ribeiro2013).
Although exercise training has emerged as a promising non-pharmacological strategy for the treatment of Chagas disease (Bocchi, Reference Bocchi2010; Lima et al., Reference Lima, Rocha, Nunes, Sousa, Costa, Alencar, Britto and Ribeiro2010; Novaes et al., Reference Novaes, Goncalves, Penitente, Bozi, Neves, Maldonado, Natali and Talvani2016b), it does not seem feasible to propose the replacement of specific chemotherapy by physical exercise programs, especially considering that there is no evidence of parasitological cure after physical training in animals or humans. On the other hand, by increasing host resistance to infection, exercise training may act as a complementary strategy to antitrypanosomal chemotherapy. Additive or synergic beneficial effects of exercise training and drug therapy have been identified in cardiovascular diseases (Lowenthal and Kendrick, Reference Lowenthal and Kendrick1985; Yoshizawa et al., Reference Yoshizawa, Maeda, Miyaki, Misono, Choi, Shimojo, Ajisaka and Tanaka2009; Ranjbar et al., Reference Ranjbar, Nazem, Nazari, Gholami, Nezami, Ardakanizade, Sohrabi, Ahmadvand, Mottaghi and Azizi2015); however, this combination remains unexplored in Chagas disease. Thus, we compared the isolated and combined effects of exercise training and Bz-based therapy on parasitism, inflammation and oxidative tissue damage in a murine model of T. cruzi infection.
Materials and methods
Experimental groups
Sixteen-week-old male Wistar rats were randomized into five groups containing 10 animals each: CT group, sedentary, uninfected and untreated controls; SI group, sedentary and infected; SIT group, sedentary, infected and treated with 100 mg kg−1 day−1 Bz; TI group, trained and infected; and TIT, trained, infected and treated with 100 mg kg−1 day−1 Bz. The sample size was calculated considering the principles described by Cruz-Orive and Weibel (Reference Cruz-Orive and Weibel1990) and Novaes et al. (Reference Novaes, Penitente, Gonçalves, Talvani, Peluzio, Neves, Natali and Maldonado2013). During the experiment, the animals were kept in a room with a controlled environment (12/12-h inverted dark/light cycle, humidity 60–70% and temperature 22 ± 2 °C). Water and rodent chow were provided ad libitum.
Exercise training and physical performance
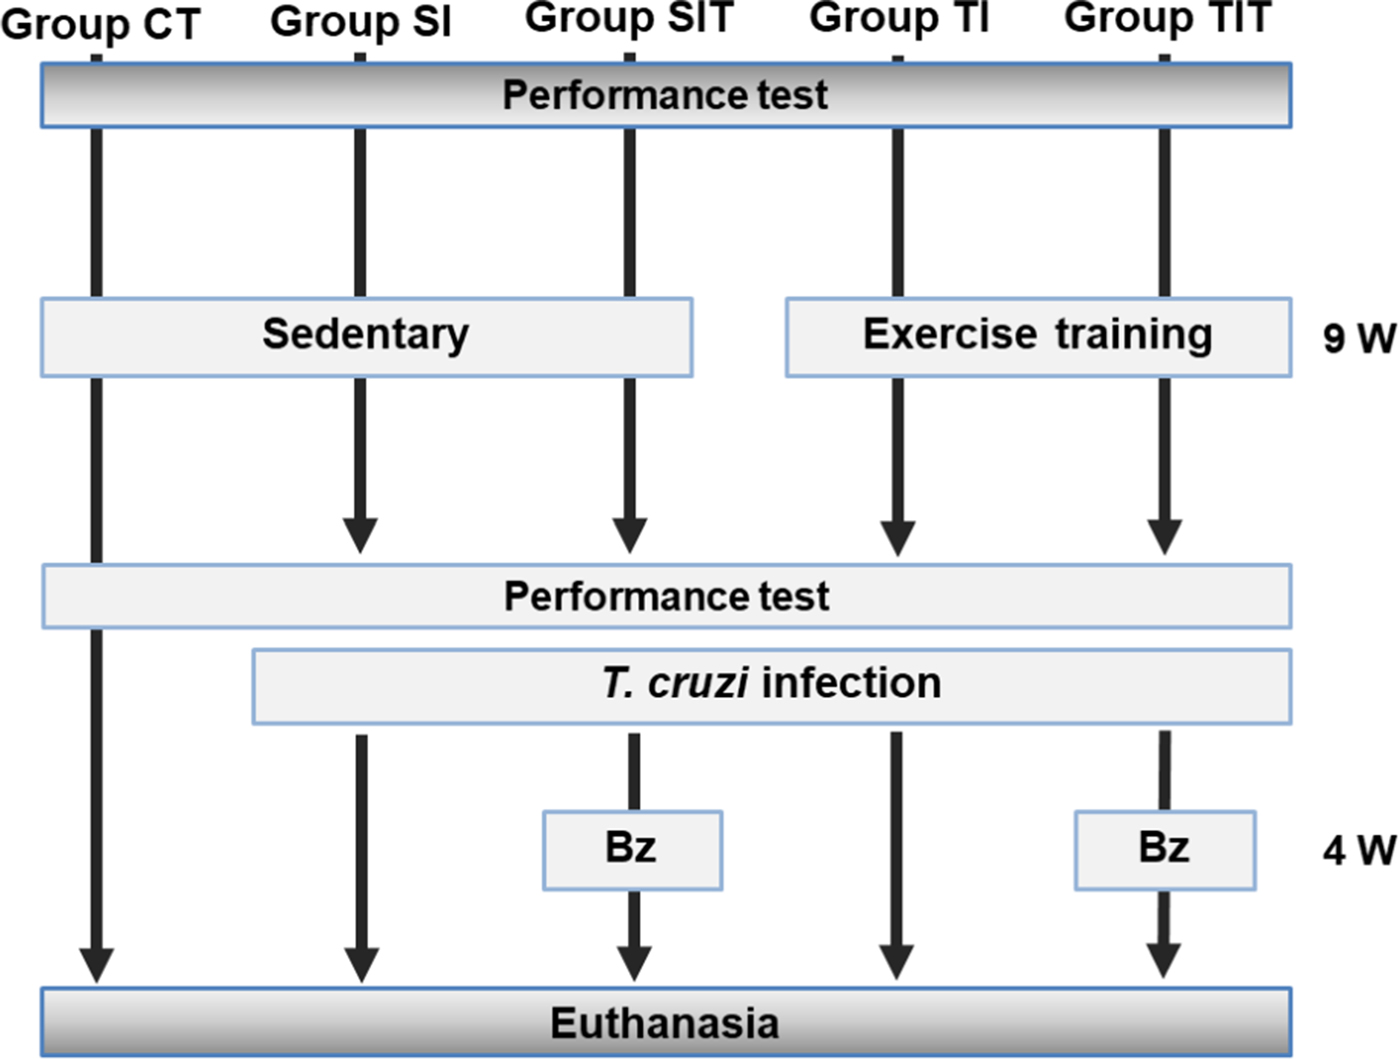
The study design is shown in Fig. 1. A progressive running protocol until fatigue was administered to evaluate the initial (before exercise training) and final (after the 9-week treadmill training program) levels of physical performance of each animal (Novaes et al., Reference Novaes, Penitente, Gonçalves, Talvani, Neves, Maldonado and Natali2011). Lactate levels were determined in 5-μL peripheral blood samples collected by tail puncture every 3 min (Accutrend Lactate, Roche, Basel, Switzerland). The lactate threshold (LT) and total physical work were used as markers of physical performance. Workload (W; kg-m) was calculated using the equation W = body mass (kg) × TTF (min) × treadmill speed (m min−1) × sine θ (treadmill incline), where TTF is the time until fatigue (Brooks et al., Reference Brooks, Donovan and White1984). The 9-week treadmill training program was initiated 24 h after this performance test (Novaes et al., Reference Novaes, Penitente, Gonçalves, Talvani, Neves, Maldonado and Natali2011, Reference Novaes, Gonçalves, Penitente, Cupertino, Maldonado, Talvani and Natali2017).
Experimental groups and study design used to investigate the impact of T. cruzi infection in sedentary and trained rats sequentially treated or untreated with specific antiparasitic chemotherapy. Groups = CT, control sedentary, uninfected and untreated; SI, sedentary infected; TI, trained infected; SIT, sedentary infected treated with benznidazole; TIT, trained infected treated with benznidazole. 9 W: 9 weeks of treadmill running training, 4 W: 4 weeks of post-infection benznidazole(Bz)-based chemotherapy.

Animals in the TI and TIT groups were trained using a motor-driven treadmill (Insight Instruments, Ribeirão Preto, Brazil). The running protocol was administered 5 days/week for 9 weeks, considering the results of LT. Thus, the exercise training was administered as follows: Week 1 and 2: 17 m min−1, 0% grade for 15 min. Exercise duration was increased 5 min day−1 until 60 min/session by the end of week 2. Weeks 3 and 4: 17 m min−1, 10% grade for 60 min. Week 5: 17 m min−1, 10% grade for 8 min at (warm-up), followed by 45 min at 20 m min−1, and 5 min at 17 m min−1 (warm-down). Weeks 6–9: 20 m min−1, 10% grade for 8 min (warm-up), followed by 45 min at 23 m min−1, and 5 min at 18 m min−1 (warm-down) (Novaes et al., Reference Novaes, Goncalves, Penitente, Bozi, Neves, Maldonado, Natali and Talvani2016b). From the lactate levels quantified at the end of each weekly exercise session, the animals were exercised at 65–75% (weeks 1 and 2), 75–85% (weeks 3–5) and 85–95% (weeks 6–9) of the initial LT.
Infection and parasitological measures
After 9 weeks of training, the exercise was completely discontinued. Forty-eight hours after the last exercise training session, animals in the TI and TIT groups were intraperitoneally infected with T. cruzi Y strain (150 000 blood trypomastigotes/100 g body weight) (Novaes et al., Reference Novaes, Penitente, Gonçalves, Talvani, Neves, Maldonado and Natali2011). Parasitological parameters (prepatent period, patent period, mean and peak parasitemia) were determined according to the Brener (Reference Brener1962) protocol. After confirmation of infection, animals in the SIT and TIT groups received daily treatment with Bz (100 mg kg−1, administered by gavage) for 30 days (LAFEPE, Pernambuco, Brazil). The Bz dose was based on the reference dose used in preclinical models of Chagas disease supported by the Drugs for Neglected Disease initiative (DNDi, Geneva, Switzerland) (Diniz et al., Reference Diniz, Mazzeti, Caldas, Ribeiro and Bahia2018). Fourth-eight hours after the last treatment, the animals were anesthetized (150 mg kg−1 ketamine and 16 mg kg−1 xylazine) and euthanized by cardiac puncture. The hearts were removed and weighed. The relative heart mass (hepatosomatic index) was calculated as heart mass/body mass of each animal.
Hemoculture
The efficiency of exercise training and specific chemotherapy in controlling parasite recrudescence was evaluated by hemoculture. In this assay, 400 µL of blood was collected by cardiac puncture during euthanasia and divided equally into two tubes containing 3 mL of sterile LIT culture medium. The tubes were incubated for 90 days at 28 °C and examined monthly for parasite detection (Novaes et al., Reference Novaes, Sartini, Rodrigues, Gonçalves, Santos, Souza and Caldas2016a).
Enzyme-linked immunosorbent assay for cytokines
The cytokine levels in cardiac muscle were measured by enzyme-linked immunosorbent assay (ELISA). Briefly, heart fragments (80 mg) were homogenized in sodium phosphate buffer (pH 7.2) and centrifuged at 3500 g for 10 min at 4 °C. The homogenate was collected and the concentration of TNF-α, IFN-γ, IL-4, IL-10, IL-17 and MCP-1 cytokines were determined according to the manufacturer's instructions (Promega, Madison, WI, USA). The reaction was revealed by a peroxidase-conjugated streptavidin method (Vector Lab., CA, USA) and a substrate containing 3,3′,5,5″-tetramethylbenzidine (Promega, WI, USA). The reactions were stopped with 50 µL hydrochloric acid (1 N) and read in a spectrophotometer at 450 nm. Cytokine levels were determined by comparing the optical densities (OD) obtained with a standard curve developed from recombinant cytokines (Novaes et al., Reference Novaes, Goncalves, Penitente, Bozi, Neves, Maldonado, Natali and Talvani2016b).
Heart histopathology
Heart fragments were fixed for 24 h in 10% formaldehyde. The fragments were dehydrated in ethanol, embedded in glycol methacrylate histological resin and cut into 3-μm thick sections using a rotary microtome (Leica Biosystems, Wetzlar, Germany). Five histological sections were collected in semi-series (one out of every 50) and stained with toluidine blue and basic fuchsine. Histological sections were analyzed using a bright field microscope (Axioscope A1, Carl Zeiss, Germany). Fifty microscopic fields (400× magnification) were randomly sampled, and a total myocardial area of 1.38 × 106 µm2 was analyzed for each group (Novaes et al., Reference Novaes, Penitente, Gonçalves, Talvani, Neves, Maldonado and Natali2011).
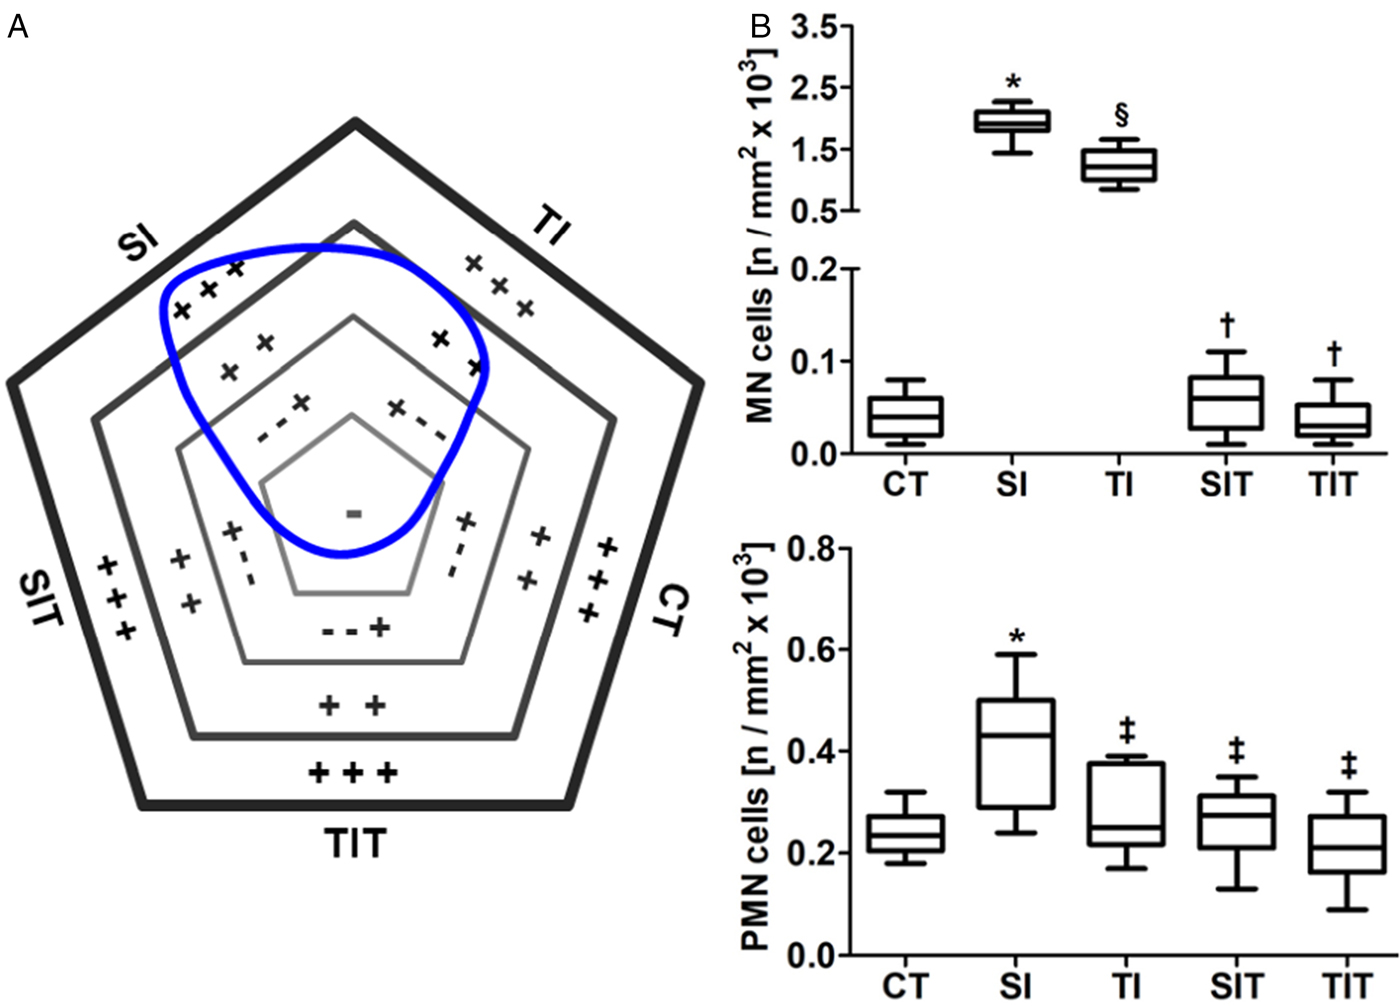
The severity of heart inflammation was assessed by comparing the distribution of interstitial cells in the myocardium for all groups (Novaes et al., Reference Novaes, Penitente, Gonçalves, Talvani, Peluzio, Neves, Natali and Maldonado2013). Tissue cellularity was evaluated by bright field microscopy (40 × objective lens, 400 × magnification; Axioscope A1, Carl Zeiss, Germany) using a standardized test area (At = 25 × 103 µm2) applied to 20 randomly sampled myocardial fields for each animal. A total tissue area of 25.0 × 105 µm2 was analyzed for each group. Interstitial cellularity was analyzed using the image analysis software Image-Pro Plus® (version 4.5; Media Cybernetics Inc., Silver Spring, MA, USA). The results were expressed through a polygonal field diagram sectorized in domains according the intensity of myocardial cellularity: (−) minimum, (− − +) mild, (+ +) moderate, or (+ + +) intense cellularity/inflammatory infiltrate (Felizardo et al., Reference Felizardo, Caldas, Mendonca, Reggiani, Tana, Almeida and Novaes2018).
Heart microstructural remodeling
Using the same histological images, a stereological method was applied to estimate the distribution of cardiomyocytes (parenchyma), connective tissue (stroma) and inflammatory cells. A test area (A T) of 3.25 × 103 µm2 with 100 test points (P T) was applied for all histological images. The volume density of cardiomyocytes (Vvcmy), connective tissue (Vvcnt), and blood vessels (Vvbvs) were estimated as Vv = P/P T, where P is the number of test points on the structure of interest. The relationship between blood vessels and cardiomyocytes (Vv[bvs]/Vv[cmy]) was used as a morphological index of myocardium vascularization. The relationship between structural and functional heart compartments was estimated as Vv[cnt]/Vv[cmy] (Novaes et al., Reference Novaes, Penitente, Gonçalves, Talvani, Peluzio, Neves, Natali and Maldonado2013). The number density (QA) of mononuclear (MN) and polymorphonuclear (PMN) interstitial cells per histological area was estimated as QA = ΣQ/A T; where ΣQ is the number of MN or PMN in the microscopic focal plane, and A T is the dimensions of the test area (A T = 8.56 × 103 µm2). Volume density was estimated from 20 randomly sampled histological fields for each animal using a 100× objective lens (1000× magnification; Axioscope A1, Carl Zeiss, Germany) (Novaes et al., Reference Novaes, Penitente, Gonçalves, Talvani, Peluzio, Neves, Natali and Maldonado2013). All counts were performed using the corresponding image analysis software (AxionVision; Carl Zeiss, Germany).
Biochemical assays for nitric oxide, hydrogen peroxide, lipid and protein oxidation
The same heart homogenate used to quantify cytokines was used for the biochemical analysis of reactive stress. Hydrogen peroxide (H2O2) levels in the heart were analyzed using a 96-well colorimetric commercial kit according to the manufacturer's instructions (Sigma-Aldrich, St. Louis, MI, USA). This method is based on a chromogenic Fe3+-xylenol orange reaction, in which a purple complex is formed when Fe2+ is oxidized to Fe3+ by peroxides present in the sample, generating a colorimetric (585 nm) result proportional to tissue H2O2 levels.
Nitric oxide was estimated from the nitrite/nitrate levels, which were determined using a 96-well colorimetric commercial kit according to the manufacturer's instructions (ThermoFisher Scientific, Waltham, MA, USA). This reaction converts nitrate to nitrite using the enzyme nitrate reductase. Nitrite is then detected at 540 nm as a colored product of the Griess reaction. The optical density obtained from the reaction was read using a microplate spectrophotometer (Anthos Zenyth 200, Biochrom, Cambridge, UK).
For analysis of lipid peroxidation, heart homogenate was reacted with thiobarbituric acid solution (15% trichloroacetic acid, 0.375% thiobarbituric acid and 0.25 N HCl) for 15 min. Heart levels of malondialdehyde were monitored in a spectrophotometer at 535 nm, as described previously (Gutteridge and Halliwel, Reference Gutteridge and Halliwel1990). Protein carbonyl (PCN) was measured in heart pellets by adding 0.5 mL of dinitrophenylhydrazine (DNPH, 10 mm). The reaction involved the formation of a 2,4-dinitrophenyl (DNP) hydrazone product from a derivatization of the carbonyl group with 2,4-dinitrophenylhydrazine. The optical density was measured in spectrophotometer at 370 nm (Levine et al., Reference Levine, Garland, Oliver, Amici, Climent, Lenz, Ahn, Shaltiel and Stadtman1990).
Assays for non-protein and enzymatic antioxidant defenses
Non-protein antioxidant defenses in the heart homogenate were analyzed using a total antioxidant capacity colorimetric kit, according to the manufacturer's instructions (Sigma-Aldrich, St. Louis, MI, USA). This method is based on the inhibition of endogenous antioxidant enzymes and blocking Cu2+ oxidation by small non-protein antioxidant molecules, which were detected in a spectrophotometer at 570 nm. The antioxidant capacity was estimated from a standard curve, using trolox as the antioxidant reference (Novaes et al., Reference Novaes, Santos, Cupertino, Bastos, Mendonça, Marques-da-Silva, Cardoso, Fietto and Oliveira2018).
The activity of the antioxidant enzymes superoxide dismutase (SOD), catalase (CAT), and glutathione S-transferase (GST) was analyzed by spectrophotometry in heart samples. Samples were prepared by homogenizing heart tissue in ice-cold sodium phosphate buffer (pH 7.0), which were then centrifuged at 3500 g for 15 min at 5 °C. SOD activity was analyzed using the xanthine oxidase method, which is based on the reduction of nitroblue tetrazolium (NBT) and the production of H2O2 (Sarban et al., Reference Sarban, Kocyigit, Yazar and Isikan2005). CAT activity was measured by a kinetic method based on H2O2 decomposition, where the velocity is proportional to enzyme activity in tissue samples (Aebi, Reference Aebi1984). GST activity was determined using a method based on the NADPH oxidation rate (Habig et al., Reference Habig, Pabst and Jakoby1974). The results were normalized by protein levels measured using the Bradford method (Bradford, Reference Bradford1976).
Statistical analysis
Data are presented as the mean and standard deviation (mean ± s.d.) or median and interquartile range. Data distribution was verified by the Kolmogorov-Smirnov test. Parametric data were compared using one-way analysis of variance (ANOVA) followed by Student–Newman–Keuls post hoc test. Non-parametric data were compared using the Kruskal–Wallis test. A probability of P < 0.05 was considered statistically significant.
Results
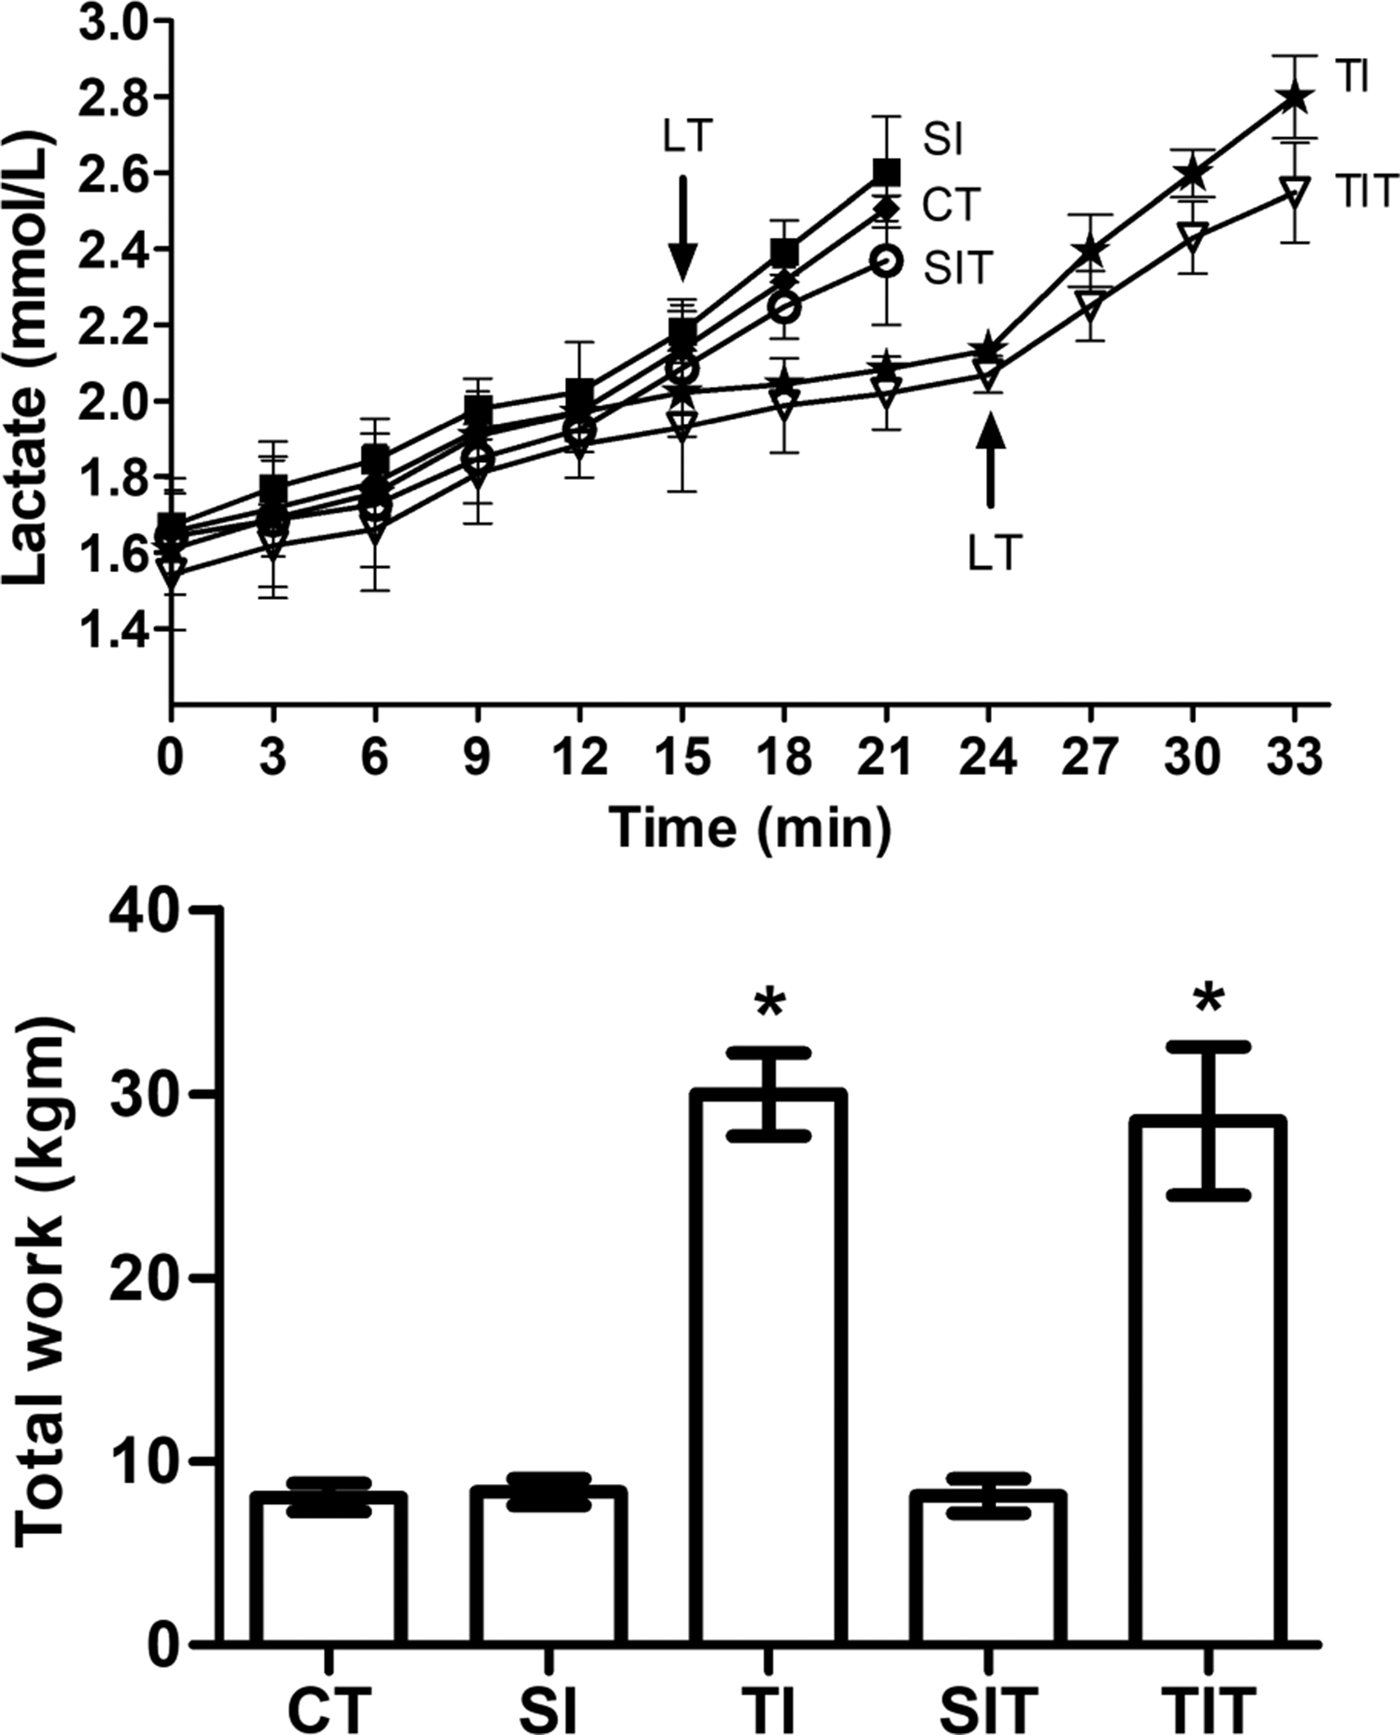
As indicated in Fig. 2, trained animals (TI and TIT) exhibited improved physical performance, which was evidenced by a prolonged lactate threshold and total physical work compared to all sedentary animals (P < 0.05).
Lactate threshold (LT) and total physical work until fatigue in sedentary and trained rats. CT, control sedentary, uninfected and untreated; SI, sedentary infected; TI, trained infected; SIT, sedentary infected treated with benznidazole; TIT, trained infected treated with benznidazole. Data are expressed as mean and standard deviation (mean ± s.d.). *Statistical differences (P < 0.05) compared to *CT, SI and TI.

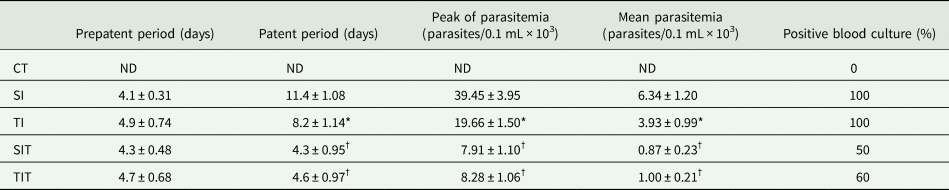
As expected, no evidence of infection was observed in CT animals. All infected groups exhibited a similar prepatent period, but TI rats presented reductions in the patent period and peak and mean parasitemia compared to SI animals (P < 0.05). These parameters were similar in the SIT and TIT groups, but were reduced when compared to the SI and TI groups (P < 0.05). Trypomastigotes were detected by hemoculture in all SI and TI animals (100%), while SIT and TIT rats presented 50% and 60% positive hemocultures, respectively (Table 1).
Parasitological parameters in sedentary and trained rats infected with Trypanosoma cruzi, sequentially treated or untreated with specific antiparasitic chemotherapy

CT, control sedentary, uninfected and untreated; SI, sedentary infected; TI, trained infected; SIT, sedentary infected treated with benznidazole; TIT, trained infected treated with benznidazole.
Data are expressed as mean and standard deviation (mean ± s.d.).
*†Statistical differences (P < 0.05) compared to *SI, †SI and TI.
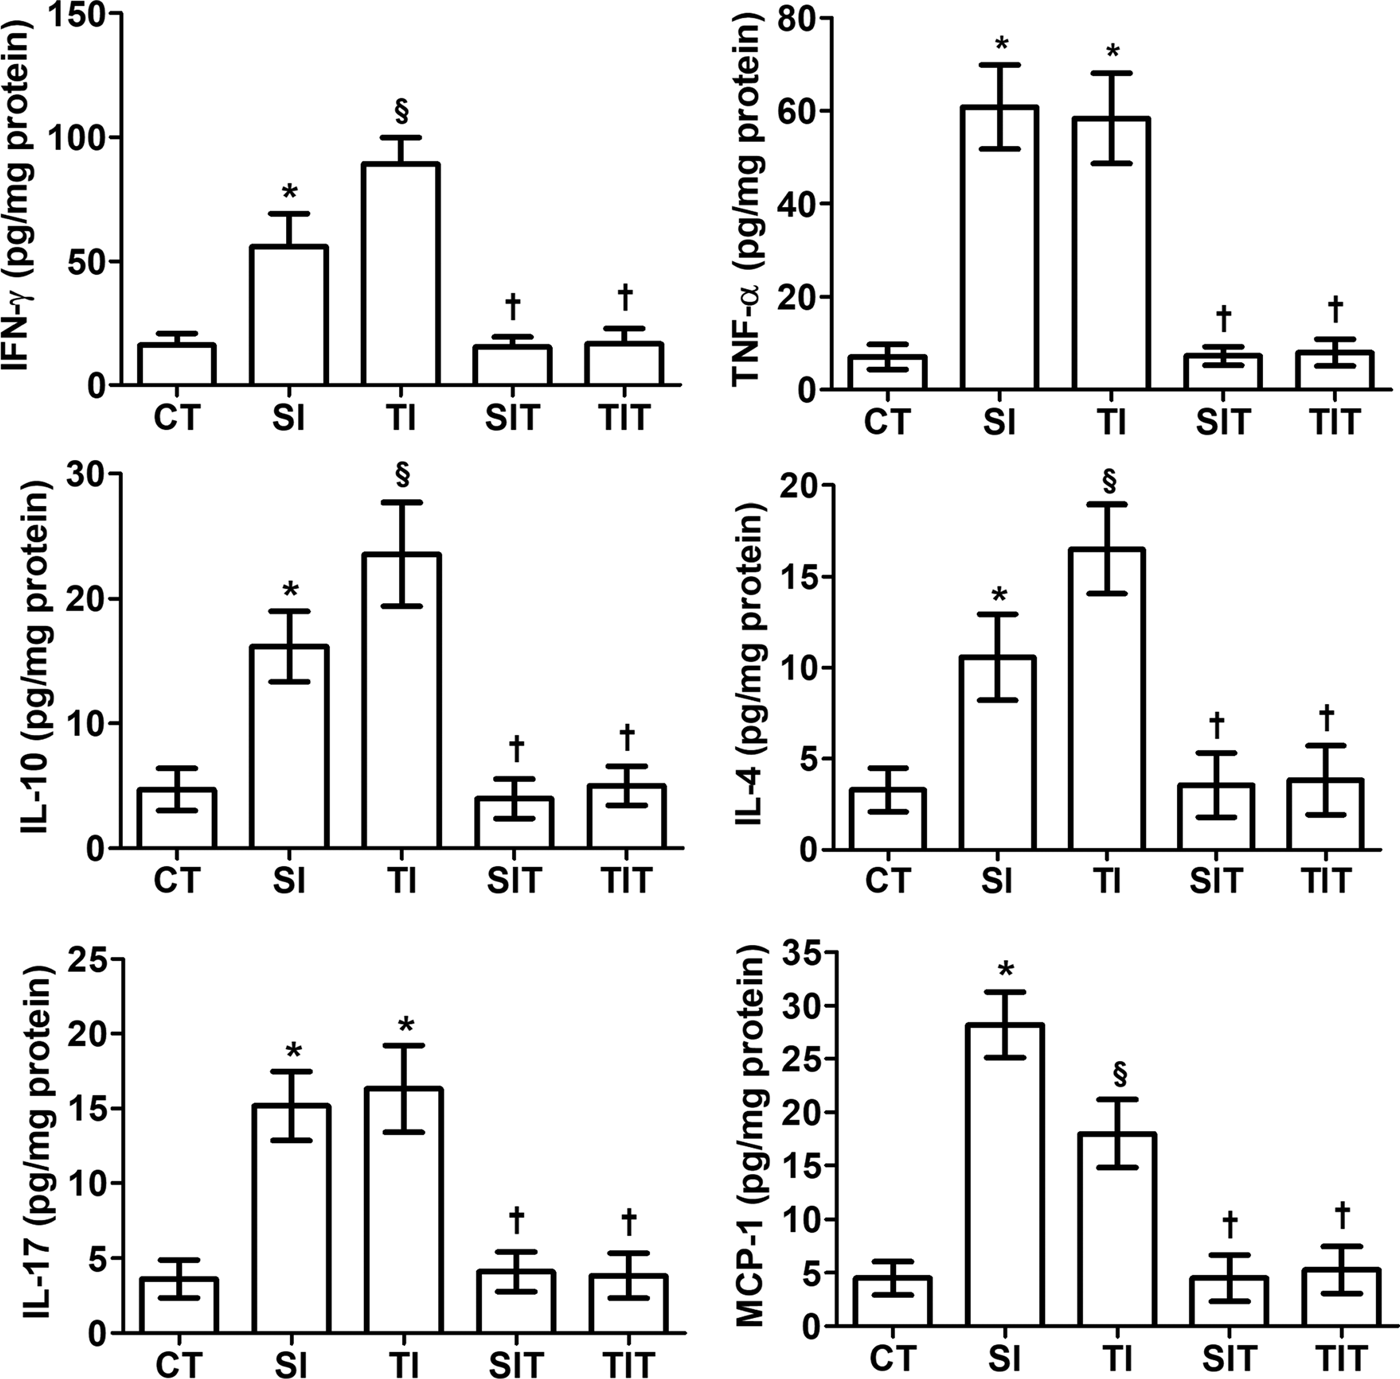
Hepatosomatic index was similar in all groups (CT = 3.67 ± 0.44, SI = 3.71 ± 0.58, TI = 3.80 ± 0.65, SIT = 3.64 ± 0.49, TIT = 3.70 ± 0.55 mg g−1) (P > 0.05). All cytokines investigated (INF-γ, TNF-α, IL-10, IL-4, IL-17, and MCP-1) were present at increased levels in the hearts of animals in the SI and TI groups compared to the CT, SIT and TIT groups (P < 0.05), which showed similar results between them (P > 0.05). The levels of INF-γ, IL-4 and IL-10 were increased (P < 0.05) and MCP-1 was reduced (P < 0.05) in TI compared to SI animals (Fig. 3).
Heart cytokine levels in sedentary and trained rats infected with Trypanosoma cruzi, sequentially treated or untreated with specific antiparasitic chemotherapy. CT, control sedentary, uninfected and untreated; SI, sedentary infected; SIT, sedentary infected treated with benznidazole; TI, trained infected; TIT, trained infected treated with benznidazole. Data are expressed as mean and standard deviation (mean ± s.d.). *§†Statistical difference (P < 0.05) compared to *CT, §CT and SI, †SI and TI.

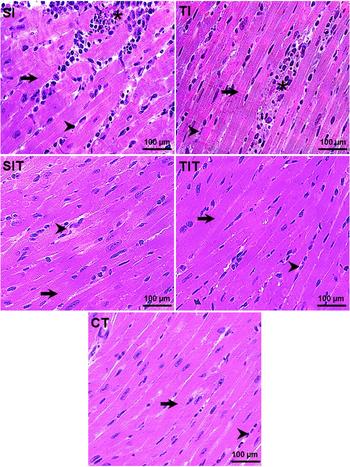
Both SI and TI animals presented myocardial connective tissue expansion, tissue necrosis and myocarditis, together with evident pericellular infiltration of polymorphonuclear and mainly mononuclear leucocytes. CT, SIT and TIT rats presented a similar and more organized heart microstructure, with the cardiomyocytes surrounded by scarce connective tissue and low interstitial cellularity. Necrosis and inflammatory foci were not observed in these groups (Fig. 4).
Heart microstructure in sedentary and trained rats infected with Trypanosoma cruzi, sequentially treated or untreated with specific antiparasitic chemotherapy. CT, control sedentary, uninfected and untreated; SI, sedentary infected; SIT, sedentary infected treated with benznidazole; TI, trained infected; TIT, trained infected treated with benznidazole. Arrows: cardiomyocytes (parenchyma); Arrowheads, connective tissue (stroma); Asterisk, necrotic tissue with intense inflammatory infiltrate.

The mapping of myocardial cellularity indicated elevated inflammatory infiltrate in TI and especially SI animals (Fig. 5A). These findings are supported by the quantitative analyses, which show a higher number of MN and PMN cells in the SI group compared to the other groups (P < 0.05). The number of MN cells was reduced in CT, SIT and TIT compared to TI (P < 0.05). The number of MN and PMN cells in the CT, TI, SIT and TIT groups were similar (P > 0.05; Fig. 5B).
Heart inflammation in sedentary and trained rats infected with Trypanosoma cruzi, sequentially treated or untreated with specific antiparasitic chemotherapy. CT, control sedentary, uninfected and untreated; SI, sedentary infected; SIT, sedentary infected treated with benznidazole; TI, trained infected; TIT, trained infected treated with benznidazole. In the polygonal field diagram (A), the symbols indicate (−) normal, (− − +) mild, (+ +) moderate or (+ + +) intense inflammatory infiltrate. The area delimited by the blue line indicates the status of tissue cellularity determined by all groups, and the line direction indicates the influence of each group in this status. (B) Myocardial distribution of mononuclear (MN) and polymorphonuclear (PMN) interstitial cells are represented in the graphics. Data are expressed as median and interquartile interval. *§†‡Statistical difference (P < 0.05) compared to *CT, ‡SI, §CT and SI, †SI and TI.
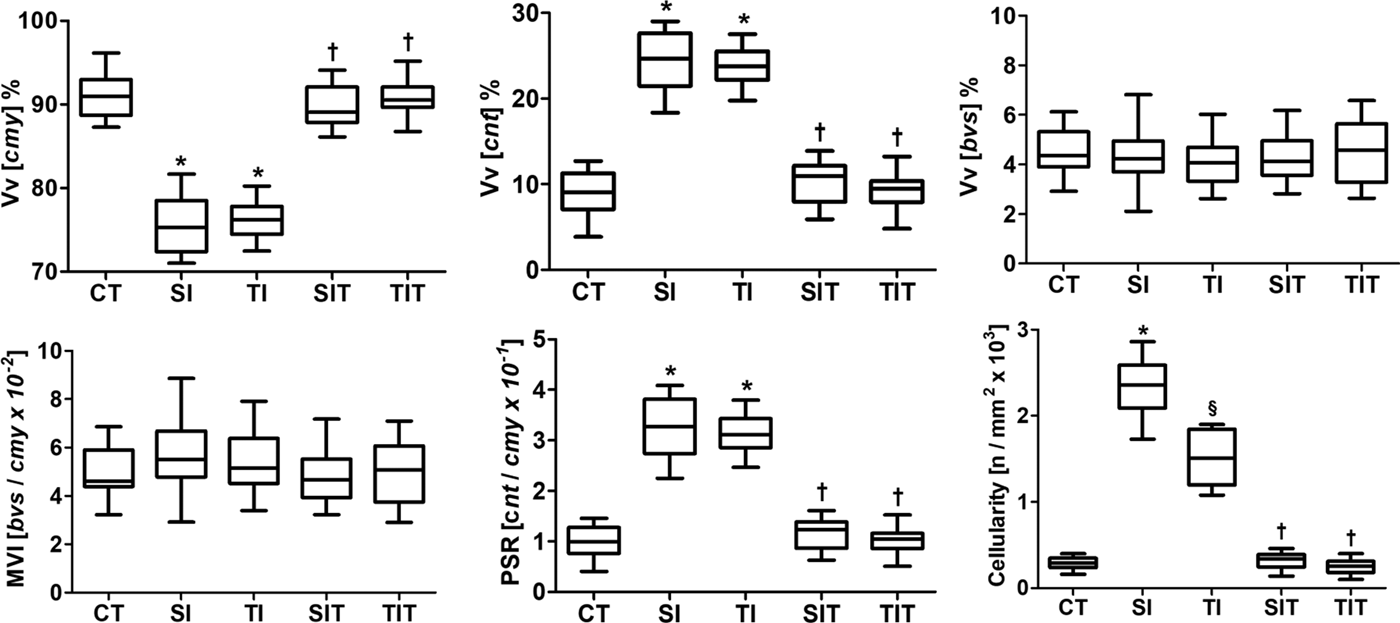
Stereological analysis demonstrated that SI and TI groups presented more extensive heart microstructural remodeling than SIT and TIT animals, which were similar to CT rats in all parameters analyzed (P < 0.05; Fig. 6). Rats in the SI and TI groups presented reduced parenchyma distribution and an increased proportion of connective tissue, parenchyma/stroma ratio and total tissue cellularity compared to CT, SIT and TIT animals (P < 0.05). Blood vessel distribution and myocardial vascularization index were similar in all groups (P > 0.05; Fig. 6).
Microstructural quantitative parameters of the cardiac tissue from sedentary and trained rats infected with Trypanosoma cruzi, sequentially treated or untreated with specific antiparasitic chemotherapy. CT, control sedentary, uninfected and untreated; SI, sedentary infected; SIT, sedentary infected treated with benznidazole; TI, trained infected; TIT, trained infected treated with benznidazole. Vv, Volume density; Cmy, Cardiomyocytes; Cnt, Connective tissue; Bvs, Blood vessels; MVI, myocardial vascularization index; PSR, Parenchyma/stroma ratio. Data are expressed as median and interquartile interval. *§†Statistical difference (P < 0.05) compared to *CT, §CT and SI, †SI and TI.

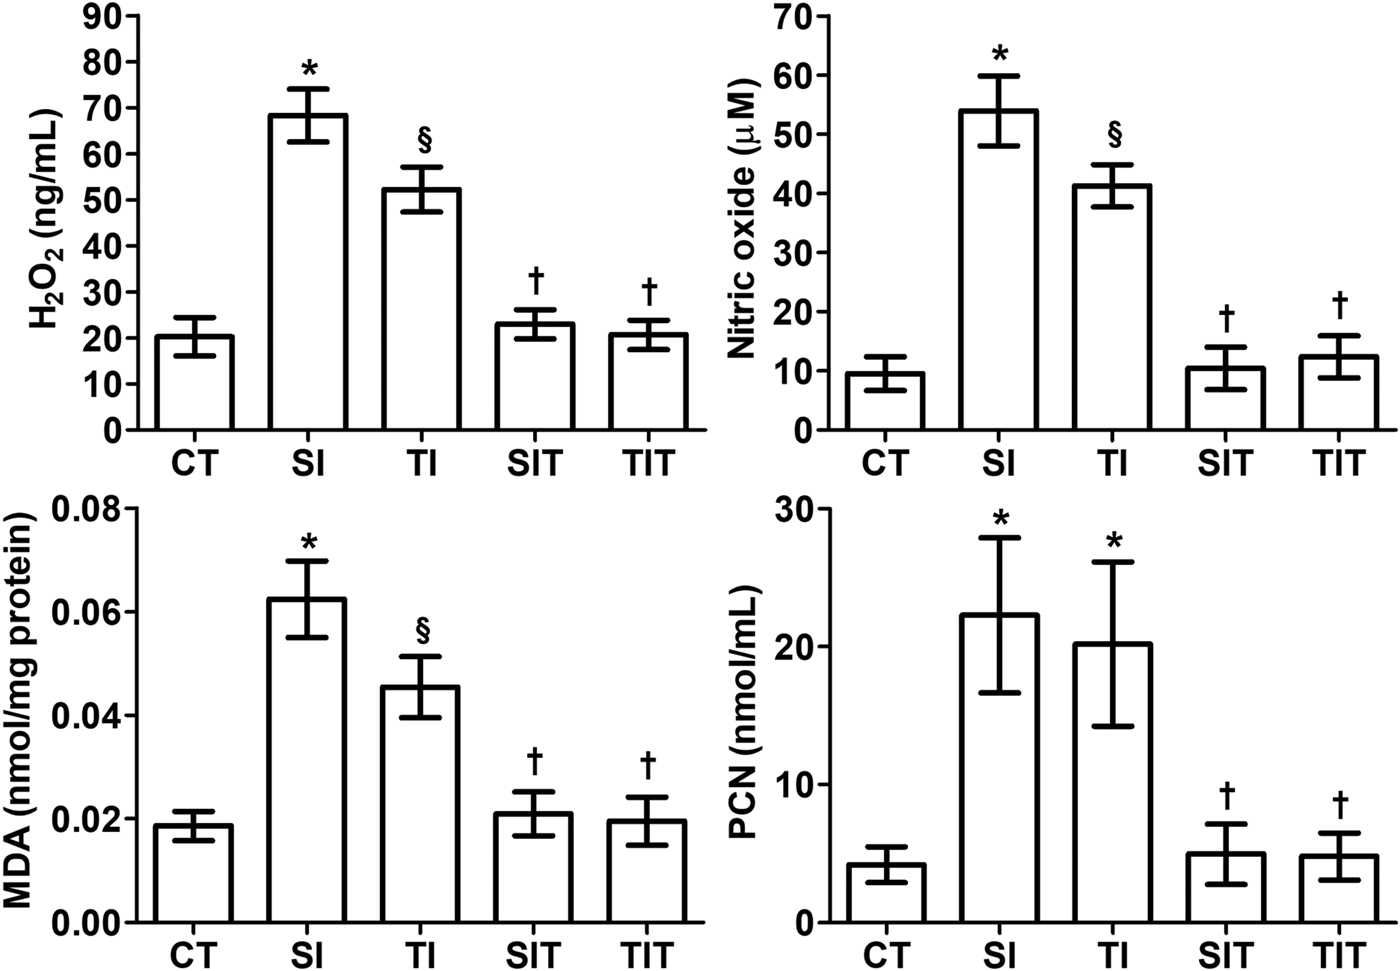
Levels of H2O2, NO and MDA were significantly higher in the hearts of SI animals compared to the other groups (P < 0.05). SI and TI animals presented similar heart PCN levels (P > 0.05). These parameters were similar in CT, SIT and TIT animals (P > 0.05), but were reduced when compared to the SI and TI groups (P < 0.05; Fig. 7).
Reactive species and markers of lipid and protein oxidation in hearts from sedentary and trained rats infected with Trypanosoma cruzi, sequentially treated or untreated with specific antiparasitic chemotherapy. H2O2, Oxygen peroxide; MDA, Malondialdehyde; PCN, Protein carbonyl. CT, control sedentary, uninfected and untreated; SI, sedentary infected; SIT, sedentary infected treated with benznidazole; TI, trained infected; TIT, trained infected treated with benznidazole. Data are expressed as mean and standard deviation (mean ± s.d.). *§†Statistical difference (P < 0.05) compared to *CT, §CT and SI, †SI and TI.

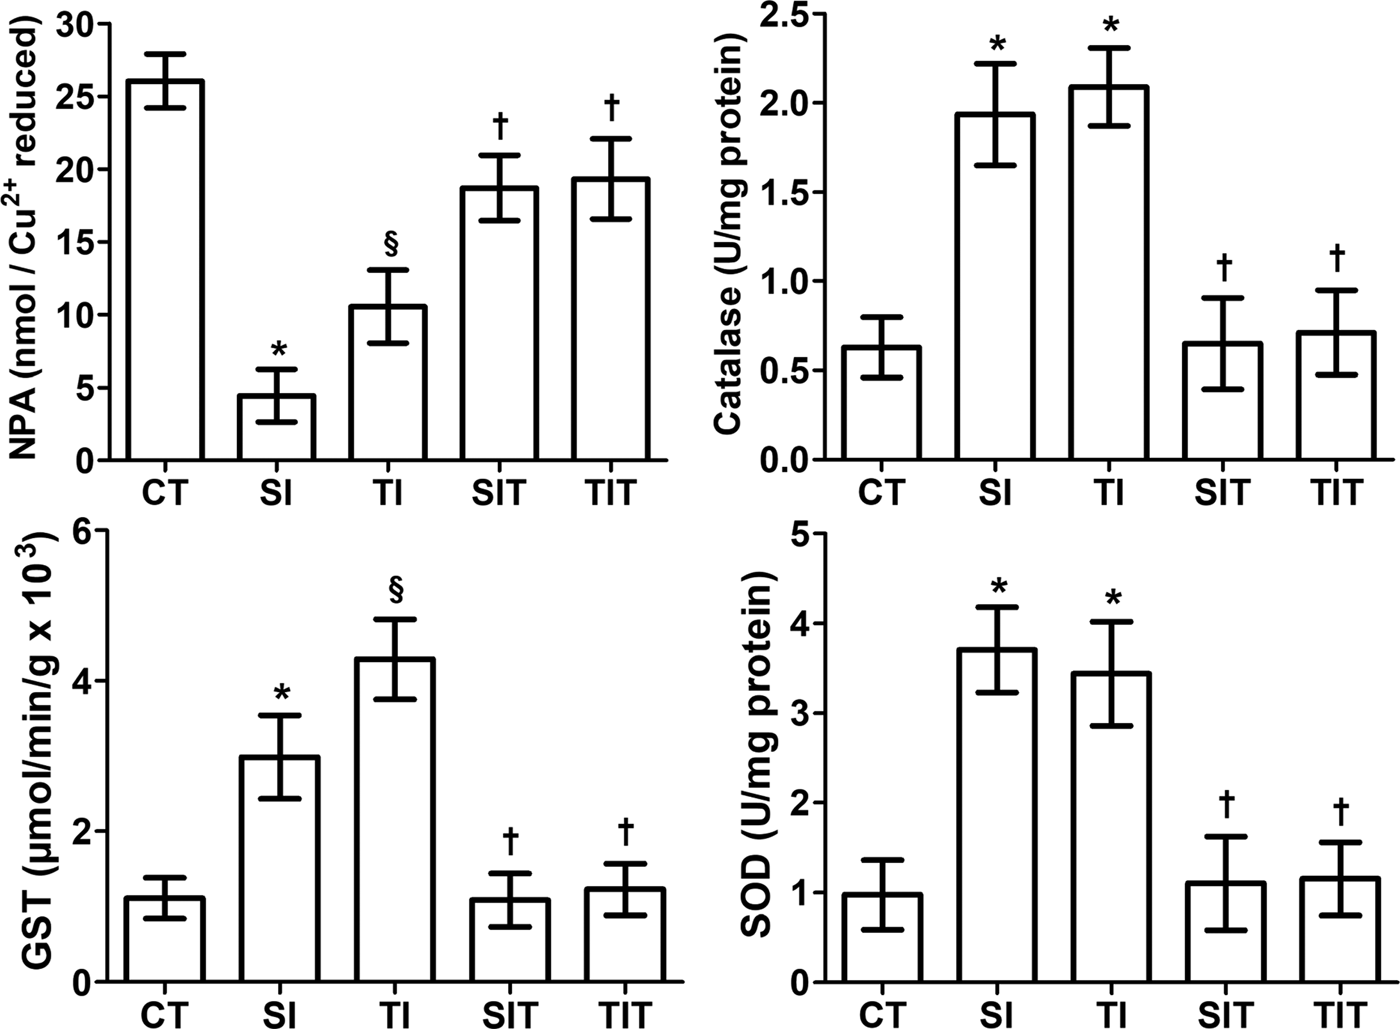
Non-protein antioxidant (NPA) levels were higher in CT animals compared to the other groups (P < 0.05). These molecules were reduced in TI and especially in SI animals compared to the SIT and TIT groups (P < 0.05), which showed similar levels (P > 0.05). Heart NPA levels and GST activity were higher in TI than SI animals (P > 0.05). Animals in the CT, SIT and TIT groups showed similar CAT, GST and SOD activities (P > 0.05), but these activities were reduced when compared to SI and TI rats (P < 0.05; Fig. 8).
Enzymatic and non-protein antioxidant defenses in hearts from sedentary and trained rats infected with Trypanosoma cruzi, sequentially treated or untreated with specific antiparasitic chemotherapy. NPA, Non-protein antioxidants; GST, Glutathione S-transferase; SOD, Superoxide dismutase. CT, control sedentary, uninfected and untreated; SI, sedentary infected; SIT, sedentary infected treated with benznidazole; TI, trained infected; TIT, trained infected treated with benznidazole. Data are expressed as mean and standard deviation (mean ± s.d.). *§†Statistical difference (P < 0.05) compared to *CT, §CT and SI, †SI and TI.

Discussion
In this study, the impact of sequential administration of non-pharmacological and pharmacological strategies in a rodent model of T. cruzi infection was investigated for the first time. When administered alone, pre-infection exercise training was effective for improving physical performance and attenuating the patent period, peak and mean parasitemia, heart inflammation, oxidative stress and pathological myocardial remodeling. These effects were similar but even more pronounced when Bz-based chemotherapy was administered alone or after pre-infection exercise training. Pre-infection exercise training-induced metabolic adaptations had no impact on parasite persistence in the peripheral blood, which was markedly reduced in animals receiving Bz alone or after exercise training.
Although a beneficial exercise-drug interaction is an objective reality in metabolic and cardiovascular diseases (Lenz et al., Reference Lenz, Lenz and Faulkner2004; Quindry and Franklin, Reference Quindry and Franklin2018), it remains unclear whether synergistic or additive effects between these therapeutic modalities exist in Chagas disease. Consistent with our findings, the antiparasitic and cardioprotective effects induced by exercise training have been observed in previous studies using different protocols of physical training in preclinical models of Chagas disease (Novaes et al., Reference Novaes, Sartini, Rodrigues, Gonçalves, Santos, Souza and Caldas2016a, Reference Novaes, Goncalves, Penitente, Bozi, Neves, Maldonado, Natali and Talvani2016b; Lucchetti et al., Reference Lucchetti, Zanluqui, de Ataides Raquel, Lovo-Martins, Tatakihara, de Oliveira Belém, Michelini, de Almeida Araújo, Pinge-Filho and Martins-Pinge2017). In contrast to our hypothesis, exercise-induced metabolic adaptations and subsequent treatment with Bz did not interact to potentiate host resistance against T. cruzi infection. Animals treated with Bz alone or exercise plus Bz displayed similar beneficial results, therefore, it is clear that the high efficacy of the etiological treatment exceeded the effect of effect of physical conditioning when exercise training was administered alone.
As expected, the therapeutic efficacy of Bz in reducing heart inflammation was undeniably higher than exercise-induced metabolic adaptations. The toxic effect of Bz against T. cruzi is broadly recognized, and is triggered by dialdehyde glyoxal produced from Bz enzymatic activation by the parasite trypanosomal type I nitroreductases (NTRs) (Wilkinson and Kelly, Reference Wilkinson and Kelly2009). This highly reactive product forms molecular complexes with guanosine and thiols, inhibiting antioxidant defenses, DNA and protein biosynthesis in T. cruzi (Wilkinson and Kelly, Reference Wilkinson and Kelly2009; Hall and Wilkinson, Reference Hall and Wilkinson2012). In addition to controlling the parasitic load (Santos et al., Reference Santos, Novaes, Cupertino, Bastos, Klein, Silva, Fietto, Talvani, Bahia and Oliveira2015; Caldas et al., Reference Caldas, Menezes, Diniz, Nascimento, Novaes, Caldas and Bahia2019), Bz exerts direct anti-inflammatory effects by inhibiting NFΚB signaling and modulating cytokine biosynthesis (Manarin et al., Reference Manarin, Pascutti, Ruffino, De Las Heras, Boscá, Bottasso, Revelli and Serra2010; Campos-Estrada et al., Reference Campos-Estrada, Liempi, González-Herrera, Lapier, Kemmerling, Pesce, Ferreira, López-Muñoz and Maya2015). Thus, by attenuating cardiomyocyte parasitism and the intensity of infectious myocarditis, Bz confers potent cardioprotective effects in Chagas disease (Caldas et al., Reference Caldas, Menezes, Diniz, Nascimento, Novaes, Caldas and Bahia2019; Camara et al., Reference Camara, Mendonça, Souza, Carvalho, Lessa, Gatto, Barreto, Chiacchio, Amarante, Cunha, Alves-Silva, Guimarães and Barral-Netto2019). As no additional anti-inflammatory effect was observed when Bz was administered in addition to exercise, the etiological treatment was responsible for modulating the host immune response against T. cruzi.
The effect of exercise in inducing immunological, biochemical and morphological beneficial adaptations cannot be completely disregarded. Exercise increased IFN-γ and TNF-α production and reduced MCP-1 levels in the heart, all of which are typical Th1 cytokines that represent an important line of defense against T. cruzi (Santos et al., Reference Santos, Novaes, Cupertino, Bastos, Klein, Silva, Fietto, Talvani, Bahia and Oliveira2015; Novaes et al., Reference Novaes, Goncalves, Penitente, Bozi, Neves, Maldonado, Natali and Talvani2016b). By improving leukocyte function and the balance between Th1 and Th2 antagonistic phenotypes, exercise-induced metabolic adaptations reinforce parasitic control and attenuates tissue damage and mortality in T. cruzi-infected hosts (Malm, Reference Malm2004; Gleeson, Reference Gleeson2007; Novaes et al., Reference Novaes, Sartini, Rodrigues, Gonçalves, Santos, Souza and Caldas2016a). While Th1 effectors such as IL-12, IFN-γ, TNF-α and MCP-1 exert protective effects, Th2 molecules such as IL-4, IL-10 and TGF-β attenuate NO biosynthesis and increase the host's susceptibility to T. cruzi infection (Teixeira et al., Reference Teixeira, Gazzinelli and Silva2002; De Andrade et al., Reference De Andrade, De Almeida, De Souza, Paiva, Andrade and De Medeiros Fernandes2018). However, concurrent Th2 and T regulatory (Treg) activation are required to avoid Th1 hyperstimulation, which is harmful to the host as it induces exacerbated inflammatory processes, oxidative stress, cardiomyocytolysis, tissue necrosis and reactive fibrosis (Rassi et al., Reference Rassi, Rassi and Marin-Neto2010; Soares et al., Reference Soares, De Lima, Rocha, Vasconcelos, Rogatto, Dos Santos, Iacobas, Goldenberg, Iacobas, Tanowitz, De Carvalho and Spray2010; Teixeira et al., Reference Teixeira, Hecht, Guimaro, Sousa and Nitz2011). Accordingly, the reduced heart MCP-1 levels also indicate a beneficial effect of exercise in attenuating heart inflammation, as the elevated production of MCP-1 is potentially associated with massive leucocyte recruitment and severe inflammatory damage to the heart (Adamopoulos et al., Reference Adamopoulos, Parissis, Karatzas, Kroupis, Georgiadis, Karavolias, Paraskevaidis, Koniavitou, Coats and Kremastinos2002; Paiva et al., Reference Paiva, Figueiredo, Kroll-Palhares, Silva, Silvério, Gibaldi, Pyrrho Ados, Benjamim, Lannes-Vieira and Bozza2009). The increased IL-4/IL-10 levels observed also corroborate the exercise-induced cardioprotective effects. This finding supports an improved immunological balance in trained animals, as these Th2/Treg cytokines act as anti-inflammatory mediators to control the intensity of the inflammatory process and the destructive potential of an exacerbated proinflammatory Th1 response directed against the parasite (Teixeira et al., Reference Teixeira, Gazzinelli and Silva2002; Savino et al., Reference Savino, Villa-Verde, Mendes-da-Cruz, Silva-Monteiro, Perez, Aoki Mdel, Bottasso, Guiñazú, Silva-Barbosa and Gea2007).
The reduction in heart inflammation observed in trained animals was not enough to prevent pathological myocardial remodeling when compared to sedentary animals. However, the cytokine profile, markedly lower MN and PMN cellularity, as well as microstructural remodeling were similar in both Bz-treated groups, independent of exercise training. There is evidence that the intensity of inflammatory infiltrate is closely correlated with morphological adaptations of the heart parenchyma and stroma (Novaes et al., Reference Novaes, Penitente, Gonçalves, Talvani, Peluzio, Neves, Natali and Maldonado2013, Reference Novaes, Goncalves, Penitente, Bozi, Neves, Maldonado, Natali and Talvani2016b). These adaptations were clearly observed in this study, particularly with regard to the parenchyma/stroma ratio, which indicated similar cardiomyocyte loss in the TI and SI groups. As cardiomyocytes are a direct target of T. cruzi parasitism, massive parenchymal loss by direct cardiomyocytolysis and myonecrosis is often observed in acute Chagas disease (Manque et al., Reference Manque, Probst, Pereira, Rampazzo, Ozaki, Pavoni, Silva Neto, Carvalho, Xu, Serrano, Alves, Meirelles Mde, Goldenberg, Krieger and Buck2011; Novaes et al., Reference Novaes, Sartini, Rodrigues, Gonçalves, Santos, Souza and Caldas2016a, Reference Novaes, Goncalves, Penitente, Bozi, Neves, Maldonado, Natali and Talvani2016b). At the same time, fibroblast activation and extensive stromal expansion occurs as a reactive myocardial response to parenchymal damage (Teixeira et al., Reference Teixeira, Hecht, Guimaro, Sousa and Nitz2011; Machado et al., Reference Machado, Jelicks, Kirchhoff, Shirani, Nagajyothi, Mukherjee, Nelson, Coyle, Spray, de Carvalho, Guan, Prado, Lisanti, Weiss, Montgomery and Tanowitz2012). In untreated infections, this process progresses quickly and may culminate in heart failure and host death (Manque et al., Reference Manque, Probst, Pereira, Rampazzo, Ozaki, Pavoni, Silva Neto, Carvalho, Xu, Serrano, Alves, Meirelles Mde, Goldenberg, Krieger and Buck2011; Teixeira et al., Reference Teixeira, Hecht, Guimaro, Sousa and Nitz2011). Although pathological cardiac remodeling was not prevented by exercise-induced metabolic adaptations, the potent parasitic and inflammatory control induced by Bz supports its cardioprotective effects (Novaes et al., Reference Novaes, Sartini, Rodrigues, Gonçalves, Santos, Souza and Caldas2016a, Reference Novaes, Gonçalves, Penitente, Cupertino, Maldonado, Talvani and Natali2017), evidenced by reduced tissue cellularity, preserved cardiomyocyte organization and parenchyma/stroma ratio.
The severity of heart inflammation and microstructural remodeling was consistent with our findings of reactive tissue damage in all groups investigated. Given the extensive heart inflammation observed in sedentary infected animals, the elevated production of reactive metabolites (i.e. H2O2 and NO) and extensive lipid peroxidation were not surprising (Santos et al., Reference Santos, Novaes, Cupertino, Bastos, Klein, Silva, Fietto, Talvani, Bahia and Oliveira2015; Novaes et al., Reference Novaes, Gonçalves, Penitente, Cupertino, Maldonado, Talvani and Natali2017). The respiratory burst in activated leucocytes and mitochondrial dysfunction in parasitized cardiomyocytes are the main sources of reactive metabolites in T. cruzi infection, which contribute to accelerated cardiac deterioration (Gupta et al., Reference Gupta, Bhatia, Wen, Wu, Huang and Garg2009a, Reference Gupta, Wen and Garg2009b; Machado et al., Reference Machado, Tanowitz and Ribeiro2013). As the upregulation of antioxidant defenses is a typical adaptive mechanism induced by exercise training (Novaes et al., Reference Novaes, Sartini, Rodrigues, Gonçalves, Santos, Souza and Caldas2016a, Reference Novaes, Gonçalves, Penitente, Cupertino, Maldonado, Talvani and Natali2017), reduced production of reactive metabolites was expected in trained rats compared to sedentary animals (Lucchetti et al., Reference Lucchetti, Zanluqui, de Ataides Raquel, Lovo-Martins, Tatakihara, de Oliveira Belém, Michelini, de Almeida Araújo, Pinge-Filho and Martins-Pinge2017). However, the increased GST activity and NPA levels were unable to prevent lipid oxidation in the cardiac tissue of these animals. Conversely, H2O2, NO and MDA levels were similar and markedly lower in both Bz-treated groups independent of exercise training, an effect which is potentially related to the role of Bz in controlling heart parasitism and inflammation (Santos et al., Reference Santos, Novaes, Cupertino, Bastos, Klein, Silva, Fietto, Talvani, Bahia and Oliveira2015; Camara et al., Reference Camara, Mendonça, Souza, Carvalho, Lessa, Gatto, Barreto, Chiacchio, Amarante, Cunha, Alves-Silva, Guimarães and Barral-Netto2019). As tissue parasitism, inflammation and reactive tissue damage are coupled processes that are directly related to heart morphofunctional damage and cardiomyopathy progression (Santos et al., Reference Santos, Novaes, Cupertino, Bastos, Klein, Silva, Fietto, Talvani, Bahia and Oliveira2015; Novaes et al., Reference Novaes, Goncalves, Penitente, Bozi, Neves, Maldonado, Natali and Talvani2016b), controlling these processes is a primary goal in the treatment of Chagas disease (Rassi et al., Reference Rassi, Marin-Neto and Rassi2017; Caldas et al., Reference Caldas, Menezes, Diniz, Nascimento, Novaes, Caldas and Bahia2019).
Taken together, our findings indicate that pre-infection exercise training is potentially associated with exercise-induced metabolic adaptations that improves host resistance against T. cruzi. However, this non-pharmacological modality of treatment is not able to potentiate the antiparasitic and cardioprotective effects of Bz-based chemotherapy, which remains the most effective treatment for controlling the key pathological outcomes involved in the pathophysiology of Chagas cardiomyopathy. As the type and amplitude of exercise-induced metabolic adaptations are closely correlated to exercise characteristics, it is possible that different training protocols are effective to induce variable responses to T. cruzi infection, an issue poorly understood that requires further investigation.
Financial support
This work was supported by the Brazilian agencies: Fundação do Amparo à Pesquisa do Estado de Minas Gerais (FAPEMIG, processes APQ-01895-16 and PPM-00077-18) and Conselho Nacional de Desenvolvimento Científico e Tecnológico (CNPq, processes 303972/2017-3, 305093/2017-7 and 423594/2018-4). This study was financed in part by the Coordenação de Aperfeiçoamento de Pessoal de Nível Superior – Brasil (CAPES) – Finance Code 001.
Conflict of interest
None to declare.
Ethical standards
The Institutional Ethics Committee for Animal Care approved the study (protocol 30/2009).