


Introduction
In British Columbia, Canada, the primary method of harvesting timber is clear-cut logging which consists of removing all the timber in large tracts of land (typically areas of 10–100 ha). This practice has been banned from mountain slopes in the Alpine countries of Europe for > 100 years and is not allowed in mountainous Scandinavia or Japan (Weir, in press). Since British Columbia is largely mountainous and since there is ample snow supply, clear-cut logging has resulted in significant environmental damage due to the effects of snow avalanche activity. Our research has shown that approximately 10 000 clear-cuts have been significantly affected by snow avalanche activity in British Columbia. The information in this paper represents the first compilation of data about avalanche terrain and snow supply characteristics for avalanches which have initiated as a result of clear-cut logging anywhere, not just in British Columbia (Weir, in press).
Our research has shown that there are two classes of environmentally destructive problems for avalanches interacting with clear-cuts: type I, where avalanches initiate in clear-cuts, and type II, where avalanches descend into clear-cuts. The information in this paper is strictly focused on type I events even though type II events can also cause significant environmental problems. Type I events are known to cause severe environmental damage and risk, including destruction of forest cover, prevention of regeneration of young seedlings, threats to facilities (dwellings, power lines and roads), stripping soil cover down to bedrock, discharge of debris into streams and initiation of debris torrents and landslides.
In this paper, I describe terrain parameters and forest cover for 76 avalanche paths which have initiated in clear-cuts (type I). The study areas comprise two parcels of land (each about 20 000 km2) in the Coast Mountains and the Columbia Mountains (eastern British Columbia), as shown in Figure 1. The database consists of 40 terrain and forest-cover parameters for each site collected by extensive air-photo searches, combined with information from maps and site visits. In addition, theoretical estimates of snow supply (mean and standard deviation of Gumbel distributions for maximum annual water equivalent) are derived for each site based on altitude and location from 70 snow-course sites maintained by British Columbia: Ministry of Environment, Lands and Parks (2000).
Map of British Columbia showing general study areas in Coast Mountains (four sub-regions) and Columbia Mountains (three sub -regions), with sub-regions defined for estimating mean maximum annual water equivalent of snow with elevation.

The results of the paper provide information about starting-zone variables collected from avalanches initiating in clear-cuts that is necessary to help characterize destructive avalanches in clear-cuts. Primary variables include average start-zone angle, start-zone surface roughness, vegetation height and coverage, aspect, slope curvature and snow-supply estimates. The objective of this study is to provide the statistical data framework as input to risk-based decisions to help minimize risk of damage for future logging plans.
Rationale for Parameter Selection and Snow-Climate Descriptions
In order to minimize risk of environmental damage in the future, the chance of avalanching (related to avalanche frequency) will have to be considered along with potential avalanche magnitude. A study of terrain parameters for forested avalanche paths at Rogers’ Pass, British Columbia, by Reference Smith and McClungSmith and McClung (1997) showed that all relevant parameters in their study which correlated significantly with avalanche frequency were directly or indirectly related to snow supply. Further, field observations combined with physical reasoning indicate that certain terrain characteristics in starting zones are important in preventing avalanche formation including: ground surface roughness, vegetation density and vegetation height. Accordingly, parameters in this study were chosen to represent those expected to be important for governing snow supply, avalanche size, avalanche frequency and parameters known to be important to inhibit avalanche formation (Reference McClung and SchaererMcClung and Schaerer, 1993).
The sites in this study are from two different snow-climate areas (Fig. 1) in British Columbia, each about 20 000 km2 in area: the Coast Mountains (maritime snow climate) and the Columbia Mountains (transitional snow climate). The maritime region of the Coast Mountains is subject to high snow supply, with rain possible any time during the winter. The transitional snow climate of the Columbia Mountains usually has less snowfall than coastal areas, with higher chance of persistent weak snow layers Reference JamiesonJamieson, 1995) which can affect the character of avalanching. See Reference McClung and SchaererMcClung and Schaerer (1993) for a more detailed comparison of maritime and transitional snow climates. The variables related to terrain and forest cover for the individual avalanche paths are described in the next section, and the estimates of snow supply (mean and standard deviation of maximum annual mm water equivalent (directly related to snow climate)) are described in a later section.
Data Collection Methods and Accuracy Limitations: Terrain and Forest-Cover Parameters
Terrain and forest-cover parameters for all avalanche sites were assessed by a combination of three methods: (1) air photos (scales ranging from 1:15 000 to 1:40 000, with most 1:20 000); (2) terrain contour maps (scale 1:20 000); and (3) site visits which included visual inspection, distance measurements with a laser range finder (accuracy ±1 m), altimeter readings (±50 m) and slope angle measurements (accuracy 1° with clinometer measurements).
Many of the sites were found from inspection of provincial air-photo collections maintained in Victoria, British Columbia, but most were found from field trips throughout the study areas. Each site was visited in summer to ensure that any disturbances noted were due to snow avalanches instead of landslides, debris flows or other damage types. Whenever possible, data were measured in the field, but when this was not possible, air photos and contour maps were used in combination to estimate parameters. Sometimes in the field, vegetation obscured the view or sites were not accessible due to impassable logging roads or terrain, so that a combination of maps and air photos was necessary to complete the database at such sites.
The combination of field measurements and estimates from contour maps and air photos implies that individual data elements have variable data accuracy across the datasets. However, it is felt this limitation will not have much effect on the use of the results, which are aimed at future application of risk-based methods based on probabilistic data trends. The advantages of the mixed accuracy data-collection methods include:
-
(1) more data are available within reasonable time and expense constraints than if precision information had been sought;
-
(2) the data precision is essentially the same as that available to potential users of the information;
-
(3) variable data accuracy from one site to another should not greatly affect the statistical trends which are most valuable for the risk-based approach intended for the future use of the information.
Individual Terrain and Forest-Cover Parameters: List, Description and Method of Measurement or Estimation
Starting-zone slope angle: average downslope angle in starting zone. Measured with clinometer or taken from contour maps. Estimated accuracy: nearest 1°.
Wind index: five-part categorical scale describing access of starting zone to drifting snow (Reference SchaererSchaerer, 1977). The five parts are: (1) completely sheltered from wind by surrounding dense forest; (2) sheltered by open forest or facing direction of prevailing wind; (3) open slope with rolls or other irregularities where local drifts can form; (4) lee side of sharp ridge; (5) lee side of wide, rounded ridge or next to large open area where large amounts of snow can be moved by wind. The wind index was estimated from air photos and site visits.
Ground surface roughness (excluding vegetation). This is a categorical descriptive variable. The categories are: (1) low: ground features < 1 m relief; (2) medium: ground features 1–2m relief; (3) high: ground features > 2 m relief. The estimates were made from site visits and air photos.
Starting-zone vegetation cover. This is a categorical, descriptive variable which takes into account interception of snowfall and interruption of snowpack by vegetation. The categories are referred to a plan view of the clear-cut: (1) low: more ground or ground vegetation visible than large deciduous or coniferous trees. (2) medium: roughly equal amounts of ground or ground vegetation and large coniferous or deciduous trees. (3) high: large deciduous or coniferous trees cover most of surface. The categories were determined from air photos and site visits.
Starting-zone aspect: compass aspect. The data were stratified into four quadrants: 1–90°, 91–180°, 181–270° and 271–360°. The aspects were determined from maps, air photos and field visits using a compass.
Gross-slope curvature. This is a categorical descriptive variable with values of +2, +1, 0, –1, –2. Positive values denote concave slopes, negative values denote convex slopes, and 0 means almost no curvature. The values were determined from site visits, air photos and maps. The categories are defined as follows: +2: by siting from the bottom of the concavity to the top, the tangent of the angle exceeds 0.5 (rise over run exceeds 50%); +1: similar to +2, with tangent of the angle 0.1–0.5 (rise over run 10–50%); 0: tangent of the angle from bottom to top is < 0.1. For convex slopes the same definitions apply, but minus signs are used. Reference GleasonGleason (1995) proposed an alternate definition of cross-slope curvature based on length measurements in the starting zone, but this definition was almost impossible to use in this study due to the difficulty of reaching many of the starting zones.
Downslope curvature. This is a categorical variable used to describe convex or concave starting-zone shapes in the downslope direction. The values are assigned based on whether slope angle decreases (concave) or increases (convex) downslope in the starting zone. The starting zone is approximated as two segments based on a break in slope angle, with a number assigned based on increase or decrease in slope angle. The categories (concave slopes) are defined as follows: 0: change in slope angle <5°; +1: decrease in slope angle >5° but <15°; +2: decrease in slope angle >15°. For convex slopes, categories –1 and –2 are defined as above for increase in slope angle in the starting zone. The categories were assigned from site visits, maps and air photos.
Starting-zone elevation: altitude of top of start zone (ma.s.L). The values were determined from maps with the aid of air photos and site visits (altimeter readings).
Average vegetation height in the starting zone: continuous variable of average height in meters including seedlings and stumps. The heights were estimated to nearest 0.5 m and were determined by site visits supplemented by air-photo analysis.
Avalanche size: Avalanche sizes were based on the five-part categorical variable estimated from damage characteristics for the Canadian avalanche-size classification system (see Reference McClung and SchaererMcGlung and Schaerer, 1993, p. 253, for complete description) based on destructive effects. The Canadian avalanche classification system is based on destructive effects so that sizes can be estimated after the events (similar in concept to the Mercalli scale for earthquake damage). According to convention in Canada, estimates are made for half-sizes. Twenty years of experience in Canada has shown that estimates to the nearest half-size by different experienced observers are generally agreed on. The sizes were estimated from site visits, contour maps and air photos. (1) Relatively harmless to people (e.g. sluffs). (2) Could bury, injure or kill a person (e.g. small slab). (3) Could bury a car, destroy a small building or break trees. (4) Could destroy a railway car, large truck, several buildings or forest up to 4 ha. (5) Largest snow avalanches known; could destroy a village or a forest up to 40 ha.
Determination of Snow-Amount Estimates: Mean and Standard Deviation of Annual Maximum Water Equivalent
No data are available for snow amounts at the locations studied. However, snow amounts have been found to be very important for estimating avalanche frequency (Reference SchaererSchaerer, 1977; Reference Smith and McClungSmith and McClung, 1997). Therefore, snow amounts were estimated theoretically from snow-course data collected at 70 sites throughout the study areas by the Ministry of Environment, Lands and Parks, Province of British Columbia (data records from 1935–99 contained on the World Wide Web (http://www.elp.gov.bc.ca/wat/snow-bulletin/archive/historic. html). Two scales of snow-amount patterns were found to be important from the data analysis: (1) snow amounts and characteristics (the coefficient of variation: ratio of standard deviation to the mean of maximum annual snow water equivalent) were significantly different for the two major snow-climate areas (Coast and Columbia Mountains); and (2) snow-amount variations with elevation were found to vary significantly within regions of each major climate area, similar to the findings of Reference Claus, Russell and SchaererClaus and others (1984). Therefore, the goal of the present study was to estimate snow amounts as a function of elevation within sub-regions for both the Coast and Columbia Mountains.
The procedure for determining the snow supply at a place involves locating the avalanche path within a sub-region (Fig. 1) and then applying a sub-region linear regression model of mean maximum annual snow with elevation to the top elevation of the start zone (Fig. 2). The standard deviation is then found by applying the coefficient of variation calculated for the general snow climate (Coast or Columbia Mountains) as described below (Fig. 3).
Mean maximum water equivalent with elevation for three sub-regions of the Columbia Mountains. Linear least-squares lines are shown with R as the correlation coefficient.

Mean maximum (μ) and standard deviation (a) in mm w.c.for Gumbel distributions from 70 snow-course sites in British Columbia. The points are determined by fitting a Gumbel distribution to annual maximum water equivalent of snow for each site. Least-squares lines are fitted through the data for Coast Mountain (□) and Columbia Mountain sites (•). R is correlation coefficient.

Snow Amounts for Coast and Columbia Mountains Compared
For each snow-course site, the parameters of a Gumbel distribution were determined by linear least-squares regression between ranked data for annual maximum snow amount (mmw.e.) and the reduced variate {−ln[−ln(Pi)]} corresponding to the datum where Pi is non-exceedance probability. The non-exceedance probability, Ph is related to the ranked values by Pi = (i – 0.5)/N, where i is rank of the datum and N is number of years of record. For example, the highest value for a station with 15 years of record is related to P15 = 0.97, indicating that 97% of values are not expected to exceed the value at the location, and the reduced variate corresponding to the highest point is 3.49. All stations had at least 10 years of records.
The mean, μ, and standard deviation, a, of the Gumbel distributions for each site were then determined by fitting a least-squares line. The slope of the line gave the scale parameter, b, and the intercept gave the location parameter, u for the Gumbel distribution at the site. The Gumbel mean is then given by μ = u + γb (where 7 is Euler’s constant, 0.57721… and the Gumbel standard deviation is
 Per cent variance explained (R2(%), where R is Pearson correlation coefficient) by the least-squares fits was 84–99%, usually exceeding 95%.
Figure 3 shows plots of mean, μ, and standard deviation, a, for the 70 individual Gumbel distributions. Least-squares fits through the points show that μ and a are related by two different linear regression lines in Figure 3 corresponding to two different coefficients of variation for these differing snow climates (Coast or Columbia Mountains). In the analysis below, the value of μ with elevation is determined within each sub-region, and the corresponding value of a can be determined from the general relations in Figure 3.
Sub-Region Analysis: Mean Maximum Water Annual Equivalent within the Coast and Columbia Mountains
Based on Gumbel means for mean maximum annual water equivalent individual snow-course stations, the Coast and Columbia Mountains were divided into four and three subregions, respectively (see Fig. 1). For each sub-region, a linear least-squares fit of Gumbel mean maximum annual water equivalent vs elevation was determined. Figure 2 shows least-squares lines and mean values from the Columbia Mountains. The sub-regions were determined by inspection such that a nearly linear relation was determined for each sub-region. Statistics from these least-squares lines showed that the per cent variance explained (R2) was 68–95%, indicating good fits in most cases. From the plots, a top avalanche starting-zone elevation within a sub-region is used to find an approximate mean maximum water equivalent for the site and, from Figure 3, the standard deviation can be estimated for the mean in the main region. For example, for a height of 1500 m in sub-region 3 of the Columbia Mountains, mean maximum annual water equivalent is 260 mmw.e. (Fig. 2) and standard deviation is 80 mm we. (Fig. 3).
The theoretical procedure above is similar but not equivalent to that outlined by Reference Claus, Russell and SchaererClaus and others (1984) for determining height dependence of water equivalence. Claus and others did not explore climate variation of the coefficient of variation as in this study (Fig. 3). Similar to the analysis above, Claus and others determined that sub-regions within a general snow climate are important, and used parabolic rather than linear relations to estimate snow amount as a function of altitude. However, in the higher altitudes where the avalanche starting zones in this study were found, the parabolic relations found by Claus and others can be approximated as nearly linear. The study presented here is somewhat simpler, and many more stations are available along with 20 years more data.
At a location, it may be assumed that maximum annual snow amounts will obey a Gumbel distribution based on the analysis of more than 70 sites. Given the mean value μ estimated at a site (altitude and sub-region) and the estimated value of a (or coefficient of variation) for the general climate region, the parameters (u, b) of the Gumbel distribution can be determined. An approximate value of water equivalent for any return period, xT, may be estimated from: xT < {−ln[−ln(Pi)]} where T is return period. For analysis in this paper, only the maximum mean annual water equivalent (μ) is calculated for each site, rather than estimates for other return periods.
Method of Analysis for Terrain Variables
The variables described above represent characteristics of terrain, forest cover and snow supply for avalanche starting zones caused by clear-cut logging. The terrain variables are of two general types: categorical (e.g. wind index, down-slope and cross-slope shape, ground surface roughness) and numerical (e.g. start-zone slope angle, mean maximum annual snow water equivalent). In order to display the characteristics, categorical variables are shown as cumulative samples (cumulative distributions for discrete sample points) indicating the fraction of the data in each category or bar graphs. Numerical variables are plotted as cumulative distribution functions or probability density functions. The intention here is to highlight the characteristics of the individual variables as they relate to avalanche initiation in clear-cuts, with attention given to variables which should be related to magnitude and frequency of avalanches. All avalanches in the database released by natural processes as opposed to human triggering.
Results of Analysis
For the analysis below, Ms denotes sample mean, as denotes sample standard deviation and N is number of data points.
Average start-zone slope angle (°). μs = 37, as = 5, N = 76, range = 30–50. Figure 4 shows a fit of the data to a Gaussian distribution indicating a generally good fit except at slope angles around 30°, which implies the distribution is left skewed. The mean and standard deviation are almost identical to point measurements at fracture lines reported by Reference PerlaPerla (1977): mean 38° and standard deviation 5° for 194 avalanches. Pearson correlation coefficient with avalanche size for the data in this study gave –0.07, indicating almost no relationship with avalanche size.
Top elevation of starting zone (m). Coast Mountains: μs = 1150, as = 200, range = 700–1500, N = 58. Columbia Mountains: Ms = 1500, as = 250, range =1200–1900, N = 18. The data indicate higher elevations in the Columbia Mountains, but coefficients of variation are identical for both ranges. However, the altitude differences are partly due to higher valley elevations for the Columbia Mountains. Often the Coast Mountains rise from elevations near sea level. Reference GleasonGleason (1995) and Reference Smith and McClungSmith and McClung (1997) found that starting-zone elevation correlates significantly with avalanche frequency, and I believe this is related at least partly to snow supply.
Mean maximum water equivalent (mm). Coast Mountains: Ms = 1150, as = 700, range = 200–2300, N = 58. Columbia Mountains: μs = 750, as = 150, N =18, range = 400–1000. Figures 5 and 6 show probability plots for both the Coast Mountains and Columbia Mountains against a Gaussian distribution. Both distributions are approximately Gaussian. The data show the substantial differences between snow-supply and data ranges for the Coast and Columbia Mountains for the theoretical site estimates. The smaller number of sites for the Columbia Mountains makes conclusions tentative there.
Wind index (categorical 1–5), N =76. Figure 7 shows a bar graph for wind index. The graph shows that categories 2 and 3 have the most events, with only a small fraction of events in category 1. Percentage of event by class: (1) 3%; (2) 28%; (3) 34%; (4) 18%; (5) 17%.
Ground surface roughness (categorical 1–3), N = 76. Category 1 (< 1 m): 25% of events; category 2 (1–2 m): 75% of events. No events were found for category 3 (>2m). These results are inconclusive, but they may suggest that ground surface roughness can have a significant effect on avalanche initiation if roughness height exceeds 2 m.
Vegetation height (continuous variable; heights in m), N = 76. Figure 8 shows a cumulative distribution plot. There is a correspondence with ground surface roughness: about 90% of the events occur when vegetation height is 2 m or less.
Vegetation (tree) coverage of start zone (categorical variable with values 1–3), N =76. Percentages by category: (1) 46%; (2) 33%; (3) 21 %. The data show progressively fewer events with increasing vegetation coverage.
Downslope shape (-2 (extremely convex), 0 (no curvature), +2 (extremely concave)), N =76. Figure 9 contains a bar graph of the values. It shows that most start zones have small downslope curvature with concave shape, perhaps indicating propensity for snow collection in depressions or bowls.
Gross-slope shape (same categories as downslope shape), N = 76. Figure 10 contains a bar graph of the values. The values strongly indicate concave shapes. These values, combined with those from downslope shape, indicate that bowl-shaped (concave) features show a prevalence for destructive avalanche initiation, with concave shape being more prevalent in the cross-slope direction with the shape definitions used here.
Aspect (categorical by 90° sectors: (1) 1–90°; (2) 91–180°; (3) 181–270°; (4) 271–360°), N =76. Percentage event by sector: (1) 32%; (2) 18%; (3) 30%; (4) 20%. The data show a prevalence for events in sectors 1 and 3 (50% higher than adjacent sectors) which are lee and windward slopes with respect to the prevailing storm direction (southwest) in British Columbia. There may also be an effect for persistence of instabilities (northeast aspects) and for sun exposure (southwest aspects), possibly increasing destructive events, but this cannot be determined by the dataset since for most sites there is no information available about avalanche-release conditions.
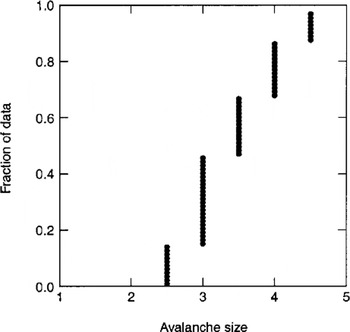
Avalanche size (categorical variable with values of 1–5 increasing with destructive affect according to Canadian size classification), N = 76. Figure 11 shows a cumulative plot of the data with sizes 2.5–4.5. It shows that more than half the events are from large, very destructive events with size > 3.5. A correlation study of avalanche size with mean maximum annual (estimated) snow amount and average start-zone slope angle gave Pearson correlation coefficients –0.16 and –0.07, respectively, indicating almost no relation. Since all events were found by vegetation damage and other visible destructive effects, no events with size <2.5 are present in the database. By definition, events of size 2 or less will not destroy significant vegetation.
Probability plot for a Gaussian distribution (-) compared with data for average start-zone slope angle (•) for 76 avalanche sites.

Probability plot for a Gaussian distribution (––) compared with mean maximum water equivalent estimates • (Coast Mountain avalanche sites, N = 58).

Probability plot for a Gaussian distribution (––) compared with mean maximum water equivalent estimates • (Columbia Mountain avalanche sites, N = 18).

Bar graph for starting-zone wind index for 76 avalanche sites. The five categories (Reference SchaererSchaerer, 1977) are defined in the text. As the wind index increases, the starting zone is progressively more exposed to wind loading of snow.

Cumulative distribution plot for mean vegetation height in start zones. The plot is similar to a cumulative distribution probability function for continuous values.

Bar graph of downslope shape for 76 start zones. Values: –2, extremely convex; 0, no curvature; +2, extremely concave. Categories are defined in the text.

Bar graph of cross-slope shape for 76 start zones. Values as in Figure 9 caption. Categories are defined in the text.

Cumulative distribution plot for avalanche size. Based on the five-part Canadian size classification estimated from destructive effects (Reference McClung and SchaererMcClung and Schaerer, 1993, p. 253). The plot is similar to a cumulative distribution probability function for continuous values.
Descriptive Statistics of Clear-Cut Area, Damaged Area and Starting-Zone Area
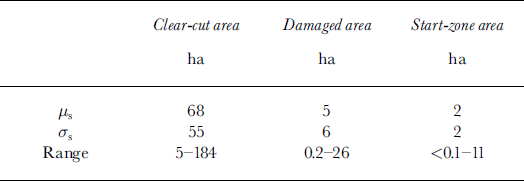
The statistics in this section yield information about the areas involved in this study. All areas are estimated from maps and air photos in hectares and shown in Table 1. The data in Table 1 show that, on average, the damaged area is about twice the estimated start-zone area, and that average clear-cut size far exceeds either of these areas.
Descriptive statistics for clear-cut area, start-zone area and damaged area
Conclusions and Discussion
The data and analyses in this paper provide information on the characteristics of destructive avalanches resulting from clear-cut logging. While the information comes from two different climate areas, the only clear distinction between characteristics for these areas is in terms of snow supply and top elevation of starting zones, both of which are consistent with what is expected: higher elevations in the Columbia Mountains and greater snow supply in the mari-time-climate area of the Coast Mountains.
Important results include: (1) no relation between avalanche size, average start-zone angle and mean maximum snow amount; (2) a prevalence of events on concave slopes, with concave features being more pronounced in the cross-slope than in the downslope direction; (3) potential importance of ground roughness, vegetation height and vegetation coverage in inhibiting events; (4) a prevalence of events for windward and leeward slopes with respect to prevailing storm direction (generally southwest in British Columbia): about 50% higher than adjacent 90° aspect sectors.
Important limitations of the present study (aside from data accuracy) include the difficulty in incorporating local terrain features which may be crucial for avalanche initiation, and the lack of on-site information about avalanche release conditions. It is expected (Reference Smith and McClungSmith and McClung, 1997) that snow supply will influence expected avalanche frequency so that general avalanche frequency due to this effect might be expected to be higher in the Coast Mountains, on average. However, the events in this study are primarily large ones which presumably initiate from deep weak layers such as surface hoar and facets or deeply buried crusts. It is possible that surface hoar and facets may be more prevalent and persist longer in the transitional snow climate of the Columbia Mountains so that a counterbalance may be in place to offset lower snow supply there to increase the frequency of large destructive avalanches. However, even though this seems physically reasonable, it cannot be proven by the data contained in this study.
Acknowledgements
The data for this study were collected by D. Sandilands and P. Weisinger of the Department of Geography at the University of British Columbia (UBC). I am grateful for their work. This research was sponsored by Forest Renewal BC, Canadian Mountain Holidays, the Natural Sciences and Engineering Research Council of Canada, the Peter Wall Institute of Advanced Studies at UBC and the Vice President Research at UBC. I am extremely grateful for these sources of support. The able editing of K. Hutter and R. Decker is thankfully acknowledged.



