Implications
This study investigated the effect of changing the dietary nitrogen (N) and energy supply relative to each other and the subsequent changes in net portal appearance of nitrogenous and energy nutrients on the net amino acid (AA) uptake by the liver and net N supply to the peripheral tissues. We have shown that in the case of a N-deficient diet supply to growing lambs, some N-sparing mechanisms have taken place in the liver, namely a decreased oxidation of non-essential AA and sustained hepatic export protein synthesis, which preserves the AA from oxidation processes. In contrast, when the energy supply is decreased relative to N, the AAs are not used for anabolic purposes and oxidised (partly to allow gluconeogenesis within the liver, and partly to be used as energy sources by the peripheral tissues). Consequently, in this study, an insufficient N supply relative to the energy supply required to cover the theoretical requirements for the lambs’ growth, the AA net uptake and partition between the liver and the rest of the body adapt to spare AA. When energy is insufficient relative to the energy supply, such sparing mechanisms do not occur.
Introduction
Matching nutrient supply to the nutrient requirements is an important challenge in farm animal nutrition. Existing ruminant feeding systems (e.g. Jarrige, Reference Jarrige1989) allow a prediction of the utilisation of absorbed nitrogen (N) for growth. However, conversion efficiency is assumed to be unaffected by diet composition in such models. This assumption does not hold when dietary conditions differ from those used to construct the system (Hanigan, Reference Hanigan2005). Some of the mechanisms that invalidate these assumptions involve splanchnic tissue metabolism (total splanchnic tissues (TSP) = portal-drained viscera (PDV) + liver). Many studies consistently show the crucial role of the TSP in the net utilisation of amino acids (AAs; Lapierre et al., Reference Lapierre, Bernier, Dubreuil, Reynolds, Farmer, Ouellet and Lobley2000) by the whole body. The TSP contribute 0.3 to 0.5 of the whole body protein synthesis (Lobley, Reference Lobley1994) and about 0.5 of the O2 uptake in ruminants (Ortigues-Marty and Doreau, Reference Ortigues-Marty and Doreau1995). Their active metabolism and its regulation to changes in supply (diet composition) and demand (maintenance v. growth or lactation) may account for discrepancies between observed and predicted performance, but these effects are poorly understood (Lobley, Reference Lobley2007).
In growing ruminants, many studies have investigated the effects of nutritional factors on the net splanchnic fluxes of AA, as reviewed by Lobley (Reference Lobley2003). The effects of feed intake have been extensively investigated and clearly show that an increase in feed intake induces an increased net portal and net splanchnic release of AA (Burrin et al., Reference Burrin, Ferrell, Eisemann and Britton1991; Lapierre et al., Reference Lapierre, Bernier, Dubreuil, Reynolds, Farmer, Ouellet and Lobley2000), associated with increased milk production (Lapierre et al., Reference Lapierre, Bernier, Dubreuil, Reynolds, Farmer, Ouellet and Lobley2000; Raggio et al., Reference Raggio, Lemosquet, Lobley, Rulquin and Lapierre2006). However, the picture is less clear when more subtle diet changes are made. For instance, an increased metabolisable protein supply increased the net portal appearance (NPA) of AA (Blouin et al., Reference Blouin, Bernier, Reynolds, Lobley, Dubreuil and Lapierre2002). However, the increases in metabolisable protein supply have increased (Blouin et al., Reference Blouin, Bernier, Reynolds, Lobley, Dubreuil and Lapierre2002; Raggio et al., Reference Raggio, Lemosquet, Lobley, Rulquin and Lapierre2006) or had no effect (Metcalf et al., Reference Metcalf, Beever, Sutton, Wray-Cahen, Evans, Humphries, Backwell, Bequette and MacRae1994; Castillo et al., Reference Castillo, Kebreab, Beever, Barbi, Sutton, Kirby and France2001) on milk production and/or yield. Energy supplementation alone increased the net hepatic uptake of free AA (Ferrell et al., Reference Ferrell, Kreikemeier and Freetly1999; Savary-Auzeloux et al., Reference Savary-Auzeloux, Majdoub, LeFloc’h and Ortigues-Marty2003), but a small milk protein yield response to the energy supplementation was observed (Rigout et al., Reference Rigout, Hurtaud, Lemosquet, Bach and Rulquin2003; Raggio et al., Reference Raggio, Lemosquet, Lobley, Rulquin and Lapierre2006).
Therefore, a N deficiency (relative to energy) and an energy deficiency (relative to N) have an impact on N utilisation and partition between the splanchnic tissues and the muscle/udder. The liver is known to play a central role in N utilisation in these nutritional situations (Reynolds, Reference Reynolds2006), partly because this tissue is involved in many obligatory regulatory processes of N and energy homeostasis, such as maintenance of blood AA and glucose concentrations within a physiological range and ammonia detoxification among others. These processes involve various metabolic pathways such as protein synthesis and breakdown, oxidation, gluconeogenesis and ureagenesis.
The aim of this study was to investigate the outcome of changes in the relative dietary N and energy supply on the net fluxes of nitrogenous compounds across the TSP in growing lambs. The consequences of the variations of the splanchnic AA uptake observed with the different diets on the net N supply to peripheral tissues have also been investigated. The role of the liver has been given special attention because it is often described as one of the ‘integrators’ of dietary supply with body requirements (Reynolds, Reference Reynolds2006). To study these N/energy interactions, animals were fed either a control (C) diet formulated according to the recommendations for maintenance and growth (Jarrige, Reference Jarrige1989) or a diet deficient in either N or energy. To fully assess the ability of the splanchnic and peripheral tissues to alter their AA net utilisation to spare or spend energy or N, the dietary imbalance was achieved by depleting N or energy in the ration rather than by supplementation. These results are complementary to the data obtained on the same animals in which hepatic protein metabolism and partition of protein metabolism within the whole body were measured (Savary-Auzeloux et al., Reference Savary-Auzeloux, Kraft, Bequette, Papet, Rémond and Ortigues-Marty2010).
Material and methods
Animals and treatments
The experiment complied with national legislation on animal care (Certificate of Authorization to Experiment on Living Animals, No. 63-113, Ministry of Agriculture, France).
Six growing male lambs (crossbred Limousin × Ile de France × Romanov), 4- to 6-months old, with a mean live weight of 41.5 kg ± 2.6 kg during the experiment (mature weight, 60 kg) were surgically prepared. Blood catheters were inserted into the portal and hepatic veins as described previously (Ortigues-Marty et al., Reference Ortigues-Marty, Durand and Lefaivre1994; Savary-Auzeloux et al., Reference Savary-Auzeloux, Kraft, Bequette, Papet, Rémond and Ortigues-Marty2010). The lambs were also fitted with a transit-time ultrasonic blood flow probe on the portal vein (Type A; Transonic Systems Inc., Ithaca, NY, USA), housed in individual stalls at 20°C with continuous lighting and had ad libitum access to drinking water and a trace mineral salt block. After surgery, the lambs were left to recover for at least 3 weeks while they were adapted to the C diet.
Following the recovery period, the six lambs received each of the three experimental diets in a replicated 3 × 3 Latin square design. A detailed description of the experimental design has been described elsewhere (Savary-Auzeloux et al., Reference Savary-Auzeloux, Kraft, Bequette, Papet, Rémond and Ortigues-Marty2010). Briefly, the three diets were composed of 0.3 hay and 0.7 concentrate, and differed only in concentrate composition and total dry matter (DM) allowances. The chemical composition of the concentrates was modified by altering the level of maize or its components (maize gluten meal and starch). The diet (C) was designed to offer an adequate, balanced supply of N and energy for a theoretical growth rate of 200 g/day (Jarrige, Reference Jarrige1989). The N-deficient diet (LN) provided 0.8 of the N intake of the C diet, but with similar energy content and DM allowances (Table 1). The energy-deficient diet (LE) was formulated to supply 0.8 of the metabolisable energy (ME) intake of the C diet through lower DM allowances (Table 1). Each treatment period lasted 2 weeks. The treatment periods were separated by a transition period of 7 days when the animals were fed the C diet. The daily feed allowances were adjusted at the start of each treatment on the basis of the initial metabolic weight (live weight0.75) of the animals and dispensed in eight equal meals at 3-h intervals. Twenty-four hours before, and throughout the sampling day, the animals were fed every hour to obtain a metabolic steady state.
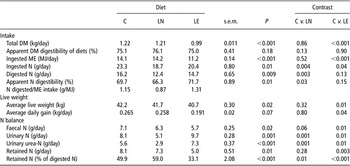
Live weight, daily gain, intake, digestibility and N balance of growing lambs fed the C, LN and LE diets (n = 6)Footnote *

C = control; LN = N-deficient; LE = energy-deficient; DM = dry matter; ME = metabolisable energy.
* Some of these basic data (DM intake, digested ME and N, live weight and retained N) are also presented in Savary-Auzeloux et al. (Reference Savary-Auzeloux, Kraft, Bequette, Papet, Rémond and Ortigues-Marty2010).
At the end of the experiment, the lambs were euthanised and correct positioning of the catheters and probes was confirmed at necropsy.
Measurements and laboratory analyses
Feed intake and refusals were measured daily. Samples of hay and the three concentrates were taken to quantify DM, ash, cellulose, starch, lipids and total N using standardised methods (EEC Directive 81/680, French Standard NFV 18-101, EEC Directive 92/89, third EEC Directive corrected 27 November 1980, second EEC Directive corrected 20 December 1983 and French Standard NFV 03-050, respectively). Live weights were measured twice weekly. N balance was determined by the total collection of urine and faeces over the past 6 days of each treatment period. Faeces and urine from each animal were collected daily. Urine was collected in 35% w/v sulphuric acid to avoid N volatilisation losses. Faeces and urine were pooled and stored at −20°C before analysis for DM and Kjeldahl N.
The measurements for net nutrient fluxes were carried out on the last day of each treatment period. On the sampling day, portal blood flows were continuously recorded for 7 h (1000 h to 1700 h) using a flowmeter (T206, Transonic Systems Inc., Ithaca, NY, USA). Seven sets of arterial, venous portal and hepatic blood samples were withdrawn at hourly intervals (30 min before and after each meal) from 1030 h to 1630 h. Every hour, 1 ml of blood was taken from each catheter in heparinised tubes (5 IU/ml blood) for AA assay. Every 2 h, another 1 ml of blood was taken in tubes containing 3 mM EDTA-K (10 μl/ml blood) for urea-N and ammonia-N measurement. Whole blood was immediately analysed for haematocrit.
To determine AA concentrations, heparinised blood was centrifuged (15 min at 1200 × g) and 750 μl of the plasma obtained was spiked with 60 μl of an internal standard of [U-13C] AA mixture (hydrolysed algae: 5 mg/ml, Martek, MD, USA) obtained from hydrolysis of algal protein (Calder et al., Reference Calder, Garden, Anderson and Lobley1999), plus [amide 1-15N]asparagine, [amide 1-15N]glutamine, 15N cysteine and U-13C histidine (Cambridge, Isotope Laboratories, Andover, MA, USA; 0.45 to 0.75 mg/ml for each AA). The spiked plasma was deproteinised with sulphosalicyclic acid (10% w/v) and centrifuged at 2600 × g for 10 min at 4°C. The supernatant was stored at −20°C until analysis. At the time of analysis, AA were purified on AG50 X8 H+ resin (Bio-Rad, Hercules, CA, USA) and an N-(tert-butyl-dimethyl-silyl) AA derivative was prepared (Calder and Smith, Reference Calder and Smith1988). AA concentrations were determined by gas chromatography–mass spectrometry (Trace GC/Automass Multi, Thermofinnigan, Courtaboeuf, France) as described by Calder et al. (Reference Calder, Garden, Anderson and Lobley1999).
Blood with EDTA (300 μl) was stored at −20°C for urea-N analysis by diacetylmonoxime direct assay (Ormsby, Reference Ormsby1942).
Calculations and statistical analyses
As the liver in sheep is irrigated by several arteries, the utilisation of flow probes for arterial blood flow measurement was impossible. Consequently, the hepatic arterial blood flow was assumed to be 0.053 of the portal blood flow based on its reported contribution to hepatic blood flow (Barnes et al., Reference Barnes, Comline and Dobson1986; Savary-Auzeloux et al., Reference Savary-Auzeloux, Majdoub, LeFloc’h and Ortigues-Marty2003). Plasma flows (l/min) in each vessel were calculated using haematocrit and corresponding blood flows (l/min). The values of blood and plasma flows were averaged over the entire sampling day as no significant variation of blood flow had been detected.
Afferent and efferent plasma fluxes of AA were calculated using plasma concentrations and the corresponding plasma flows. Afferent and efferent blood fluxes of urea-N were calculated using blood urea concentrations and blood flows (for calculation, see Milano, Reference Milano1997). Net fluxes across PDV, the liver and TSP were calculated as described elsewhere (Savary-Auzeloux et al., Reference Savary-Auzeloux, Majdoub, LeFloc’h and Ortigues-Marty2003), by the difference between afferent and efferent fluxes. A negative flux indicates a net uptake of metabolite, whereas a positive flux indicates a net release. The fractional extraction of a metabolite by each tissue was calculated by dividing the net metabolite flux by the afferent flux to the tissue.
Total AAs (TAAs) and each AA family (essential, branched-chain and non-essential) were the sums of corresponding AA (essential AA (EAA) = His, Ileu, Leu, Lys, Met, Phe, Thr, Val; branched-chain AA (BCAA) = Ileu, Leu, Val; non-essential AA (NEAA) = Ala, Asn, Asp, Cys, Glu, Gln, Gly, Pro, Ser, Tyr; and TAA = EAA + NEAA, respectively).
To calculate the contribution of each AA to the total splanchnic exchanges of N, the concentration of each AA (expressed as μmol AA per gram of plasma) was converted to grams of N.
Statistical analysis
Results were analysed by ANOVA for a double Latin square design, with square, animal (nested within the square), treatment and period as the main factors. Analysis was carried out using the GLM procedure of Statistica (Statsoft, Tulsa, OK, USA). Means were compared by orthogonal contrasts (contrast 1: C v. LN and contrast 2: C v. LE). Differences were declared significant at P < 0.05 and tendencies were declared for 0.05 < P < 0.1
Results
Each catheter remained functional throughout the experiment. No significant drift of blood flow or haematocrit was noted during each sampling day.
Intake, growth and N balance
N intake of the lambs (Table 1) on the LN diet was 0.8 of the C diet (P = 0.01). However, DM and ME intake were similar between the LN and C diets. As planned, ME intake by the lambs on the LE diet was 0.8 of the ME intake in the C-fed animals (P < 0.01). However, N intake was also reduced (0.88 of the C diet; P < 0.05) as a result of a lower than expected N content of the maize used in concentrate that was used in the LE diet (for details, see Savary-Auzeloux et al., Reference Savary-Auzeloux, Kraft, Bequette, Papet, Rémond and Ortigues-Marty2010). Apparent DM digestibility was high and similar across diets (Table 1). N digestibility in the LN diet was 0.95 of the value obtained from the C diet (P < 0.05) and was not affected in the LE compared with C. Consequently, the apparent digestible N in the LN diet was 0.77 of the C diet (P < 0.01), but was not significantly different between the LE and the C diets (16.2, 12.4 and 14.7 g digested N/day, for C, LN and LE, respectively). Thus, the ratio of apparently digested N to ME was 1.15, 0.87 and 1.31 g/MJ for C, LN and LE, respectively.
No differences in average live weight and daily gain were noted between the C and LN diets (Table 1). In the LE diet, mean live weight was 0.96 of the C diet (P = 0.01), probably as the result of lower DM intake (DMI; P < 0.01). Similarly, the daily live weight gain tended to be lower (P = 0.07) compared with C. N retention was not affected in the LN diet and was decreased in the LE diet (P < 0.01). Consequently, efficiency of digested N utilisation was increased for the LN diet (0.59 of digested N, P < 0.01) and reduced with the LE diet (0.34 of digested N, P < 0.01) compared with C (0.50 of digested N). This is consistent with the urinary N output, which represented 0.50, 0.41 and 0.66 of apparently digested N, for C, LN and LE, respectively, reflecting significant changes in urinary output between the diets (Table 1).
Blood and plasma flow
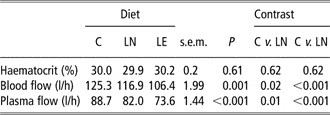
The haematocrit, blood flows and calculated plasma flows are shown in Table 2. Haematocrit was not influenced by the diet (P = 0.61). Portal blood and plasma flows in the LN diet were 0.93 of the C diet (P < 0.02), whereas for the LE diet they were 0.84 of the C diet (P < 0.01).
Haematocrit and blood and plasma flows in the portal vein of growing lambs (n = 6) fed the C, LN and LE diets

C = control; LN = N-deficient; LE = energy-deficient.
Urea-N and ammonia-N
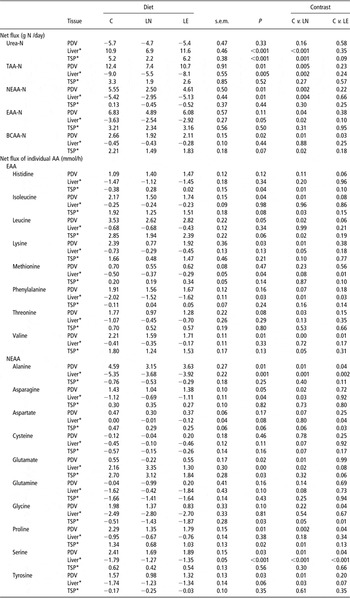
Arterial concentration and net flux of urea-N are presented along with the AA results (Tables 3 and 4). The measurement of urea-N in urine (Table 1) together with recycled urea-N in the PDV (Table 4) was consistent with the urea-N produced by the liver. The urea-N in urine and urea-N that enters the gut represented 11.4, 7.6 and 12.7 gN/day for the C, LN and LE diets, whereas the net urea-N production by the liver was 10.9, 6.9 and 11.6 gN/day for the C, LN and LE diets (Table 4). Owing to the technical difficulties in the measurement of ammonia-N, the data are not presented in this study.
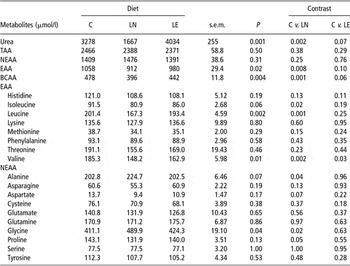
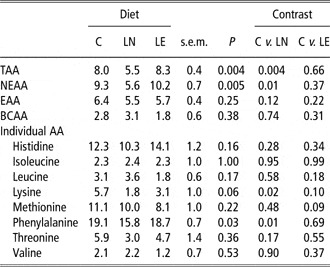
Arterial plasma concentrations of urea and AAs (μmol/l) in growing lambs (n = 6) fed the C, LN and LE diets

AAs = amino acids; C = control; LN = N-deficient; LE = energy-deficient; TAA = total AAs; EAA = essential AA; NEAA = non-essential AA; BCAA = branched-chain AA.
Net splanchnic fluxes of urea-N, TAA-N, NEAA-N, EAA-N and BCAA-N (expressed in g N/day) and individual AAs (expressed in mmol/h) in growing lambs (n = 6) fed the C, LN and LE diets

AAs = amino acids; TAA-N = total AA N; EAA-N = essential AA N; NEAA-N = non-essential AA N; BCAA-N = branched-chain AA N; C = control; LN = N-deficient; LE = energy-deficient; PDV = portal-drained viscera; TSP = total splanchnic tissues.
*Because blood flow in the hepatic artery and the hepatic vein were assumed to be 0.053 and 1.053 of the portal blood flow, respectively, the net fluxes in the liver and TSP are estimated values.
Arterial concentrations of AAs
The TAA and NEAA arterial concentrations were similar in all three diets (Table 3). However, EAA arterial concentrations were lower in the LN diet (0.86 of the C diet, P < 0.01) and tended to be so for the LE diet (0.93 of the C diet, P = 0.10). These effects were primarily due to a decrease in BCAA concentrations. Arterial Val concentrations were reduced with both diets (0.80 and 0.88 of the C diet for LN and LE, respectively, P = 0.01). In the LN diet, decreases in Leu (0.83 of the C diet, P < 0.01) and Ile (0.88 of the C diet, P < 0.05) were also noted. Despite no changes in arterial NEAA concentrations, increases in arterial Ala and Gly concentrations were observed with the LN diet (1.11 and 1.19 of the C diet, respectively, P < 0.05).
Net PDV fluxes of AAs
The NPA of TAA-N represented 0.60 to 0.77 of the apparently digested N in all three diets (Tables 1 and 4). As expected, the NPA of TAA-N in the LN diet was only 0.6 of the C diet (P < 0.01). The NPA of NEAA-N, EAA-N and BCAA-N were 0.45, 0.78 and 0.72 of the C diet, respectively (P < 0.05; Table 4). In the LE diet, the NPA of BCAA-N was 0.79 of the C diet (P < 0.05), but TAA-N, EAA-N or NEAA-N were not significantly affected. Overall, the values were numerically intermediate between LN and C, reflecting the unexpected reduction in N intake due to the lower than expected content of N in the maize (for details, see Savary-Auzeloux et al., Reference Savary-Auzeloux, Kraft, Bequette, Papet, Rémond and Ortigues-Marty2010).
With regard to specific AA, in addition to the reduction in the NPA of BCAA-N for both experimental diets, Lys and Thr net PDV release was decreased by the LN diet (0.42 and 0.55 of the C diet, P < 0.05). A reduction in the NPA of Ala, Pro and Ser was observed with both the LN diet (0.69, 0.59 and 0.70 of the C diet, respectively, P = 0.01) and the LE diet (0.79, 0.78 and 0.70 of the C diet, respectively, P < 0.05) diets. The LN diet also led to a decreased NPA of Asn (0.63 of C, P < 0.05) and Tyr (0.62 of C, P = 0.01), and a net disappearance of Glu (the net PDV flux was 0.55 mmol/h with C and −0.22 mmol/h with LN, P = 0.01). Lastly, we observed that the NPA of Gly was reduced with the LE diet only (0.42 of C, P < 0.05).
Net fluxes of AAs in liver and TSP
As blood flow in the hepatic artery and the hepatic vein was assumed to be 0.053 and 1.053, respectively, of the portal blood flow, the net fluxes in the liver and TSP are estimated values. With all the diets, a large proportion of TAA-N appearing in the portal vein was taken up by the liver (0.72 to 0.76) so that the net splanchnic release of TAA-N represented only 0.15 to 0.20 of the apparently digested N. It is noteworthy that the net splanchnic release of TAA-N was not different across diets (Table 4). This resulted from the net hepatic uptake of TAA-N in the LN diet being 0.61 of the C diet (P < 0.01). In the C diet, His and Phe net splanchnic appearances were below zero. This is also the case for some NEAA such as Ala, Cys, Gln, Gly and Tyr.
The N deficiency was accompanied by a reduction in the net hepatic uptake of EAA-N (0.7 of C, P < 0.05) and NEAA-N (0.54 of C, P < 0.01: Table 4). The energy deficiency tended (P = 0.10) towards a reduction (0.80 of C) in the net hepatic uptake of the EAA-N, which was not sufficient to alter that of theTAA-N.
The Met and Phe fluxes across the liver were the only EAA that responded to the dietary treatments (Table 4). The net hepatic uptake of Met was decreased with LN and LE relative to C (0.74 and 0.58, respectively, of C, P = 0.08 and 0.01, respectively) as a result of numerical decreases in its portal supply and hepatic fractional extraction ratio (Table 5). The net hepatic uptake of Phe was also decreased (0.75 and 0.80 of C, P < 0.05 for LN and LE), again following numerical decreases in its portal supply and hepatic fractional extraction ratio (P = 0.03 for LN).
Hepatic extraction ratioFootnote * expressed as a percentage of hepatic influx in growing lambs fed the C, LN or LE diets. The hepatic influx and net hepatic uptake are estimated data due to the utilization of a hepatic arterial blood flow of 5.3% of the portal blood flow

C = control; LN = N-deficient; LE = energy-deficient; TAA = total amino acids (AAs); EAA = essential AA; NEAA = non-essential AA; BCAA = branched-chain AA.
* Because blood flow in the hepatic artery and the hepatic vein were assumed to be 0.053 and 1.053 of the portal blood flow, respectively, the net fluxes in the liver and total splanchnic tissues are estimated values.
With regard to NEAA, the reduction in their net hepatic uptake observed with the LN diet was due to Ala (0.69 of C, P < 0.01), Asn (0.62 of C, P < 0.05), Gln (0.26 of C, P = 0.08), Ser (0.71 of C, P < 0.01) and Tyr (0.71 of C, P < 0.05). Glu net release in the LN diet was 1.55 of the C diet (P < 0.05). With the LE diet and despite the absence of significant changes in the hepatic uptake of overall NEAA, that of Ala, Ser and Tyr decreased (0.73 of C, P < 0.01; 0.75 of C, P < 0.01 and 0.77 of C, P = 0.07, respectively), whereas the uptake of Asp increased (0 mmol/h for the C diet and −0.12 mmol/h for the LE diet, P = 0.04). Lastly, and in contrast to what was observed for the LN diet, the net hepatic release of Glu in the LE tended to decrease (0.60 of the C diet, P < 0.10).
Consequently, at the splanchnic level, the LN diet induced (i) a lower net release of Ile, Leu and Val (0.65 to 0.69 of the C diet, P < 0.05), as well as lower net releases of Asp and Pro (0.62 and 0.51 of the C diet) as a result of lower portal absorption; and (ii) an increase in the net uptake of Gly (2.8 of the C, P = 0.05) resulting from non-significant changes at the PDV and liver levels. With the LE diet, the net splanchnic release of EAA was not altered relative to C, whereas that of some NEAA was decreased: Gly (because of a lower NPA), Asp (increased hepatic uptake) and Glu (lower hepatic release). Overall and across the three diets, the net gain in AA released to peripheral tissues was composed almost exclusively of EAA, whereas absorbed NEAA were almost totally utilised within TSP. Finally, we observed that the net splanchnic release of His was increased with the LN and LE diets (P < 0.05), following non-significant changes at the PDV and liver levels.
Discussion
The aim of this study was to induce an alteration of the NPA of AA and energy nutrients by altering the dietary supply of N and energy ratio in the diets. The consequences of these altered nutrient NPA on the net hepatic fluxes of AA were investigated. The nutritional model chosen was original in that the effects of dietary energy and protein imbalance have rarely been studied (Ferrell et al., Reference Ferrell, Kreikemeier and Freetly1999; Raggio et al., Reference Raggio, Lemosquet, Lobley, Rulquin and Lapierre2006), particularly in the same experiment. In addition, instead of supplementing diets with energy or protein, as in earlier studies (Ferrell et al., Reference Ferrell, Kreikemeier and Freetly1999 and Reference Ferrell, Freetly, Goetsch and Kreikemeier2001; Blouin et al., Reference Blouin, Bernier, Reynolds, Lobley, Dubreuil and Lapierre2002; Raggio et al., Reference Raggio, Pacheco, Berthiaume, Lobley, Pellerin, Allard, Dubreuil and Lapierre2004), we chose to induce a N or energy deficiency to create a requirement for nutrients in the peripheral tissues and the splanchnic area. This reduction in N or energy supply aimed at potentially modifying the nutrient (and particularly AA) partition between the splanchnic area and the peripheral tissues such as the muscle. However, a limit to our model was that the LE diet also showed a small but significant decrease in N supply (0.88 of the C diet) because the N content of the maize ingredient was lower than expected. Even so, the ratio of digested N to ME still differed (Table 1), and therefore the experimental aims were not invalidated. More importantly, the aim of this study was to substantially alter the NPA in nutrients and assess its impact on the net uptake of AA by the liver. With respect to net PDV nutrient release, a decreased TAA-N NPA was observed for the LN diets (0.60 of C), whereas total volatile fatty acids (VFAs) NPA was similar between the C and LN diets (187.4 and 186.4 mmol/h for C and LN, respectively, Savary-Auzeloux et al., Reference Savary-Auzeloux, Kraft, Dardevet, Rémond, Loncke and Ortigues-Marty2008b). In contrast, in the LE diet, the TAA-N portal appearance was not significantly decreased, whereas the total VFA NPA was decreased (0.72 of C, Savary-Auzeloux et al., Reference Savary-Auzeloux, Kraft, Dardevet, Rémond, Loncke and Ortigues-Marty2008b).
N balance
A striking result of this study was that the same N retention was obtained with two diets (C and LN) despite differences in the amount of digested N. However, a deficiency in energy supply caused decreased N retention without significantly decreasing digested N (intermediate between C and LN). Thus, the animals’ N balance did not respond as predicted by the INRA feeding system (Jarrige, Reference Jarrige1989). Indeed, the N supply in the LN diet should allow a growth of 50 to 100 g/day in our animals, whereas the energy supply allowed a growth of 200 to 250 g/day as for the C diet. This implies either that the safety margin allowed for in the INRA recommended allowances overestimates the N requirements of growing sheep or that some ‘N’-sparing mechanisms are at work with the LN diet. The INRA system would appear to be a reliable predictor of growth, however, because the expected growth for the C diet (250 g/day) was attained (Table 1). Similarly, the INRA feeding system also predicted a reduced growth and N balance in sheep fed the LE diet, and this was observed in this study (Table 1).
The current data suggest, therefore, that an alteration of the N metabolism to lowered nutrient supply occurs, but the magnitude differs whether either N or energy is supplied at 0.80 of the INRA recommendations. In dairy cows fed below maximal levels of metabolisable protein, only a small decrease in milk protein output was observed due to a more efficient use of absorbed AA (Castillo et al., Reference Castillo, Kebreab, Beever, Barbi, Sutton, Kirby and France2001; Raggio et al., Reference Raggio, Pacheco, Berthiaume, Lobley, Pellerin, Allard, Dubreuil and Lapierre2004). When feed energy supply is deficient; however, additional energy to support anabolism may be provided by two alternative processes: mobilisation of fat stores (Chowdhury and Orskov, Reference Chowdhury and Orskov1997) and/or use of nutrients supplied in relative excess (e.g. AA). This latter possibility is in line with the high urea-N excretion in urine observed in the LE diet, in which the AA carbons may be utilised for glucose synthesis and N from AA excreted as urea. Alternatively, the increased urea excretion may result from restricted AA uptake by peripheral tissues when energy was limited (Harris et al., Reference Harris, Skene, Buchan, Milne, Calder, Anderson, Connell and Lobley1992), with the resultant aminoacidaemia triggering hepatic ureagenesis (Black and Griffiths, Reference Black and Griffiths1975).
The processes underlying these changes in N metabolism observed in the LN and LE diets are therefore complex, and suggest a shift in the subtle equilibrium in the utilisation of nutrients between the tissues and organs. They raise the issue of the interactions that occur between nutrient supply and requirement (Oldham, Reference Oldham1984) and the plasticity of the splanchnic tissues and the muscles towards AA net utilisation.
Is NPA driven by N supply?
As N intake decreased, so did the TAA-N NPA, as shown by the TAA-N NPA in the LN diet being 0.6 of the C diet. Similar responses of the TAA-N NPA to N intake were observed in growing beef steers at different levels of intake (Lapierre et al., Reference Lapierre, Bernier, Dubreuil, Reynolds, Farmer, Ouellet and Lobley2000), in dairy cows fed different levels of N (Bach et al., Reference Bach, Huntington, Calsamiglia and Stern2000; Blouin et al., Reference Blouin, Bernier, Reynolds, Lobley, Dubreuil and Lapierre2002; Raggio et al., Reference Raggio, Pacheco, Berthiaume, Lobley, Pellerin, Allard, Dubreuil and Lapierre2004) and in sheep with abomasal infusion of different levels of casein (El-Kadi et al., Reference El-Kadi, Baldwin, Sunny, Owens and Bequette2006). Thus, with regard to TAA-N, the NPA seemed to be driven by AA-N absorbed by the small intestine as modelled by Lapierre et al. (Reference Lapierre, Vernet, Martineau, Sauvant, Nozière and Ortigues-Marty2007).
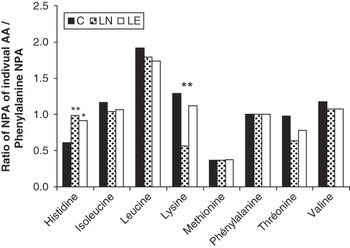
In terms of anabolic potential, there are two aspects of AA supply that need to be considered: the total amount of AA supplied and the relative pattern of supply. Deficiency (or excess) of a single AA can distort the overall apparent efficiency of utilisation of all AA. With regard to the EAA, a potential alteration of the profile of the AA supplied to the liver was assessed by the calculation of the relative contribution of each individual AA NPA relative to Phe NPA (Figure 1). Phe was chosen as a reference because, among the EAAs, Phe is in the ‘average’ with regard to the portal net release relative to the quantities absorbed (Hanigan, Reference Hanigan2005; Lys seems to be poorly used by the PDV, whereas Trp and Thr are extensively used). Other AAs such as Leu and Met are known to be oxidised within the PDV but not Phe (at least arterial Phe, Lobley et al., Reference Lobley, Shen, Le, Bremner, Milne, Calder, Anderson and Dennison2003). Only the ratios of His (in LN and LE diets) and Lys (in LE diet) NPA to Phe NPA were significantly altered relative to the C diet. The profile of the other EAA NPA remained constant, irrespective of the diet considered. The decreased His/Phe NPA in the C diet relative to the LN and LE diets is difficult to explain. Comparable (low) values for His fluxes have already been described in other studies (Lapierre et al., Reference Lapierre, Bernier, Dubreuil, Reynolds, Farmer, Ouellet and Lobley2000). However, the decreased Lys NPA relative to Phe observed in the LN diet can be explained by a decreased contribution of AA supplied by the microflora (Lys is present in large amounts in ruminal flora (0.08 of the TAA and 0.20 of the EAA; Storm and Orskov, Reference Storm and Orskov1983) or a decreased supply of undegraded Lys from the diet.
Net portal appearance (NPA) of individual amino acids compared with phenylalanine NPA in growing lambs fed control (C), nitrogen-deficient (LN) or energy-deficient (LE) diets. Ratios for LN and LE were compared with the C ratio: * is different from C as a tendency (P < 0.10) and ** is significantly different from C (P < 0.05).

In conclusion, in this study, the decreased NPA of TAA-N observed was especially driven by the N supply in the diet and no marked modifications of the digestive tract’s efficiency for AA utilisation during the lower N or energy supply have been shown.
Net liver balance
Hepatic blood flow
In order to limit the quantity of blood withdrawn from the three vessels of our animals, a decision was made to use a flow probe around the portal vein instead of the marker (e.g. para-amino hippuric acid (PAH)) dilution technique for the measurement of PDV and hepatic blood flows. The principal criticism of this choice is that the hepatic arterial blood flow could not be measured (the liver is irrigated by a network of several arteries in sheep, and therefore no probe can be inserted). In this study, the hepatic arterial blood flow has been estimated as a proportion of the portal blood flow (0.053; Barnes et al., Reference Barnes, Comline and Dobson1986). This percentage is consistent with previous data observed in sheep (0.02 to 0.063, Lobley et al., Reference Lobley, Connell, Lomax, Brown, Milne, Calder and Farningham1995; 0.053 to 0.083, Milano et al., Reference Milano, Hotston-Moore and Lobley2000), but lower to other data obtained in ovine and bovine species (Reynolds, Reference Reynolds2006). However, the recalculations of the net hepatic and splanchnic fluxes using a hepatic arterial blood flow contribution of 0.10 (instead of 0.053) led to no modification of the net hepatic Phe fluxes in the C, LN and LE diets and an alteration of <0.04 in the net splanchnic Phe fluxes in the same three diets (data not shown). In addition, an absence of significant changes in the contribution of the hepatic arterial to total venous blood flow with intake has been previously shown (Vernet et al., Reference Vernet, Nozière, Sauvant, Leger and Ortigues-Marty2005). Lastly, results from Ortigues-Marty et al. (Reference Ortigues-Marty, Durand and Lefaivre1994) and Huntington (Reference Huntington1982) have shown that the portal and hepatic blood flows can be measured with a relative standard deviation (r.s.d.) of 11% and 16% to 32%, respectively, using the marker dilution technique. The hepatic arterial blood flows calculated by difference are then assessed with an 80% r.s.d. using the dilution technique, whereas the blood flow measured with flow probes is more accurate (5% r.s.d.). Therefore, and keeping in mind the constraints of this experiment (limitation of blood withdrawal in small animals), it can be considered that the estimated data on hepatic venous blood flow obtained using the flow probes and hepatic arterial blood flow estimation were not necessarily worse than the ones that could have been obtained using PAH.
However, and as the hepatic venous blood flow was estimated, the net hepatic and splanchnic nutrient fluxes are reported as estimated data in this study. This is clearly stated in Tables 4, 5 and 6 and must be kept in mind for the interpretation of the data of splanchnic and hepatic net fluxes.
Overall TAA-N
Similar to the PDV, the liver also responded to the TAA-N supply. The net fractional hepatic TAA-N uptake remained constant regardless of the diet (0.72 to 0.76 of the net PDV release; Table 4). This result is similar to earlier studies in steers in which the level of intake was above maintenance (Lapierre et al., Reference Lapierre, Bernier, Dubreuil, Reynolds, Farmer, Ouellet and Lobley2000) or in which AAs were infused in the mesenteric vein of sheep (Lobley et al., Reference Lobley, Connell, Revell, Bequette, Brown and Calder1996) or N supplemented in sheep (Krehbiel and Ferrell, Reference Krehbiel and Ferrell1999). Whether the response in net hepatic extraction of TAA is linearly correlated to the TAA-N inflow to the liver or to the net PDV uptake remains a matter of debate (Blouin et al., Reference Blouin, Bernier, Reynolds, Lobley, Dubreuil and Lapierre2002; Lobley et al., Reference Lobley, Shen, Le, Bremner, Milne, Calder, Anderson and Dennison2003). However, the proportion of TAA-N NPA removed by the liver could be altered when metabolisable protein supplementation is associated with a high demand for AA by the tissues (Blouin et al., Reference Blouin, Bernier, Reynolds, Lobley, Dubreuil and Lapierre2002), when the requirements of the peripheral tissues were increased by lactation (Reynolds, Reference Reynolds2006) or by somatotropin infusion (Bruckental et al., Reference Bruckental, Huntington, Baer and Erdman1997). The AA demand by the peripheral tissues in this study may not be strong enough to alter substantially the proportion of TAA-N NPA removed by the liver.
The decreased hepatic extraction ratio of TAA-N (relative to hepatic influx) observed with the LN diet (Table 5) tended to show a specific regulation of liver metabolism towards a relative ‘AA-N-sparing’ mechanism compared with C and LE. The NEAA-N may have been involved in the process, considering the decreased hepatic extraction ratio of the NEAA-N relative to hepatic influx (Table 5).
The hepatic extraction ratio of TAA-N, NEAA-N, EAA-N and BCAA-N relative to hepatic influx was not modified with the LE diet (Table 5). However, the net hepatic uptake of NEAA was not different between C and LE, whereas it tended to decrease for EAA (0.80 of C). This alteration of net uptake and/or the extraction ratio observed may be explained by the various fates of AA within the liver, not only catabolism and ureagenesis but also protein synthesis (export and endogenous; Connell et al., Reference Connell, Calder, Anderson and Lobley1997), protein breakdown (Attaix et al., Reference Attaix, Rémond and Savary-Auzeloux2005), gluconeogenesis (Reynolds, Reference Reynolds1992) and synthesis of specific substances such as glutathione and hippurate.
Specific AA
Protein synthesis
The net EAA-N uptake by the liver was decreased with both the LN and LE diets. Specifically, the hepatic uptake of Phe and Met was decreased with both the LN and LE diets (Table 4). A decreased net uptake in all the EAA may reflect either a decreased synthesis of endogenous proteins or of export proteins (rich in Phe and Met; Ruot, Reference Ruot2001), an increased endogenous protein breakdown or a decreased oxidation. In this experiment, total export proteins were also measured (after [1-13C] leucine infusion) on the same animals (Savary-Auzeloux et al., Reference Savary-Auzeloux, Kraft and Ortigues-Marty2007 and Reference Savary-Auzeloux, Kraft, Bequette, Papet, Rémond and Ortigues-Marty2010). Both fractional and absolute export protein synthesis were decreased in the LE diet but not in the LN diet (Savary-Auzeloux et al., Reference Savary-Auzeloux, Kraft, Bequette, Papet, Rémond and Ortigues-Marty2010). Using the relative proportion of these two AA in export proteins (Lobley and Milano, Reference Lobley and Milano1997), 15% to 20% of Phe net hepatic uptake and about 10% of Met net hepatic uptake could be attributed to export protein synthesis. Thus, the decreased export protein synthesis in the liver can explain, at least partially, the decreased EAA-N uptake in the LE diet, whereas other regulatory mechanisms must be involved to explain the decreased uptake in the LN diet. The most probable mechanisms are an alteration of oxidation and ureagenesis in the latter case, although hepatic endogenous protein breakdown cannot be excluded.
Ureagenesis and catabolism of AA
The LN diet induced a reduction in urea-N net liver release (0.63 of C and LE). Owing to the technical difficulties in ammonia-N determination, it is impossible to determine whether this reduction was due to a reduced ammonia-N net release by the PDV or to a reduction in AA catabolism. The reduced AA NPA and hepatic extraction ratio for Phe suggests a decreased AA catabolism as no alteration of export protein synthesis could be shown. A similar result was reported for lactating cows in which Phe oxidation was reduced as metabolisable protein supply was decreased (Raggio et al., Reference Raggio, Pacheco, Berthiaume, Lobley, Pellerin, Allard, Dubreuil and Lapierre2004). The hepatic uptake of NEAA (i.e. Ala, Ser, Asn, Gln and Tyr) was particularly reduced with the LN diet (0.57 of C), and this would contribute to the lowered ureagenesis. Indeed, the need to dispose of less NEAA-N would reduce urea production by 2.4 gN/day, or approximately 0.80 of the reduction observed. The increased release of Glu and decreased uptake of Asn, both of which participate in Asp synthesis, also supports the hypothesis that ureagenesis was decreased. Ala and, to a lesser extent, Ser presented a lower net hepatic uptake and are both well-known as gluconeogenic precursors in sheep (Wolff and Bergman, Reference Wolff and Bergman1972), which suggests a decreased gluconeogenesis from Ala and Ser with the LN diet.
The LE diet differed from the LN diet in that neither the hepatic ureagenesis nor the NEAA net liver uptake was decreased. The sustained ureagenesis may be partly due to ammonia detoxification and to the catabolism of AA. Asp and Glu, which are both involved in the urea cycle, were utilised more by the liver in the LE diet (presumably for ureagenesis). However, Ala and Ser, whose net uptake by the liver was decreased, did not fit this pattern.
Both the LN and LE diets led to a decreased TAA-N net hepatic uptake due to (i) for the LE diet, a reduced utilisation of EAA by the liver (Table 4) via a reduction of export protein synthesis (Savary-Auzeloux et al., Reference Savary-Auzeloux, Kraft and Ortigues-Marty2007 and Reference Savary-Auzeloux, Kraft, Bequette, Papet, Rémond and Ortigues-Marty2010) associated with a sustained ureagenesis (and probably AA catabolism); and (ii) for the LN diet, a specific reduction in the utilisation of NEAA and Phe by the liver linked to a reduced ureagenesis via a possible decreased utilisation of carbon chains from AA (in particular, Ala and Ser).
Net splanchnic appearance compared with N retention
The splanchnic appearance of TAA-N was similar in all three diets. Differences in the release of NEAA/EAA can be explained in the light of the requirement for total AA and specific AA in the peripheral tissues calculated from the N balances measured in the same animals.
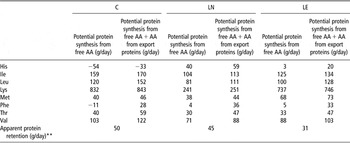
First, net splanchnic flux of NEAA-N was not significantly different from zero. Thus, almost exclusively, EAA-N net splanchnic flux accounted for N retention and catabolism at the peripheral level. Each free EAA-N released by the TSP was expressed as a protein equivalent. These data were compared with the overall protein retention calculated using the N balances measured in the same animals (Table 6). To carry out these calculations, we used the mean AA composition of the lamb carcass published by MacRae et al. (Reference MacRae, Bruce, Brown, Farningham and Franklin1997). BCAA and Lys were released in excess of the requirement for protein synthesis (Table 6). These results are consistent with the data obtained in dairy cows (Blouin et al., Reference Blouin, Bernier, Reynolds, Lobley, Dubreuil and Lapierre2002; Raggio et al., Reference Raggio, Pacheco, Berthiaume, Lobley, Pellerin, Allard, Dubreuil and Lapierre2004) and suggest that these AAs are utilised (and oxidised; Argiles et al., Reference Argiles, Busquets and Lopez-Soriano2001) elsewhere in the body (such as muscle in our case or the udder and muscle in lactating cows).
Net splanchnic free-EAA appearanceFootnote * calculated as an ‘equivalent’ protein synthetic potential within the carcass (using mean AA composition of lamb carcass from MacRae et al. (Reference MacRae, Bruce, Brown, Farningham and Franklin1997; g/day) for growing lambs fed the C, LN and LE diets. A similar calculation was made using the AA present in the export proteins (Ruot, Reference Ruot2001) and the values obtained were added to the values of potential protein synthesis calculated from free AA

EAA = essential amino acid (AA); C = control; LN = N-deficient; LE = energy-deficient.
* Because blood flow in the hepatic artery and the hepatic vein were assumed to be 0.053 and 1.053 of the portal blood flow, respectively, the net fluxes in the liver and total splanchnic tissues are estimated values.
** The apparent protein retention is calculated as N balance × 6.25 measured. For each AA, the concentration of each was converted to grams of N.
However, His and Phe net splanchnic release were below the requirements calculated to sustain anabolism. This is inconsistent with other data on lactating cows in which the post-splanchnic supply of His and Phe matched the amounts secreted in milk proteins (Blouin et al., Reference Blouin, Bernier, Reynolds, Lobley, Dubreuil and Lapierre2002; Lobley and Lapierre, Reference Lobley and Lapierre2003). For His, as also shown in pigs (Heger et al., Reference Heger, Patras, Nitrayova, Dolesova and Sommer2007), the important stores of carnosine within the muscles (Savary-Auzeloux et al., Reference Savary-Auzeloux, Durand, Gruffat, Bauchard and Ortigues-Marty2008a) can be an alternative supply of His, but these have not been taken into account in the calculations of Table 6. With regard to Phe, another potential source for this AA can be liver export proteins. Indeed, export proteins may be degraded by the muscle (Maxwell et al., Reference Maxwell, Terracio, Borg, Baynes and Thorpe1990), and albumin is hypothesised to be an alternative form of AA supply to the muscle (Volpi et al., Reference Volpi, Lucidi, Cruciani, Monacchia, Reboldi, Brunetti, Bolli and De Feo1996). Consequently, the potential protein gain from export proteins-AA plus net TSP release of free AA has then been calculated using the absolute synthesis rate of plasma proteins measured in the same study (Savary-Auzeloux et al., Reference Savary-Auzeloux, Kraft, Bequette, Papet, Rémond and Ortigues-Marty2010; 14.0, 12.8 and 11.2 g/day for the C, LN and LE diets, respectively) and the AA composition of export proteins (Ruot, Reference Ruot2001; Table 6). When AAs from export proteins are taken into account, the potential protein gain from Phe is much closer to the apparent protein retention in the three diets. Hence, and in contrast to other studies on dairy cows (Blouin et al., Reference Blouin, Bernier, Reynolds, Lobley, Dubreuil and Lapierre2002; Raggio et al., Reference Raggio, Pacheco, Berthiaume, Lobley, Pellerin, Allard, Dubreuil and Lapierre2004) in which it has been shown that plasma-free AA were sufficient to support mammary gland uptake and requirement for Phe and His, protein-bound AA may represent a substantial supply of AA available for the peripheral tissues in growing animals.
Finally, the net TSP release of AA either in free form or combined with that from export protein was not significantly different between the LE and LN diets. Despite this, the N retention was lower, and consequently the AA supply to the muscle alone was not sufficient to determine growth; rather, it is probable that the decreased energy supply with the LE diet may have limited anabolic mechanisms in peripheral tissues. This may have been exacerbated by the utilisation of NEAA carbon across the liver as a precursor for gluconeogenesis. The gluconeogenic needs of the sheep on the LE diet may have directed certain AA towards the liver and limited the utilisation of AA for protein anabolism.
Conclusion
In the case of a decreased NPA of AA (LN diet), AA-N sparing mechanisms occurred at the whole body and hepatic levels. They may have two possible origins within the liver: (i) a decreased oxidation of NEAA (linked to neoglucogenesis and assumed from ureagenesis) by the liver; and (ii) a sustained hepatic export protein synthesis that preserves the AA from oxidation processes. Consequently, free AA and protein-bound AA may jointly sustain protein anabolism in the peripheral tissues in which energy is not limiting. In contrast, in case of a reduction in energy supply (associated, in our study, with a decreased DMI supply) and propionate NPA (Savary-Auzeloux et al., Reference Savary-Auzeloux, Kraft, Dardevet, Rémond, Loncke and Ortigues-Marty2008b), the AA were not used for anabolic purposes and were oxidised. In the liver, a decreased export protein synthesis associated with a sustained ureagenesis jointly decreased the overall AA available for anabolism in the peripheral tissues. In addition, energy being limiting, the anabolic processes themselves (as already shown in the liver) may be diminished.
Acknowledgements
The authors thank P. Gaydier for his excellent help with surgical preparations and animal care. Special thanks go to C. Cossoul for mass spectrometry and sampling of animal. The authors also thank A. S. Bage for invaluable technical support and A. G. Calder, Rowett Research Institute (UK), for help with isotopic enrichment adjustments. Roquette Freres Corporation (Lestrem, France) is thanked for the supply of starch and gluten meal used in this study. Lastly, the authors thank G. Lobley for his invaluable help and support for the critical review of the manuscript. This study was supported by the INRA Research Institute. G. Kraft received a doctoral scholarship from ‘Region Auvergne’ and INRA. As the entire study was funded by INRA, there is no conflict of interest. I. Ortigues-Marty and I. Savary-Auzeloux had the initial idea for the study, and were responsible for experimental management, and critically reviewed the manuscript for scientific content. T. Jarde was responsible for the analysis of some data. G. Kraft and, to a lesser extent, I. Savary-Auzeloux were responsible for the data analysis, interpretation, statistical analysis and write-up. B. Bequette contributed to the data analysis and a critical review of the manuscript. D. Durand and D. Rémond were responsible for the surgery, and contributed to the critical review of the manuscript.