I. INTRODUCTION
Nanocrystalline (nc) materials have been a source of great interest currently because of their unusual mechanical and physical properties.Reference Meyers, Mishra and Benson1–Reference Liu, Zhou and Ling8 In general, nc materials show superior strength but low tensile ductility and low fracture toughness, which limit their applications.Reference Meyers, Mishra and Benson1, Reference Kumar, Suresh and Van Swygenhoven3, Reference Koch4, Reference Dao, Lu, Asaro, De Hosson and Ma6, Reference Jiang and Weng9, Reference Ovid’ko10
Although many experiments have been performed to study the fracture toughness of nc materials, the theoretical and quantitative descriptions about this issue are very limited. In nc materials, the conventional toughening associated with the lattice slip is suppressed. It has been proposed that the alternative deformation modes, such as grain boundary (GB) sliding, GB diffusional creep, stress-driven GB migration, twin and rotation deformation, can play an important role in the toughening of nc materials. This is in agreement with experimental data showing the enhancement of fracture toughness of several nc ceramics,Reference Kuntz, Zhan and Mukherjee11–Reference Pei, Galvan and De Hosson13 nc copper,Reference Singh, Tang, Dao, Lu and Suresh14, Reference Singh, Tang, Dao, Lu and Suresh15 and nc nickelReference Mirshams, Whang, Xiao and Yin16 compared to those of their microcrystalline counterparts. These experimental results serve as the basis of theoretical mechanisms hampering crack growth in nc materials. In particular, recently, nanoscale twin deformation carried by partial dislocations emitted from GBsReference Gutkin and Ovid’ko17 has been theoretically revealed to be the specific toughening mechanism in nc ceramics and metals. In addition, Bobylev et al.Reference Bobylev, Mukherjee, Ovid’ko and Sheinerman18 built a theoretical model to describe the effects of GB sliding (GBS) on the crack growth in nc metals and ceramics. Within their model, the GBS in nc materials results in crack blunting which, in its turn, leads to an increase (by a factor ranging from 1.1 to around 3, depending on temperature) of fracture toughness. Ovid’ko and SheinermanReference Ovid’ko and Sheinerman19 have studied the combined effects of GBs and blunting of cracks on the fracture toughness of nc and ultrafine grained materials. They found that nc metals exhibit a ductile-to-brittle transition with decreased grain size. Liu et al.Reference Liu, Zhou, Wang, Zhang and Wang20 developed a model to study the combined effects of GBS and emission of edge dislocations from crack tip on the toughness of nc materials. Bobylev et al.Reference Bobylev, Morozov and Ovid’ko21 suggested a new physical mechanism of plastic deformation in nc metals and ceramics to study the cooperative GBS and stress-driven GB migration process. It was theoretically revealed that the new deformation mode was more energetically favorable than “pure” GBS and enhances the ductility of nc solids in wide ranges of their structural parameters. Morozov et al.Reference Morozov, Ovid’ko, Sheinerman and Aifantis22 developed a theoretical model to describe the effect of special rotational deformation on crack growth in deformed nc ceramics and metals. The special rotational deformation releases, in part, local stresses near the crack tip, thus serving as a toughening mechanism in nc materials. Creep deformation conducted by GB processes was also suggested as a toughening mechanism providing crack blunting (at grain size scales of 10 nm or more) in nc metals.Reference Yang and Wang23, Reference Yang and Yang24
During the last few decades, cohesive model of fracture has gradually evolved as an attractive tool to model crack initiation and propagation. NeedlemanReference Needleman25 developed a cohesive model to describe void formation from initial particle debonding through complete separation to subsequent void growth. By reproducing a number of experimentally observed trends for elastic–plastic fracture in homogeneous and bimaterials systems, Tvergaard and HutchinsonReference Tvergaard and Hutchinson26–Reference Tvergaard and Hutchinson28 further increased the attractiveness of cohesive models. More recently, cohesive models of fracture have been increasingly used to study crack propagation in the condition that the plasticity is accounted for by modeling individual discrete dislocations. For instance, Cleveringa et al.Reference Cleveringa, van der Giessen and Needleman29 reported that the simulated mode-I fracture toughness of a homogeneous elastic–plastic solid increases with increasing the number of dislocations. O’Day and CurtinReference O’Day and Curtin30 have found that the bimaterial interfacial toughness increases with increasing mode mixity. Chng et al.Reference Chng, O’Day, Curtin, Tay and Lim31 studied crack growth in a metal layer confined between two brittle media and reproduced experimentally observed trends in fracture toughness with respect to the thickness and residual stresses of the layer. Broedling et al.Reference Broedling, Hartmaier and Gao32, Reference Broedling, Hartmaier and Gao33 also studied the fracture toughness of a confined metal layer. Bhandakkar et al.Reference Bhandakkar, Chng, Curtin and Gao34 studied the dislocation shielding of a cohesive crack; they have shown a surprising result: while the classical singular crack model predicts that, depending on the sign of the Burgers vector, a dislocation shields or antishields a crack, at low cohesive strengths a dislocation always shields a crack irrespective of the Burgers vector. The discrete dislocation–cohesive zone models suggested by Deshpande et al.Reference Deshpande, Needleman and van der Giessen35, Reference Deshpande, Needleman and van der Giessen36 are well consistent with experimental observations.
As can be seen from the above literatures, most of the cohesive zone models are used to study the fracture of coarse grained materials rather than nc materials. The present article is aimed at studying the fracture toughness of nc materials by using a combined dislocation–cohesive zone model.
II. DISLOCATIONS-COHESIVE MODEL
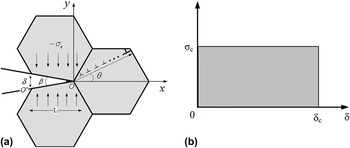
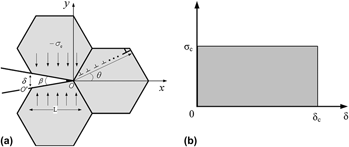
In this article, we will focus on the dislocation shielding on a DugdaleReference Dugdale37 cohesive crack under mode-I dominant conditions (Fig. 1). The crack lies at the interface of two adjacent grains with the crack tip intersecting the GB of the third grain. The rectangular cohesive law of Dugdale, as shown in Fig. 1(b), is assumed to govern the traction within the cohesive zone OO′ of length L. The origin of the (x, y) coordinate system (point O) is located at the tip of the cohesive zone. With increased external load, N edge dislocations will emit from the crack tip, and it is assumed that the emitted dislocation is retarded at the opposite GB, as shown in Fig. 1(a).
(a) A Dugdale cohesive crack, subjected to a remote mode-I loading, lies at the interface of two adjacent grains with the crack tip intersecting the grain boundary (GB) of the third grain. N edge dislocations with Burgers vectors b emit from the crack tip and slip to the opposite GB, and the crack tip cohesive zone size is L. The cohesive zone starts at O′ where the crack-opening displacement is calculated. (b) Dugdale’s (rectangular) cohesive law with cohesive strength σc and critical displacement δc.

The stress intensity factor K IC at O is calculated as

where  is the intensity factor for the cohesive stress σ c, and
 and
 are, respectively, the intensity factors for the normal (to the crack line) and shear stresses created by the generated dislocations. The mode-I stress intensity factor for a semi-infinite crack subjected to a distribution of normal traction p(x) along the crack surfacesReference Bhandakkar, Chng, Curtin and Gao34 is
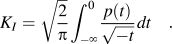
In the Dugdale model, the cohesive traction is p c(t) = −σ c for −L ≤ t≤ 0 and vanishes over the rest of the crack faces, as shown in Fig. 1(b). The corresponding stress intensity factor at point O isReference Deshpande, Needleman and van der Giessen36
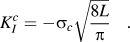
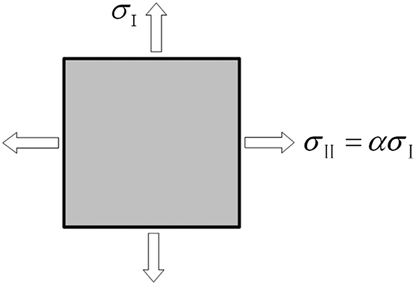
Note that in the Dugdale model, the cohesive stress σ c is equal to the yield strength σ y. However, all other cohesive zone models suggest that in the traction–separation process, the cohesive stress varies with the opening displacement, and there exists a maximum cohesive stress σ max, with value being a few times of the yield strength σ yReference Chandra, Li, Shet and Ghonem38 In the present article, we will use Eq. (4), which provides a relation between the cohesive stress σ max and the yield strength σ yReference Scheider, Rajendran and Banerjee39

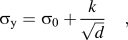
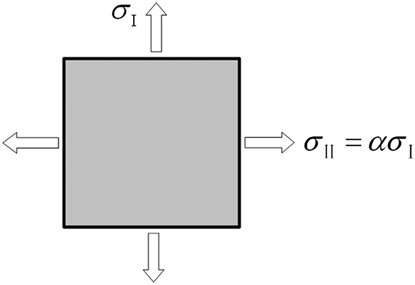
where α = σ II/σ I is the biaxiality ratio that defines the stress triaxiality, which is shown in Fig. 2. H 0 is set to a constant value of 0.5, an average value chosen to represent the equivalent plastic strain failure locus for lower triaxilities encountered in plane stress, and C is a material dependent nondimensional parameter. σ y can be obtained by the well-known Hall–Petch relationship:
Schematic of biaxiality ratio, α, under conditions of plane stress.
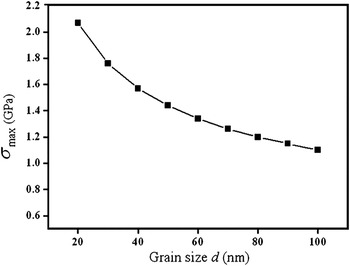
where σ 0 is the lattice friction stress, k is the H–P constant, and d is the grain size. It should be noted that (i) many nc materials do not obey the Hall–Petch relation when the grain size decreases to a critical value (3–20 nm)Reference Chokshi, Rosen, Karch and Gleiter40–Reference Palumbo, Erb and Aust43; therefore, in this article, we will not consider the nc materials with a grain size below 20 nm, and (ii) we assume that the crack tip curvature radius ρ = 0, and it can be seen from Fig. 1(a) that in the cohesive zone, the maximum opening displacement δ c= Lβ, where β is the crack tip opening angle. In general, 1 nm ≤ δ c ≤ 10 nm in the cohesive modelsReference Chandra, Li, Shet and Ghonem38; thus, in the present article, we fix the cohesive zone L ≤ 100 nm, and the suggested model is questionable for the solids with grain sizes that exceed a hundred nanometers. By putting σ 0 = 25 MPa and k = 0.11 × 10⁶ for nc copper into Eq. (4), we obtained the dependence of σ max on grain size d for nc copper, as shown in Fig. 3.
Dependence of critical cohesive stress σmax on grain size d.

Next, we will calculate the stress intensity factors  and
 . In doing so, as shown in Fig. 1(a), θ is the angle made by the boundary plane (the dislocation Burgers vector) and the crack propagating direction. The stress intensity factors
 and
 for the dislocation-induced stresses can be calculated byReference Zhang and Li44
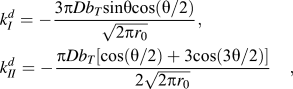
where D = G /[2(1 − v)], G is the shear modulus; b T = Nb is the sum of all the emitted dislocations; b = 0.256 nm denotes the Burgers vector magnitude of the edge dislocation; v is the Poisson’s ratio; and r 0 is the distance between the edge dislocation and the crack tip.
Let us calculate N—the number of dislocations emitted from a crack tip and retarded at the opposite GBs. In the quasi-equilibrium state, the Burgers vector magnitude Nb corresponds to a minimum of the energy change ΔW within the dislocation generation process (Fig. 1). ΔW has three terms:

where W s is the proper elastic energy of the dislocation, W c is the dislocation core energy, and A denotes the work spent to the generation of dislocations and the movement of dislocation from the crack tip to its final position.
Since the dislocation is located near the crack free surface, its stresses are screened. The proper energy of the dislocation can be calculated, with the aid of the formula taking into account the image forces that characterizes the screening effect,Reference Lin and Thomson45 as
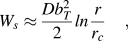
where r c is the dislocation core radius. The dislocation core energy W c under the standard approximation is given asReference Ovid’ko and Sheinerman19

The work A spent on generation of the dislocation and the movement of the dislocation from the crack tip to its final position is calculated in the standard way. The work A is represented in the following form:
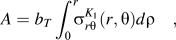
here  , written in the polar coordinate system (r, θ) with the origin at the crack tip, can be given by

According to Eqs. (10) and (11), one will obtain
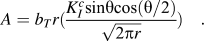
Then, with Eqs. (8)–(12), we obtain the following formula for the characteristic energy change ΔW

With the condition ∂(ΔW) / ∂b T = 0 of the minimum of the energy change ΔW, one find the following expression for the number of emitted dislocations:

In our work, it is assumed that all the emitted dislocations will reach the opposite GBs; that is, each dislocation will slip the same distance, which equals to the grain size d.
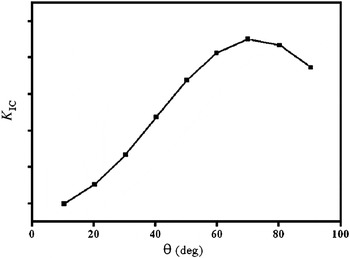
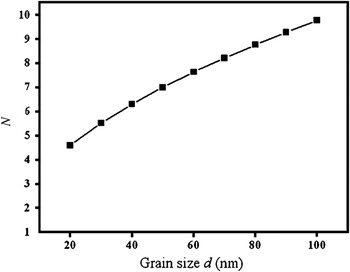
In our previous article,Reference Liu, Zhou, Wang, Zhang and Wang20 we have calculated the critical crack intensity factor K IC as a function of θ for nc Ni, as shown in Fig. 4. It can be seen from Fig. 4 that the critical intensity factor K IC reaches the maximum value when the boundary plane makes the angle θ of around 70° with the direction of crack growth. By putting θ = 70°, we obtained the relationship between N and d for nc copper, which is shown in Fig. 5. It shows that N increases with increasing the grain size. It should be noted that the value of N is relatively small, dislocation emission along one slip plane cannot lead to a significant crack blunting, and the crack can easily grow. This is a reason why the nc materials have relatively low fracture toughness. Generally speaking, in the case of d < 20 nm, one should take into account GBS,Reference Bobylev, Mukherjee, Ovid’ko and Sheinerman18 diffusional creep,Reference Ovid’ko46 rotational deformation,Reference Liu, Zhou, Shen and Hui47 and nanoscale twin deformationReference Singh, Tang, Dao, Lu and Suresh14, Reference Singh, Tang, Dao, Lu and Suresh15 effectively operating in nc materials that contribute to the blunting of cracks and increase strain-to-failure. This is another reason why our model is not suitable for nc materials with grain size below 20 nm.
Dependence of critical crack intensity factor K IC on the angle θ made by the boundary plane and the crack growth direction for nanocrystalline (nc) nickel.

The maximum number N of edge dislocations that can be emitted from the crack tip along one slip plane as a function of grain size d in nc copper.

III. RESULTS AND DISCUSSION
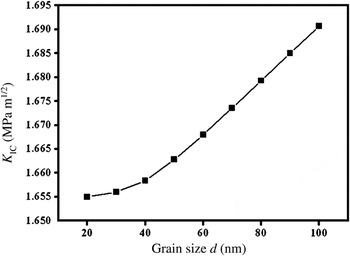
With Eqs. (6) and (3) substituted to Eq. (1), one will obtain the relationship between the fracture toughness and the grain size. Figure 6 shows our calculating result, which demonstrates that a decrease in grain size dramatically decreases K IC and thus makes the nc materials much more brittle. This is in agreement with the experimental fact that some nc metals with a face-centered-cubic lattice exhibit a ductile-to-brittle transition when their grain size is decreased.Reference Li and Ebrahimi48–Reference Ebrahimi, Liscano, Kong, Zhai and Li50
Critical stress intensity factor K IC versus grain size d in nc copper.

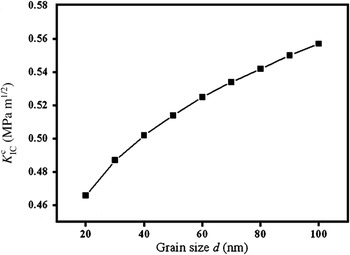
We will make a further analysis of K IC expressed in Eq. (1) by considering two cases: in case 1, we neglect the shielding effect of the dislocations, and we can obtain the dependence of critical crack intensity factor  on grain size d by using Eq. (3). The results, as shown in Fig. 7, suggest that
 increases with increased grain size d. This is untreatable since the cohesive stress σmax has been reduced and the cohesive zone size L becomes larger, which results an increase of
 . In case 2, we only consider the shielding effect of dislocation and define

Dependence of critical crack intensity factor  on grain size d in nc copper.

where  is the critical intensity factor induced by dislocations. The dependence of
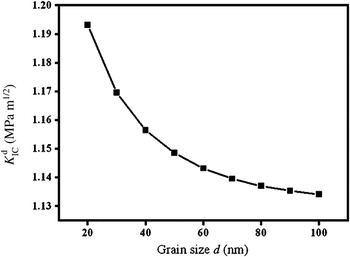
 for various grain sizes d, is shown in Fig. 8. As can be seen in this figure,
 decreases with increased grain size d. This can be explained by the following reasons: though the number of dislocations that emit from the crack tip increases with increased grain size, the slip distance (being equal to grain size in this article) of each emitted dislocation increases and leads to a decrease of
 . Comparing
 with
 , we know that
 mainly provides the fracture toughness, whereas
 is mainly responsible for the grain size effect.
Dependence of critical crack intensity factor  on grain size d in nc copper.

Figures 6–8 suggest that the fracture toughness changes with grain size; however, the changes are not large. For instance, the fracture toughness only increases by 2.1%, when the grain size increases from 20 to 100 nm. It demonstrates that the fracture toughness of nc materials is not highly sensitive to the change in grain size. In addition, our calculated fracture toughness values are between 1.65 and 1.70 MPa/m1/2, which are smaller than the experimental data. This can be explained by two reasons: (i) in the present model, we did not consider the dislocations already existing in real materials but the dislocations emitting from crack tip, and (ii) we did not consider the alternative deformations such as GBS, diffusional creep, rotational deformation, and nanoscale twin, which are capable of causing good toughness of nc materials under certain conditions.
IV. CONCLUSIONS
We have developed a theoretical model to study the critical stress intensity factor K IC (which characterizes toughness) of nc materials by considering a typical case where crack lies at the interface of two neighboring grains, and the cohesive zone size is assumed to be equal to the grain size. Blunting and propagating processes of the crack are controlled by a combined effect of dislocation and cohesive zone. Edge dislocations emit from the cohesive crack tip and make a shielding effect on the crack. It was found that the critical stress intensity factor K IC decreases with decreased grain size and leads a ductile-to-brittle transition. It should be noted that the K IC of nc materials is not highly sensitive to the grain size d. For instance, increasing the grain size from 20 to 100 nm increases the value of K IC only by 0.035 MPa/m1/2. At the same time, the crack blunting and growth processes are strongly influenced or even controlled by alternate deformation modes (e.g., diffusional creep, rotational, GBS, and twin deformation); these deformation modes may cause high toughness of nc materials under certain conditions. However, the influence of alternative deformation modes on the toughness of nc materials is largely unknown and needs further study.
ACKNOWLEDGMENTS
The authors are grateful for the funding of the National Natural Science Foundation of China (10502025 and 10872087), Natural Science Foundation of Jiangsu Province (BK2007528), Key Project of Chinese Ministry of Education (211061), Natural Science Foundation of Hubei Province, and Research and Innovation Projects Foundation of University Postgraduate of Jiangsu Province (CX10B_167Z).