Residential segregation in the United States is an endemic, societal-level social–cultural process that leads to an overrepresentation of families of color in low-income or ethnic–racial minority neighborhoods (Macartney, Bishaw, & Fontenot, Reference Macartney, Bishaw and Fontenot2013; Reardon, Robinson, & Weathers, in press). As such, the socioeconomic and ethnic–racial structural characteristics of residential neighborhoods (e.g., poverty rates and percentage of Latino residents) should have implications for development, including both adaptive and maladaptive functioning, among adolescents from ethnic and racial groups that experience marginalization (i.e., “minority groups”; Causadias, Reference Causadias2013). The idea that neighborhood structural characteristics, like concentrated poverty and ethnic–racial concentrations, can shape adolescents’ developmental outcomes is well situated within the neighborhood effects research tradition (Leventhal & Brooks-Gunn, Reference Leventhal and Brooks-Gunn2000; Sampson, Raudenbush, & Earls, Reference Sampson, Raudenbush and Earls1997). Existing neighborhood effects research emphasizes the critical role that concentrated poverty (e.g., concentrations of unemployed, low-income, female-headed, and/or public assistance households) has on adolescents’ behavioral and emotional outcomes (McBride Murry, Berkel, Gaylord-Harden, Copeland-Linder, & Nation, Reference McBride Murry, Berkel, Gaylord-Harden, Copeland-Linder and Nation2011). The implications of neighborhood ethnic–racial concentrations (e.g., percentage of Latino, Black/African American, or Asian residents), however, are less clear (Leventhal, Dupéré, & Shuey, Reference Leventhal, Dupéré and Shuey2014). A better understanding of the implications of neighborhood structural characteristics for developmental outcomes may come from addressing the interplay of culture, development, and psychopathology (Causadias, Reference Causadias2013).
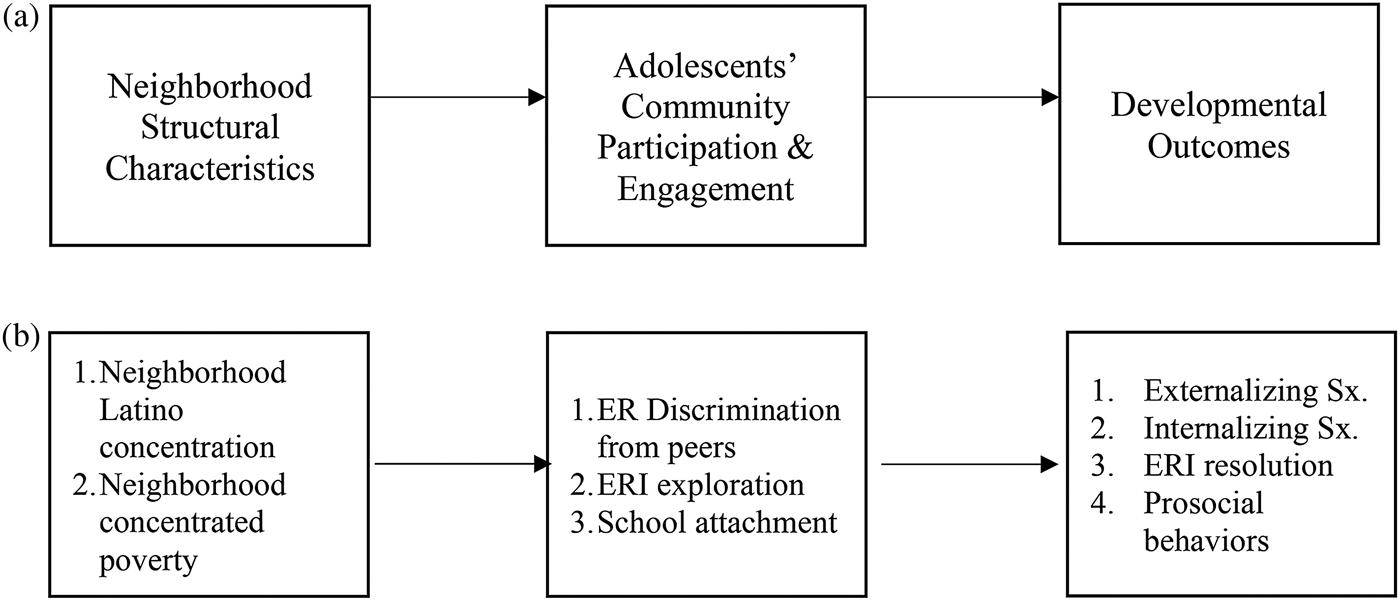
Structural characteristics of residential neighborhoods should influence developmental outcomes by shaping the form and content of adolescents’ community participation and engagement (see Figure 1a; Bronfenbrenner & Morris, Reference Bronfenbrenner, Morris and Lerner2006; Causadias, Reference Causadias2013). Individuals participate and engage in multiple cultural communities (Rogoff, Reference Rogoff2003). Adolescents participate and engage in diverse community types, including, for example, their ethnic–racial communities, peer communities, and school communities. In addition, they encounter diverse content within each community, including social processes that may be promoting on inhibiting (García Coll et al., Reference García Coll, Crnic, Lamberty, Wasik, Jenkins, Garcia and McAdoo1996; Rogoff, Reference Rogoff2003; Rogoff, Paradise, Mejía Arauz, Correa-Chávez, & Angelillo, Reference Rogoff, Paradise, Mejía Arauz, Correa-Chávez and Angelillo2003). Prior empirical work highlights three aspects of adolescents’ community participation and engagement that may help to explain how and why neighborhood socioeconomic and ethnic–racial structural characteristics matter for developmental outcomes among adolescents from ethnic–racial minority groups. These include ethnic–racial identity exploration (White, Knight, Jensen, & Gonzales, Reference White, Knight, Jensen and Gonzales2018), discrimination from peers (White, Zeiders, Knight, Roosa, & Tein, Reference White, Zeiders, Knight, Roosa and Tein2014), and school attachment (Kirk, Reference Kirk2009). As it regards developmental outcomes salient to neighborhood influences, internalizing and externalizing symptoms are common indicators of maladaptive functioning in neighborhood research (Leventhal, Dupéré, & Brooks-Gunn, Reference Leventhal, Dupéré and Brooks-Gunn2009). Identity and moral development (Knight & Carlo, Reference Knight and Carlo2012), in contrast, are two highly salient indicators of adaptive functioning during adolescence (Carlo, Reference Carlo, Killen and Smetana2014; Umaña-Taylor et al., Reference Umaña-Taylor, Quintana, Lee, Cross, Rivas-Drake and Schwartz2014) that are understudied in neighborhood research (Knight & Carlo, Reference Knight and Carlo2012; McBride Murry et al., Reference McBride Murry, Berkel, Gaylord-Harden, Copeland-Linder and Nation2011). In the current study, we examined a model (Figure 1b) in which neighborhood Latino concentration and concentrated poverty impact maladaptive and adaptive functioning (i.e., internalizing symptoms, externalizing symptoms, ethnic–racial identity resolution, and prosocial behaviors) via aspects of adolescents’ community participation and engagement (i.e., ethnic–racial identity exploration, discrimination from peers, and school attachment).
(a) Conceptual model describing the implications of neighborhood structural characteristics for adolescents’ developmental outcomes via aspects of adolescents’ community participation and engagement. (b) Investigated model describing the implications of neighborhood Latino concentration and neighborhood concentrated poverty for adolescents' externalizing symptoms, internalizing symptoms ethnic–racial identity resolution, and prosocial behaviors via intermediate changes in adolescents’ ethnic–racial discrimination from peers, ethnic–racial identity exploration, and school attachment. ERI, ethnic–racial identity. ER–ethnic–racial. Sx, symptoms.

Though we argue that the conceptual model (Figure 1a) is likely to be relevant to numerous groups and developmental periods, we focus on Mexican-origin adolescents (including both immigrants from Mexico and individuals with Mexican ancestry who were born in the United States). First, adolescence is a period in which advanced sociocognitive and socioemotional skills support youth to experience extrafamilial environments more directly (Steinberg, Reference Steinberg2008), including their neighborhoods (Leventhal et al., Reference Leventhal, Dupéré and Brooks-Gunn2009). Second, Mexican-origin Latinos are the largest Latino subgroup in the United States (Ennis, Ríos-Vargas, & Albert, Reference Ennis, Ríos-Vargas and Albert2011). By using an ethnic-homogenous research design, we actively recognize that different neighborhood ethnic–racial characteristics (e.g., Black/African American concentration, Asian concentration, Latino concentration) are experienced differently by in- and out-group members (Portes, Fernandez-Kelly, & Haller, Reference Portes, Fernandez-Kelly and Haller2005). Consequently, we specifically focus on neighborhood Latino concentration (percentage of Latino residents in the neighborhood). Third, Mexican-origin families and youth experience high rates of both socioeconomic and ethnic–racial residential segregation (Massey, Reference Massey2016). There is, however, considerable variability among this population, as prior research shows that Mexican-origin families and adolescents reside across the full ranges of neighborhood concentrated poverty and neighborhood Latino concentration (Roosa et al., Reference Roosa, Weaver, White, Tein, Knight, Gonzales and Saenz2009). These ranges are critical to account for when testing hypotheses about how variability in neighborhood structural characteristics influences adolescents’ community participation and engagement, and developmental outcomes.
Neighborhood Concentrated Poverty, Neighborhood Ethnic–Racial Concentration, and Adolescent Developmental Outcomes: Sociological Perspectives
A common approach to developmental scholarship is to assert that context matters for development without engaging in specific theorizing about how or why particular characteristics of specific contexts should matter (White, Burleson, & Knight, Reference White, Burleson, Knight, Crockett and Carlo2016). To theorize about adolescent development in the context of neighborhood structural characteristics, like Latino concentration and concentrated poverty, researchers should draw from both sociological and psychological perspectives. Specifically, to theorize cultural development and psychopathology in environments that vary on structural characteristics, psychologists need to know whether high or low scores on those structural characteristics are associated with socially organized/supportive settings or socially disorganized/unsupportive settings. To this end, sociological perspectives offer critical insights relative to how neighborhood structural characteristics work to influence social organization or disorganization at the neighborhood level (Portes et al., Reference Portes, Fernandez-Kelly and Haller2005; Sampson et al., Reference Sampson, Raudenbush and Earls1997).
First, social disorganization theory describes the ways in which neighborhood structural characteristics undermine neighborhood-level social organization. Specifically, concentrated poverty (resource deprivation) and ethnic–racial heterogeneity (cultural and linguistic diversity) are theorized to undermine neighbors’ ability to develop social capital in the form of shared trust, shared values, and shared responsibilities (Putnam, Reference Putnam2007; Sampson et al., Reference Sampson, Raudenbush and Earls1997). This lack of neighborhood-level social organization should undermine the health and well-being of individual residents (Sampson, Reference Sampson, Booth and Crouter2001). In recent narrative reviews, ones not focused specifically on Mexican-origin and Latino individuals, authors have concluded that there is strong empirical evidence that neighborhood concentrated poverty undermines youths’ developmental outcomes via neighborhood-level social disorganization (Leventhal et al., Reference Leventhal, Dupéré and Brooks-Gunn2009, Reference Leventhal, Dupéré and Shuey2014). Likewise, in support of the organizing capacity of cultural and linguistic similarity (Sampson et al., Reference Sampson, Raudenbush and Earls1997), Browning and colleagues (Browning, Burrington, Leventhal, & Brooks-Gunn, Reference Browning, Burrington, Leventhal and Brooks-Gunn2008; Browning, Dirlam, & Boettner, Reference Browning, Dirlam and Boettner2016; Browning, Leventhal, & Brooks-Gunn, Reference Browning, Leventhal and Brooks-Gunn2004; Jackson, Browning, Krivo, Kwan, & Washington, Reference Jackson, Browning, Krivo, Kwan and Washington2016) have consistently demonstrated that higher neighborhood Latino and Latino immigrant concentrations are associated with socially organized neighborhood environments, though their work suggests there may be ceiling effects.
Despite Browning and colleague's findings, other researchers consider neighborhood ethnic and racial structural characteristic effects on adolescent development to be erratic or inconsistent (Leventhal et al., Reference Leventhal, Dupéré and Brooks-Gunn2009). There are theoretical and empirical tensions in social disorganization work on ethnic–racial neighborhood structural characteristics that may contribute to inconsistent findings, however. Empirically, scholars have often focused on a construct labeled “immigrant concentration,” which is a composite of the percentage of Latino residents and the percentage of foreign-born residents in a neighborhood (Sampson et al., Reference Sampson, Raudenbush and Earls1997). In the 20th century, high scores on this composite were interpreted as indicative of ethnic–racial dissimilarity, a disorganizing social force, because they described “neighborhoods of ethnic and linguistic heterogeneity” (Sampson et al., Reference Sampson, Raudenbush and Earls1997, p. 920). In a 21st-century US society, however, high scores on ethnic–racial concentrations or foreign-born concentrations could be associated with homogeneity or heterogeneity (Jackson et al., Reference Jackson, Browning, Krivo, Kwan and Washington2016). First, foreign-born concentration is a less precise variable, because numerically high scores on this variable can represent homogeneity if foreign-born residents tend to come from a single country or culture, or heterogeneity if foreign-born residents are from different countries and cultures (Martinez, Lee, & Nielsen, Reference Martinez, Lee and Nielsen2004). Reliable country-specific rates of immigrant concentration at the neighborhood level, however, are often not publicly available from the census or similar data sources (see Browning et al., Reference Browning, Dirlam and Boettner2016, for a discussion), especially since the transition to the American Community Survey (US Census Bureau, 2009). Thus, when theorizing heterogeneity or homogeneity, an empirical focus on foreign-born concentrations may be less clear because (for most conventionally used data sources) the ethnic–racial makeup of the foreign-born population is not directly and/or reliably observed (US Census Bureau, 2009).
Similar to foreign-born concentrations, neighborhood racial or ethnic concentration variables (e.g., percent Latino) can also represent homogeneity or heterogeneity. In contrast to foreign-born concentrations, however, whether high scores on these variables are more consistent with homogeneity or heterogeneity is largely observable within contemporary neighborhood-level data sources (e.g., American Community Survey). For example, a sample of neighborhoods drawn from a geographic area with a smaller Latino population may produce a restricted range of neighborhood Latino concentration (e.g., approximately 0% to 50%). In this context, high scores on neighborhood Latino concentration would be indicative of heterogeneity, a disorganizing neighborhood-level social force, because 50% of neighborhood residents must come from one or more other ethnic–racial groups. Conversely, in the context of a sample of neighborhoods drawn from a geographic area that does not have a restricted range (e.g., up to 100%), high scores on neighborhood Latino concentration would be indicative of homogeneity, a socially organizing force. Furthermore, to the degree that a given geographic areas’ Latino concentration is predominated by a single group (e.g., Mexican-descent Latinos), ethnic similarity is amplified and panethnic heterogeneity is minimized. Overall, whether an ethnic–racial concentration variable is indicative of neighborhood homogeneity or heterogeneity depends on the underlying distribution of the variable in the sample and in the population. This is important to psychologists because homogeneity and similarity in neighborhood contexts promotes neighborhood-level social organization (Browning et al., Reference Browning, Dirlam and Boettner2016), whereas heterogeneity/dissimilarity promotes neighborhood-level disorganization (Sampson et al., Reference Sampson, Raudenbush and Earls1997). A failure to attend to the range and nature of the ethnic–racial concentration variable in a geographic area and sample, therefore, can contribute to empirical inconsistencies in how neighborhood ethnic–racial characteristics relate to developmental outcomes.
Segmented assimilation perspectives, a second sociological perspective, suggest that the presence of an established coethnic, or within-group community can be a valuable resource for immigrants and ethnic minorities (Portes & Rumbaut, Reference Portes and Rumbaut2001). According to segmented assimilation, characteristics within the coethnic community should determine the level of community social capital available to individuals (Rumbaut & Portes, Reference Rumbaut and Portes2001). Established ethnic communities can sometimes support strong networks and social capital (Martinez et al., Reference Martinez, Lee and Nielsen2004; Martinez & Valenzuela, Reference Martinez and Valenzuela2006) capable of helping community members to adapt and thrive (Portes & Rumbaut, Reference Portes and Rumbaut2001). Further, segmented assimilation suggests that an ethnic community's social capital depends less on the relative economic or occupational success of the population (Burchfield & Silver, Reference Burchfield and Silver2013) and more on community-level shared values, cohesion, helping, and solidarity (Vega, Ang, Rodriguez, & Finch, Reference Vega, Ang, Rodriguez and Finch2011). Further, concentrated Latino communities may be capable of encouraging new forms of neighborhood social capital that can thrive in the context of poverty (Martinez & Valenzuela, Reference Martinez and Valenzuela2006), and promote families and parental authority (Martinez et al., Reference Martinez, Lee and Nielsen2004). Thus, segmented assimilation perspectives also treat higher concentrations of Latinos (i.e., more homogenously Latino neighborhoods) as more organized environments. According to this perspective, however, the organizing nature of these environments should be specifically beneficial to coethnics, or within-group members.
Segmented assimilation also recognizes potential downsides to residing in neighborhoods with high ethnic concentration, especially for latter generation youth. Reflecting broader US patterns of residential, school, and employment segregation for low-income Mexican-origin populations and some other ethnic–racial minority groups (Martinez et al., Reference Martinez, Lee and Nielsen2004), ethnically concentrated neighborhoods are often located alongside existing marginalized neighborhoods. In these contexts, some residents may have adapted (White, Nair, & Bradley, Reference White, Nair and Bradley2018) to the legacy of oppression and differentially resourced environments (Orfield & Lee, Reference Orfield and Lee2007) through disengagement from school or other mainstream social institutions that are experienced as oppressive (Portes & Rumbaut, Reference Portes and Rumbaut2001; Rumbaut & Portes, Reference Rumbaut and Portes2001). Such adaptations may be especially salient to latter generation (second and beyond) adolescents (Kulis, Marsiglia, Sicotte, & Nieri, Reference Kulis, Marsiglia, Sicotte and Nieri2007). Prior sociological research suggests that benefits and costs associated with residence in concentrated Latino neighborhoods occur simultaneously, even within a single ethnic group, like Mexican-origin Latinos (Martinez et al., Reference Martinez, Lee and Nielsen2004) and that some variability in the costs and benefits may be due to individual and family factors, like gender, nativity, and family structure (Portes & Rumbaut, Reference Portes and Rumbaut2001).
Social disorganization and segmented assimilation theories offer overlapping and distinct perspectives. Both suggest that predominantly Latino neighborhoods, in part because of ethnocultural similarity that facilitates the development of solidarity, cohesion, and social capital at the neighborhood level, can be high on social organization. Both suggest that high-concentrated Latino neighborhoods are likely to achieve shared norms that are relatively stable, and easily observed and comprehensible. Segmented assimilation narrows the comprehensibility and benefits specifically to within-group community members, that is, specifically to the coethnic community. Psychologically, organized and consonant environments should be capable of mitigating maladaptive functioning and promoting adaptive functioning because they support developmentally promoting forms of participation and engagement (Bronfenbrenner & Morris, Reference Bronfenbrenner, Morris and Lerner2006; García Coll et al., Reference García Coll, Crnic, Lamberty, Wasik, Jenkins, Garcia and McAdoo1996; Spencer, Reference Spencer2006). Segmented assimilation perspectives, however, also recognize that these potentially organized and consonant environments likely coexist alongside oppressive mainstream structures and institutions, persistent ethnic–racial discrimination, and growing inequality that may have particular negative implications for participation and engagement with mainstream institutions, including schools (Portes & Rumbaut, Reference Portes and Rumbaut2001).
The two perspectives diverge somewhat on the salience of neighborhood concentrated poverty. Whereas social disorganization theory and empiricism emphasize the role of concentrated poverty (Sampson, Reference Sampson, Booth and Crouter2001) in setting the stage for neighborhood disorganization, segmented assimilation downplays the role of socioeconomic resources for achieving social organization in ethnically concentrated neighborhoods. Segmented assimilation highlights other organizing features (e.g., shared values and protection from discrimination) that support within-group members, or coethnics (e.g., Gonzales et al., Reference Gonzales, Coxe, Roosa, White, Knight, Zeiders and Saenz2011). Still, segmented assimilation recognizes that one pathway of adapting to inequality (especially socioeconomic inequality) may include disengagement from mainstream institutions.
Neighborhood Concentrated Poverty, Neighborhood Ethnic–Racial Concentrations, and Adolescent Development: Psychological Perspectives
Overall, the sociological perspectives that we reviewed herein suggest that higher degrees of cultural similarity found in ethnically–racially homogenous neighborhoods are associated with socially organized neighborhood environments, especially for within-group members. Further, high degrees of resource deprivation associated with neighborhoods high on concentrated poverty are associated with socially disorganized neighborhood environments, though established ethnic–racial minority communities may be able to compensate for some aspects of concentrated poverty to support socially organized neighborhood environments. Psychological perspectives go on to highlight organized, consonant, and supportive settings (vs. disorganized, incongruent, and uncertain) as promotive (vs. inhibiting; Bronfenbrenner & Morris, Reference Bronfenbrenner, Morris and Lerner2006; García Coll et al., Reference García Coll, Crnic, Lamberty, Wasik, Jenkins, Garcia and McAdoo1996; Wachs, Reference Wachs1979) for adolescent developmental outcomes. Thus, sociological perspectives, like social disorganization and segmented assimilation perspectives, provide the tools psychologists need to theorize diverse layers of adolescents’ community participation and engagement and adaptive and maladaptive functioning within neighborhood structures that are organizing or disorganizing.
Some psychologists highlight high rates of youth psychological problems, such as internalizing and externalizing symptoms, among some ethnic–racial minority adolescents as reflecting, in part, disparate rates of exposure to neighborhood concentrated poverty (Gonzales, Germán, & Fabrett, Reference Gonzales, Germán, Fabrett, Chang and Downey2012). Internalizing spectrum symptoms include mood problems, depressive symptoms, and anxiety symptoms; externalizing spectrum symptoms include behavior problems, risk-taking behaviors, conduct problems, and delinquency. Evidence gained from research on predominately non-Latino or panethnic and panracial samples has often found that neighborhood concentrated poverty related to higher internalizing and externalizing spectrum problems (see Leventhal et al., Reference Leventhal, Dupéré and Brooks-Gunn2009, for a review). In research specifically with US Latino and Mexican-origin adolescents, however, neighborhood concentrated poverty often fails to predict internalizing and externalizing spectrum problems (Frank, Cerda, & Rendon, Reference Frank, Cerda and Rendon2007; Gonzales et al., Reference Gonzales, Coxe, Roosa, White, Knight, Zeiders and Saenz2011; White, Deardorff, & Gonzales, Reference White, Deardorff and Gonzales2012; White, Deardorff, Liu, & Gonzales, Reference White, Deardorff, Liu and Gonzales2013). Thus, echoing segmented assimilation perspectives on the ability of ethnic and immigrant communities to support neighborhood-level social organization in the context of concentrated poverty (Burchfield & Silver, Reference Burchfield and Silver2013; Vega et al., Reference Vega, Ang, Rodriguez and Finch2011), neighborhood concentrated poverty may not be as salient a predictor of psychological problems among Mexican-origin youth.
Neighborhood ethnic–racial concentration levels, however, which tend to be positively correlated with concentrated poverty (Sampson et al., Reference Sampson, Raudenbush and Earls1997), have emerged as beneficial in some psychological research. Hurd, Stoddard, and Zimmerman (Reference Hurd, Stoddard and Zimmerman2012) found that higher neighborhood African American concentration was associated with lower internalizing-spectrum problems among African American adolescents. Lee and Liechty (Reference Lee and Liechty2015) found that a neighborhood composite focused on Latino and immigrant concentration predicted adolescents’ lower odds of depression, but only among foreign-born youth. Aneshensel and Sucoff (Reference Aneshensel and Sucoff1996) found that both adolescent depression and conduct disorders were lowest among Latino adolescents living in low-income, predominantly Latino neighborhoods. Frank and colleagues’ work (Frank & Bjornstrom, Reference Frank and Bjornstrom2011; Frank et al., Reference Frank, Cerda and Rendon2007), however, found that Latino (predominantly Mexican-origin) youth living in neighborhoods with Latino concentration levels above the county average (a relative measure of Latino concentration) displayed greater externalizing spectrum problems, an effect that was especially pronounced for US-born adolescents. The focus on relative ethnic–racial concentration, however, makes cross-study comparison challenging (see White, Knight, et al., Reference White, Knight, Jensen and Gonzales2018, for a discussion). With the exception of Frank and colleagues’ work (Frank & Bjornstrom, Reference Frank and Bjornstrom2011; Frank et al., Reference Frank, Cerda and Rendon2007), neighborhood ethnic–racial concentration variables appear to be having effects on internalizing and externalizing problems that are consistent with social disorganization and segmented assimilation perspectives on the developmentally organizing capacity of ethnic–racial homogeneity (Browning et al., Reference Browning, Leventhal and Brooks-Gunn2004; Browning, Leventhal, & Brooks-Gunn, Reference Browning, Leventhal and Brooks-Gunn2005) and the benefits of access to the coethnic community or within-group (Portes & Rumbaut, Reference Portes and Rumbaut2001).
Fewer psychological studies have examined neighborhood socioeconomic and ethnic–racial structural characteristic effects on adolescent adaptive functioning. One critical aspect of cultural development and psychopathology concerns the development of the cultural self (Causadias, Reference Causadias2013). In particular, ethnic–racial identity resolution is a normative developmental process, supported by social and cognitive maturation during adolescence, capturing the degree to which adolescents have a clear sense of the meaning of their race and ethnicity in their lives (Umaña-Taylor, Reference Umaña-Taylor2016). In addition, the development of prosocial behaviors, or actions intended to benefit others (Carlo, Reference Carlo, Killen and Smetana2014; Eisenberg, Fabes, & Spinrad, Reference Eisenberg, Fabes, Spinrad, Eisenberg, Damon and Lerner2006), is an important aspect of moral development during adolescence. Scholars have called for critical work to identify how neighborhood environments might promote or constrain development of ethnic–racial identity (McBride Murry et al., Reference McBride Murry, Berkel, Gaylord-Harden, Copeland-Linder and Nation2011) and prosocial behaviors (Carlo, Reference Carlo, Killen and Smetana2014).
A limited number of psychological studies have examined the implications of neighborhood structural characteristics for ethnic–racial identity development, but only one of these focused specifically on resolution (Supple, Ghazarian, Frabutt, Plunkett, & Sands, Reference Supple, Ghazarian, Frabutt, Plunkett and Sands2006). As it regards neighborhood socioeconomic characteristics, Supple et al. (Reference Supple, Ghazarian, Frabutt, Plunkett and Sands2006) found no association between neighborhood concentrated poverty and resolution in a cross-sectional study of Latino adolescents. Though resolution represents a maturational process relative to forming and maintaining an ethnic–racial identity (Umaña-Taylor, Reference Umaña-Taylor2016), broader ethnic–racial identity scholarship is also concerned with attitudes and beliefs about one's group (e.g., pride/affirmation, centrality, salience, and importance; Umaña-Taylor et al., Reference Umaña-Taylor, Quintana, Lee, Cross, Rivas-Drake and Schwartz2014). Among these distinct, but related constructs, research also documents no association between neighborhood concentrated poverty and ethnic–racial attitudes among African American and Latino adolescents (Byrd & Chavous, Reference Byrd and Chavous2009; Oyserman & Yoon, Reference Oyserman and Yoon2009). Overall, these findings suggest that neighborhood concentrated poverty may not be a salient neighborhood characteristic for ethnic–racial identity resolution, though this association has not been tested in longitudinal models.
Research findings for neighborhood ethnic and racial concentration and ethnic–racial identity development are mixed. Some individual studies document no (Hurd, Stoddard, et al., Reference Hurd, Stoddard and Zimmerman2012; Rivas-Drake & Witherspoon, Reference Rivas-Drake and Witherspoon2013) or numerically limited (Stevenson & Arrington, Reference Stevenson and Arrington2009) associations between the ethnic–racial compositions of neighborhoods (i.e., Black concentration) and African American adolescents’ ethnic–racial attitudes. One study documented higher relative neighborhood segregation being negatively associated with positive attitudes and beliefs about one's group (Oyserman & Yoon, Reference Oyserman and Yoon2009). Once again, however, the focus on relative measures undermines cross-study comparisons (White, Knight, et al., Reference White, Knight, Jensen and Gonzales2018). In cross-sectional studies, Supple et al. (Reference Supple, Ghazarian, Frabutt, Plunkett and Sands2006) found that neighborhood Latino concentration was positively associated with Latino adolescents’ ethnic–racial identity attitudes and Juang and Nguyen (Reference Juang and Nguyen2010) demonstrated parallel findings among Chinese American college students. Using a prospective study design, a wider range of neighborhood Latino concentration, and focusing specifically on Mexican-origin youth, however, White et al. (Reference White, Updegraff, Umaña-Taylor, Zeiders, Perez-Brena and Burleson2017) found that neighborhood Latino concentration did not predict Latino middle adolescents’ ethnic–racial identity attitudes, but did promote ethnic–racial identity processes (though resolution was not examined in that study). In a mixed-methods examination, Feinauer and Whiting (Reference Feinauer and Whiting2012) concluded that ethnically homogeneous neighborhoods provided “milieus of cultural compatibility” that nurture the development of healthy and connected ethnic identities (p. 69). Overall, though findings are mixed, the pattern emphasizes the supportive nature of ethnically and racially concentrated neighborhoods for within-group members’ ethnic–racial identity developmental processes (Feinauer & Whiting, Reference Feinauer and Whiting2012; White, Knight, et al., Reference White, Knight, Jensen and Gonzales2018), while empirically downplaying the role of concentrated poverty (Byrd & Chavous, Reference Byrd and Chavous2009; Oyserman & Yoon, Reference Oyserman and Yoon2009; Supple et al., Reference Supple, Ghazarian, Frabutt, Plunkett and Sands2006). Still, most of this work has not examined neighborhood structural characteristics and ethnic–racial identity resolution specifically. Recent conceptual advances stress the importance of exploring different ethnic–racial identity components separately, as they may have unique antecedents and consequents (Umaña-Taylor et al., Reference Umaña-Taylor, Quintana, Lee, Cross, Rivas-Drake and Schwartz2014).
A few psychological studies have examined neighborhood characteristics and prosocial behavior. In a childhood sample of predominantly White (93%) Canadians, one study found that a measure of neighborhood concentrated poverty did not relate to prosocial behaviors (Romano, Tremblay, Boulerice, & Swisher, Reference Romano, Tremblay, Boulerice and Swisher2005). Lenzi et al. (Reference Lenzi, Vieno, Perkins, Pastore, Santinello and Mazzardis2012) found that aspects of neighborhood social organization, which tend to be higher in Latino concentrated neighborhoods (Browning et al., Reference Browning, Dirlam and Boettner2016) and lower in neighborhoods with high concentrated poverty (Sampson et al., Reference Sampson, Raudenbush and Earls1997), were associated with higher prosocial behaviors among Italian adolescents. In the United States, among a panracial and panethnic sample of 6th to 12th graders in a single, economically depressed city, Wilson, O'Brien, and Sesma (Reference Wilson, O'Brien and Sesma2009) found that perceived support from neighbors and neighborhood quality were both associated with higher prosocial behaviors and attitudes. In the same study, Wilson et al. (Reference Wilson, O'Brien and Sesma2009) reported that neighborhood income did not relate to prosocial behaviors, whereas other indicators of social organization did. This distinction is consistent with segmented assimilation perspectives suggesting that an ethnic community's social organization resources depend less on neighborhood economics (Burchfield & Silver, Reference Burchfield and Silver2013) and more on neighborhood social capital (Vega et al., Reference Vega, Ang, Rodriguez and Finch2011).
Though a broad range of prosocial behaviors exists, the studies reviewed herein did not tend to address specific types of prosocial behavior. Dire (helping in emergencies), emotional (helping in emotionally evocative situations), and compliant (helping when asked) prosocial behaviors are especially promoted within Mexican-origin families and communities, particularly those with stronger heritage orientations (Calderón-Tena, Knight, & Carlo, Reference Calderón-Tena, Knight and Carlo2011; Knight, Carlo, Mahrer, & Davis, Reference Knight, Carlo, Mahrer and Davis2016). Viewed within recent conceptual and theoretical advances (White, Nair, et al., Reference White, Nair and Bradley2018), such findings suggest that systems of socialization within Mexican-origin communities may be especially likely to support the development of these particular types of prosocial behaviors. Thus, though work on neighborhood structural characteristics and prosocial behaviors is limited, especially in the United States, we expected that neighborhood Latino concentration would be associated with higher dire, emotional, and compliant prosocial behaviors. Overall, the findings for prosocial behaviors emphasized the consonant and promotional nature of ethnically homogenous and socially organized neighborhoods (e.g., Lenzi et al., Reference Lenzi, Vieno, Perkins, Pastore, Santinello and Mazzardis2012; Wilson et al., Reference Wilson, O'Brien and Sesma2009), and deemphasized the role of concentrated poverty (Romano et al., Reference Romano, Tremblay, Boulerice and Swisher2005; Wilson et al., Reference Wilson, O'Brien and Sesma2009).
The Mediating Roles of Ethnic–Racial Identity Exploration, Discrimination From Peers, and School Attachment
Neighborhood structural characteristics, like ethnic–racial concentrations and concentrated poverty, likely affect developmental outcomes via providing the ecological structures in which certain intermediate social processes are more or less likely to be encountered. Sociological perspectives often focus on neighborhood-level social processes (e.g., neighborhood-level collective efficacy and neighborhood-level social capital), and these are important pieces of the puzzle. Psychological perspectives, however, highlight adolescents’ direct participation and engagement in cultural communities as critical mechanisms via which environments, such as neighborhoods, shape developmental outcomes. Similarly, multiple developmental frameworks suggest that individuals participate and engage with multiple cultural communities in their daily lives (Bronfenbrenner & Morris, Reference Bronfenbrenner, Morris and Lerner2006; Rogoff, Reference Rogoff2003). During adolescence, three cultural communities may be particularly salient, including adolescents’ participation and engagement with the ethnic–racial community, peer community, and the school community. Specifically, engagement in activities that help adolescents to develop their cultural selves (Causadias, Reference Causadias2013), through ethnic–racial identity exploration, becomes increasingly important (Umaña-Taylor, Reference Umaña-Taylor2016). Second, the developmental salience of interactions with peers increases substantially in adolescence (Bellmore, Nishina, You, & Ma, Reference Bellmore, Nishina, You and Ma2012), which can lead to increased experiences of ethnic–racial discrimination during peer interactions (Bellmore et al., Reference Bellmore, Nishina, You and Ma2012; Greene, Way, & Pahl, Reference Greene, Way and Pahl2006). Third, adolescents’ engagement with critical social institutions (e.g., schooling) are mechanisms via which neighborhood environments might influence adaptive and maladaptive functioning (Kirk, Reference Kirk2009).
First, neighborhood structural characteristics may influence adolescents’ opportunities to participate and engage with their ethnic–racial communities via ethnic–racial identity exploration. Ethnic–racial identity exploration is the process of seeking or being exposed to information about one's group (Umaña-Taylor et al., Reference Umaña-Taylor, Quintana, Lee, Cross, Rivas-Drake and Schwartz2014). For example, adolescents might participate in activities/events and engage with materials (e.g., books, signs, and symbols) that teach them about their ethnic–racial background. Ethnic–racial identity exploration is a primary process via which adolescents develop ethnic–racial identity resolution (Umaña-Taylor, Reference Umaña-Taylor2016). Because the ability of adolescents to engage and participate in generative processes is higher in stable, organized, and consonant environments (Bronfenbrenner & Morris, Reference Bronfenbrenner, Morris and Lerner2006; Wachs, Reference Wachs1979), neighborhood Latino concentration, according to both social disorganization and segmented assimilation perspectives, should promote ethnic–racial identity exploration. Conversely, neighborhood concentrated poverty, which is associated with higher levels of disorganization (Sampson et al., Reference Sampson, Raudenbush and Earls1997), should constrain it. As it regards the latter, at least one study has found that neighborhood concentrated poverty related to lower levels of ethnic–racial identity exploration among Latino adolescents (Supple et al., Reference Supple, Ghazarian, Frabutt, Plunkett and Sands2006), but findings for ethnic–racial concentrations are mixed. Supple et al., who had a data set with a restricted range of neighborhood Latino concentration, found no cross-sectional association between neighborhood Latino concentration and ethnic–racial identity exploration (Supple et al., Reference Supple, Ghazarian, Frabutt, Plunkett and Sands2006). Prior analyses of data used in the current study, however, found that neighborhood Latino concentration positively predicted Mexican-origin adolescents’ ethnic identity exploration above mothers’ or fathers’ ethnic socialization (White, Knight, et al., Reference White, Knight, Jensen and Gonzales2018). That work, however, did not examine the effects of neighborhood concentrated poverty on ethnic–racial identity exploration; nor did it examine whether neighborhood ethnic concentration may have longer term implications for adaptive and maladaptive functioning via its impact on ethnic–racial identity exploration.
To serve as a mediator of neighborhood ethnic and socioeconomic structural characteristic effects on adolescent development, ethnic–racial identity exploration also needs to predict adaptive and maladaptive functioning. Recent reviews highlight ethnic–racial identity processes, including exploration, as having replicated associations with more adaptive and less maladaptive functioning (Rivas-Drake et al., Reference Rivas-Drake, Seaton, Markstrom, Quintana, Syed, Lee and Yip2014; Umaña-Taylor, Reference Umaña-Taylor2016). Across the two reviews, research findings identified the benefits of ethnic–racial identity exploration in reducing internalizing and externalizing spectrum problems (e.g., Umaña-Taylor et al., Reference Umaña-Taylor, O'Donnell, Knight, Roosa, Berkel and Nair2013), and increasing prosocial behaviors (e.g., Armenta, Knight, Carlo, & Jacobson, Reference Armenta, Knight, Carlo and Jacobson2011). Many of these studies, however, were cross-sectional (cf., Umaña-Taylor et al., Reference Umaña-Taylor, O'Donnell, Knight, Roosa, Berkel and Nair2013), and none considered the roles of neighborhood socioeconomic and racial–ethnic structural characteristics. Further, ethnic–racial identity exploration is considered a primary (though not only) mechanism via which adolescents can advance along the maturational continuum of ethnic–racial identity resolution (Umaña-Taylor, Reference Umaña-Taylor2016) and experimental trials confirm that interventions designed to facilitate ethnic–racial identity exploration promote later resolution (Umaña-Taylor, Douglass, Updegraff, & Marsiglia, Reference Umaña-Taylor, Douglass, Updegraff and Marsiglia2017). Thus, though not previously investigated longitudinally and relative to the other mediational mechanisms and indicators of adaptive and maladaptive functioning examined herein, the extant findings on ethnic–racial identity exploration are consistent with its hypothesized role as a mediator of neighborhood Latino concentration effects on both adaptive and maladaptive functioning.
Second, as it relates to adolescents’ participation and engagement with peer communities, neighborhood structural characteristics may influence adolescents’ exposure to ethnic–racial discrimination during peer interactions (White et al., Reference White, Zeiders, Knight, Roosa and Tein2014). As it regards concentrated poverty, one study found no association between neighborhood concentrated poverty and African American early adolescents’ experiences of racial discrimination (Riina & McHale, Reference Riina and McHale2012), whereas others found positive associations, such that higher concentrated poverty was associated with more discrimination (Bécares, Cormack, & Harris, Reference Bécares, Cormack and Harris2013; Martin et al., Reference Martin, McCarthy, Conger, Gibbons, Simons, Cutrona and Brody2011). None of this work, however, focused on Mexican-origin or Latino youth. As it regards neighborhood ethnic-racial concentrations, Juang and Alvarez (Reference Juang and Alvarez2011) found that neighborhood coethnic concentration did not relate to Chinese American adolescents’ perceptions of discrimination; however, their sample of neighborhoods had a restricted range of coethnic concentration (approximately 15%–63%). In contrast, four other studies lend support to theoretical perspectives on coethnic concentrations as supportive and nondiscriminating (Bécares et al., Reference Bécares, Cormack and Harris2013; Hurd, Stoddard, et al., Reference Hurd, Stoddard and Zimmerman2012; Martin et al., Reference Martin, McCarthy, Conger, Gibbons, Simons, Cutrona and Brody2011; Stewart, Baumer, Brunson, & Simons, Reference Stewart, Baumer, Brunson and Simons2009). None of these studies, however, focused specifically on Latinos, Mexican-origin Latinos, or on discrimination from peers. Two prior longitudinal studies conducted with the current sample, showed that higher levels of neighborhood Latino concentration (White, Knight, et al., Reference White, Knight, Jensen and Gonzales2018) or increases in neighborhood Latino concentration (White et al., Reference White, Zeiders, Knight, Roosa and Tein2014) predicted lower levels of discrimination from peers. Neither of those studies, however, examined the hypothesized mediational associations with later developmental outcomes.
As it regards the developmental outcomes, the costly implications of ethnic–racial discrimination vis-á-vis adaptive and maladaptive functioning are well documented (see Priest et al., Reference Priest, Paradies, Trenerry, Truong, Karlsen and Kelly2013, for a review). During adolescence, ethnic–racial discrimination from peers may be an especially salient source of discrimination (Brown & Chu, Reference Brown and Chu2012). Thus, the pattern of extant findings supports peer discrimination as a hypothesized mediator of neighborhood structural characteristics, especially neighborhood Latino concentration, on adaptive and maladaptive functioning, though it has not previously been examined as such.
Third, as it relates to adolescents’ participation and engagement with the school community, neighborhood characteristics may influence adolescents’ attitudes toward school (Oyserman & Yoon, Reference Oyserman and Yoon2009), including school attachment, or bonds to school and to the educational institution (Gonzales et al., Reference Gonzales, Germán, Kim, George, Fabrett, Millsap and Dumka2008; Kirk, Reference Kirk2009). In the context of neighborhood socioeconomic and ethnic–racial segregation and marginalization, both sociological perspectives (Portes & Rumbaut, Reference Portes and Rumbaut2001; Sampson, Reference Sampson, Booth and Crouter2001) and psychological perspectives (Dupere, Leventhal, Crosnoe, & Dion, Reference Dupere, Leventhal, Crosnoe and Dion2010) highlight lower quality school institutions and youths’ experiences in those institutions as a mechanism linking neighborhood structural characteristics to adaptive and maladaptive functioning. Schools serving socioeconomically and ethnically–racially segregated neighborhoods have greater difficulty hiring and retaining qualified teachers (Guarino, Santibanez, & Daley, Reference Guarino, Santibanez and Daley2006), and faculty often lack adequate training (Spencer, Reference Spencer2006). Consequently, adolescents from ethnically and racially marginalized communities might experience challenges with social and institutional integration in the context of the lower quality school environments that typically serve them (Guarino et al., Reference Guarino, Santibanez and Daley2006). As an important component of a broader construct known as school bonding (Catalano, Oesterle, Fleming, & Hawkins, Reference Catalano, Oesterle, Fleming and Hawkins2004) and an important marker of social (Benner & Wang, Reference Benner and Wang2014) and mainstream institutional (Kirk, Reference Kirk2009) integration during adolescence, school attachment represents an important form of adolescents’ community participation and engagement. Adolescents from marginalized communities may have difficulty developing a psychological attachment to school because of the devaluing experiences they can encounter there (Spencer, Reference Spencer2006).
Empirical evidence regarding the possibility of school attachment as a mediator of neighborhood structural characteristic effects on adolescent development is inconclusive. For example, Stewart, Stewart, and Simons (Reference Stewart, Stewart and Simons2007) found that African American adolescents living in racially segregated and economically disadvantaged neighborhoods placed less importance on higher education than their counterparts in less segregated neighborhoods. Benner and Wang (Reference Benner and Wang2014), however, found that a lack of access to same-race/ethnicity or same-socioeconomic peers in schools was associated with lower school attachment in a relatively advantaged panethnic–panracial sample that included Latinos. Their findings, however, did not generalize to the Latino subsample. In a separate sample of Mexican-origin adolescents, school attachment predicted lower internalizing and externalizing problems (Gonzales, Germán, et al., Reference Gonzales, Germán, Fabrett, Chang and Downey2012), and because school attachment is a mechanism via which adolescents can develop conformity (Hirschi, Reference Hirschi2002), it may also promote prosocial behaviors (Catalano et al., Reference Catalano, Oesterle, Fleming and Hawkins2004). Though no prior research has examined school attachment as a mediator of neighborhood structural characteristics, prior empirical evidence examining certain components of the process suggests that it may operate as one. In particular, it may be lower in the context of neighborhood concentrated poverty (Kirk, Reference Kirk2009; Stewart et al., Reference Stewart, Stewart and Simons2007) and it may be particularly salient for internalizing and externalizing symptoms (Gonzales, Germán, et al., Reference Gonzales, Germán, Fabrett, Chang and Downey2012), and prosocial behaviors (Catalano et al., Reference Catalano, Oesterle, Fleming and Hawkins2004).
The Present Study
In the current study, we examined three developmentally and culturally salient aspects of adolescents’ community participation and engagement (ethnic–racial identity exploration, ethnic–racial discrimination from peers, and school attachment) as putative mediators of neighborhood Latino concentration and neighborhood concentrated poverty influences on maladaptive functioning (i.e., internalizing and externalizing symptoms) and adaptive functioning (ethnic identity resolution and prosocial behaviors; see Figure 1b). Though no prior work, to our knowledge, has examined these psychological constructs as putative mediators, we selected them based upon their theoretical, developmental, and cultural salience for Mexican-origin adolescents, alongside existing empirical evidence from individual studies linking the mechanisms to either neighborhood socioeconomic characteristics, neighborhood ethnic–racial concentration characteristics, or adaptive and maladaptive functioning. We tested a longitudinal mediational model in which we controlled for earlier levels of the mediators and dependent variables. Such approaches help to address important issues related to neighborhood selection effects, or the idea that neighborhood effects are observed simply because certain types of families (e.g., low income, underresourced, with children already experiencing externalizing symptoms) select into neighborhoods with certain socioeconomic and ethnic–racial characteristics (Dupere et al., Reference Dupere, Leventhal, Crosnoe and Dion2010). Drawing on prior work and theory reviewed herein, we advanced the following specific hypotheses.
Hypothesis one (H1) addresses mediational mechanisms from early adolescent neighborhood Latino concentration to later developmental outcomes. Specifically, we hypothesize that early adolescent neighborhood Latino concentration would predict higher ethnic–racial identity resolution and prosocial behaviors and lower internalizing and externalizing symptoms in late adolescence via middle adolescent increases in ethnic–racial identity exploration and decreases in ethnic–racial discrimination from peers. We also explored school attachment as a potential mediator of these associations, though our review of theory (Portes & Rumbaut, Reference Portes and Rumbaut2001) and empiricism (Benner & Wang, Reference Benner and Wang2014; Stewart et al., Reference Stewart, Stewart and Simons2007) offered conflicting guidance on the putative association between Latino concentration and school attachment. Hypothesis two (H2) addresses mediational mechanisms from early adolescent neighborhood concentrated poverty to later developmental outcomes. Specifically, we hypothesize that early adolescent neighborhood concentrated poverty would predict higher internalizing and externalizing symptoms and lower ethnic–racial identity resolution and prosocial behaviors in late adolescence via middle adolescent decreases in school attachment. We also explored ethnic–racial identity exploration and discrimination from peers as a potential mediator of these associations and ethnic–racial identity resolution as a potential outcome (consistent with our conceptual model), though our review of theory and empiricism did not emphasize these particular mechanisms.
Method
Data were from a longitudinal study of 749 Mexican-origin families (Roosa et al., Reference Roosa, Liu, Torres, Gonzales, Knight and Saenz2008) who were recruited from 5th-grade classroom rosters (Fall 2004–Spring 2006) and were interviewed four times over 7 years (during 5th, 7th, 10th, and 12th grades). At 5th grade, out of the 749 families, 579 were two-parent families. Families were eligible if they had a target 5th grader attending a sampled school; the participating mother was the biological mother, lived with the child, and was Mexican descent; the child's biological father was Mexican descent; the child was not learning disabled; and no stepfather figure was living with the child. Linguistically, during 5th-grade interviews, 69.8% of mothers, 76.7% of fathers, and 17.6% of children chose to be interviewed in Spanish and the remaining in English. A majority of mothers (74.4%) and fathers (79.9%) were born in Mexico, and a majority of adolescents were born in the United States (70.2%). Mean age was 35.9 years (SD = 5.81) for mothers, 38.1 years (SD = 6.26) for fathers, and 10.42 years (SD = 0.55) for children. Both parents reported about 10 years of education (SD M = 3.67; SD F = 3.94). Annual family incomes ranged from less than $5,000 to more than $95,000 (mean $30,000–$35,000). In the state of Arizona, where this study was conducted, the population was composed of primarily non-Latino Whites (59%) and Latinos (30%; with the remaining 11% split across non-Latino Blacks, non-Latino Native Americans and Alaska Natives, and other races), and 89% of Latinos were Mexican descent (Diaz McConnell & Skeen, Reference Diaz McConnell and Skeen2009).
Because of our focus on adolescence, a critical period for the development of mental health problems (e.g., internalizing and externalizing symptoms), identity, and morality (Steinberg, Reference Steinberg2008) as well as more independent exposures to neighborhood contexts (Leventhal et al., Reference Leventhal, Dupéré and Brooks-Gunn2009), we used data from 7th, 10th, and 12th grades. Of the original 5th-grade sample, 16 families had moved to Mexico by 7th grade. These families were excluded from the present study because they were not residing in US neighborhood contexts during their children's early adolescence. This yielded an analytic sample of 733 families. Compared to families who remained in the United States, families who moved to Mexico by 7th grade were more likely to have mothers, χ2 (1) = 5.64, p < .05, and children, χ2 (1) = 16.00, p < .01, born in Mexico, have mothers, χ2 (1) = 3.99, p < .05, and children, χ2 (1) = 37.70; p < .01, who completed 5th-grade interviews in Spanish, and have lower 5th-grade family income, t (16.76) = −6.42, p < .01.
Of the 733 families, 94.7% participated in 7th grade, 85.5% participated in 10th grade, and 85.1% participated in 12th grade. Preliminary attrition analyses examined whether families who participated in interviews in 7th, 10th, and 12th grades differed on 5th-grade child demographic (i.e., nativity, gender, language of interview, and family annual income), mother demographic (i.e., age, nativity, and marital status), and father demographic (i.e., age and nativity) variables from those who did not. Most demographic comparisons were nonsignificant, though families who participated in 10th grade (n = 627) reported higher family annual income, t (715) = −2.913, p = .004, and children were less likely to be born in Mexico, χ2 (1) = 4.842, p = .036, compared to those who did not participate (n =106). Families who participated in 12th grade (n = 624) reported higher family annual income, t (715) = −3.106, p = .002, and children were less likely to be male, χ2 (1) = 7.56, p = .007, compared to those who did not participate (n = 109). Regarding current study variables, those families who participated in 7th grade (n = 694) had children with higher levels of 5th-grade externalizing symptoms, t (48.03) = –2.70, p = .010, compared to those who did not participate (n = 39). No other differences were observed in demographic or study variables. The 733 adolescents resided within 222 census tract neighborhoods. The mean number of adolescents per neighborhood was 3.3. Study procedures were approved by the institutional review board at Arizona State University. Complete research procedures are published elsewhere (Roosa et al., Reference Roosa, Liu, Torres, Gonzales, Knight and Saenz2008). Adolescents, mothers, and fathers completed computer-assisted personal interviews (approximately 2.5 hr) at their home, in their preferred language using Blaise 4.6 software (Statistics Netherlands, 1999). Families were compensated $50, $55, and $60 per participating family member at 7th, 10th, and 12th grades, respectively.
Measures
Demographics
Parents and adolescents reported on demographic characteristics including their date of birth, gender (0 = male; 1 = female), and nativity (0 = Mexico born; 1 = US born). Mothers reported on annual family income (1 = $0,000–$5,000 to 20 = $95,001+) and provided information on household structure (0 = single parent; 1 = two-parent household).
Neighborhood racial–ethnic and socioeconomic structural characteristics (7th grade)
Families provided residential addresses that were geocoded and assigned to census tracts. Data on the percentage of Latino residents in each census tract were obtained from the US Census Bureau (2011) to operationalize neighborhood Latino concentration. The percentage of Latinos in each census tract ranged from 3.98% to 96.95% ( $\bar X = 57.81$, SD = 23.49). Neighborhood Latino concentration was negatively correlated with the proportion of non-Latino Whites in the neighborhood (r = −.95, p < .001). Consistent with prior work (see McBride Murry et al., Reference McBride Murry, Berkel, Gaylord-Harden, Copeland-Linder and Nation2011, for a review), we used data on the percentage of (a) families below the poverty line, (b) males over 16 years unemployed, (c) female-headed households, and (d) households with public assistance in each census tract from the US Census Bureau (2011) to create a measure of neighborhood concentrated poverty. We standardized and summed these indicators with higher scores reflecting higher concentrated poverty. Scores ranged from –6.11 to 23.03 (
 $\bar X = 0$, SD = 2.79;
 $\propto = .71$) with evidence of nonnormality (kurtosis = 8.96).
Ethnic–racial identity exploration (7th and 10th grades)
A 7-item subscale from the Ethnic Identity Scale assessed adolescents’ ethnic–racial identity exploration (Umaña-Taylor, Yazedjian, & Bámaca-Gómez, Reference Umaña-Taylor, Yazedjian and Bámaca-Gómez2004). This subscale has demonstrated good psychometric properties with Mexican-origin adolescents (White, Umaña-Taylor, Knight, & Zeiders, Reference White, Umaña-Taylor, Knight and Zeiders2011). Sample items included “I have attended events that have helped me learn more about my ethnicity.” Items were scored on a Likert-type scale of 1 to 5 (e.g., 1 = not at all true to 5 = very true). We computed a mean with higher scores indicating higher exploration. Cronbach's αs were 0.73 (7th grade) and 0.81 (10th grade).
Ethnic–racial discrimination from peers (7th and 10th grades)
A 5-item scale assessed adolescents’ perceptions of ethnic–racial discrimination from peers. The measure, which is a published adaptation to the Adolescents’ Experiences with Racism Scale, has previously demonstrated good psychometric properties in samples of Mexican-origin youths (Delgado, Updegraff, Roosa, & Umaña-Taylor, Reference Delgado, Updegraff, Roosa and Umaña-Taylor2011). Adolescents were asked to indicate how true or how often events happened (e.g., kids called you names because you are Mexican or Mexican America) on a Likert-type scale from 1 to 5 (e.g., 1 = almost never or never to 5 = almost always or always). We computed a mean with higher scores reflecting greater perceptions of ethnic–racial discrimination from peers. Cronbach's αs were 0.77 (7th) and 0.78 (10th grade).
School attachment (7th and 10th grades)
An 8-item scale, previously adapted from the School Is Important Now Scale, the Academic Liking Scale, and the Importance of Education scale (Lord, Eccles, & McCarthy, Reference Lord, Eccles and McCarthy1994; Roeser, Lord, & Eccles, Reference Roeser, Lord and Eccles1994; Smith et al., Reference Smith, Connell, Wright, Sizer, Norman, Hurley and Walker1997), assessed adolescents’ school attachment. This adapted scale has demonstrated good psychometric properties in a separate Mexican-origin adolescent sample (Gonzales, Dumka, et al., Reference Gonzales, Dumka, Millsap, Gottschall, McClain, Wong and Carpentier2012). Adolescents were asked to indicate how true statements were (e.g., you like school a lot; you look forward to going to school; and you like to do well in school) on a Likert-type scale from 1 to 5 (e.g., 1 = not at all to 5 = very true). We computed a mean with higher scores indicating a stronger attachment to school. Cronbach's αs were 0.76 (7th) and 0.81 (10th grade).
Internalizing and externalizing symptoms (7th and 12th grades)
The Diagnostic Interview Schedule for Children (C-DISC; Shaffer, Fisher, Lucas, Dulcan, & Schwab-Stone, Reference Shaffer, Fisher, Lucas, Dulcan and Schwab-Stone2000) assessed adolescents’ internalizing symptoms and externalizing symptoms. The C-DISC is a structured interview based on criteria from the fourth edition of The Diagnostic and Statistical Manual of Mental Disorders (DSM-IV). Adolescents and mothers were administered the C-DISC independently. Internalizing symptoms were defined as the sum of the symptom counts for generalized anxiety, major depression, and social phobias; externalizing symptoms were defined as the sum of the symptom counts for oppositional defiance disorder, conduct disorder, and attention-deficit/hyperactivity disorder, consistent with prior work (Conger et al., Reference Conger, Wallace, Sun, Simons, McLoyd and Brody2002; Cosgrove et al., Reference Cosgrove, Rhee, Gelhorn, Boeldt, Corley, Ehringer and Hewitt2011). We aggregated mother reports and adolescent reports using standard C-DISC scoring algorithms to maximize test–retest reliability and criterion validity (Shaffer, Fisher, Lucas, Hilsenroth, & Segal, Reference Shaffer, Fisher, Lucas, Hilsenroth and Segal2004) and reduce shared method variance.
Ethnic–racial identity resolution (10th and 12th grades)
A 4-item Ethnic Identity Scale subscale assessed adolescents’ ethnic–racial identity resolution (e.g., “I have a clear sense of what my ethnicity means to me”; Umaña-Taylor et al., Reference Umaña-Taylor, Yazedjian and Bámaca-Gómez2004). Items were scored on a Likert-type scale of 1 to 5 (e.g., 1 = not at all true to 5 = very true). We computed a mean with higher scores indicating higher resolution. Cronbach's αs were 0.86 (10th) and 0.90 (12th grade).
Prosocial behaviors (10th and 12th grades)
We used three subscales from the prosocial tendencies measures, which demonstrates good psychometric properties across ethnicities (Carlo, Knight, McGinley, Zamboanga, & Jarvis, Reference Carlo, Knight, McGinley, Zamboanga and Jarvis2010), to assess adolescents’ prosocial behaviors or tendencies to help (Carlo & Randall, Reference Carlo and Randall2002) under emotional (5 items; e.g., “It makes you feel good when you can comfort someone who is very upset”), dire (3 items; e.g., “You tend to help people who are in a real crisis or need”), and compliant (2 items; e.g., “When people ask you to help them, you don't hesitate”) conditions. Responses ranged from 1 (not at all) to 5 (very much). We computed a mean with higher scores indicating greater prosocial behaviors. Cronbach's αs were 0.85 (10th) and 0.86 (12th grade).
Results
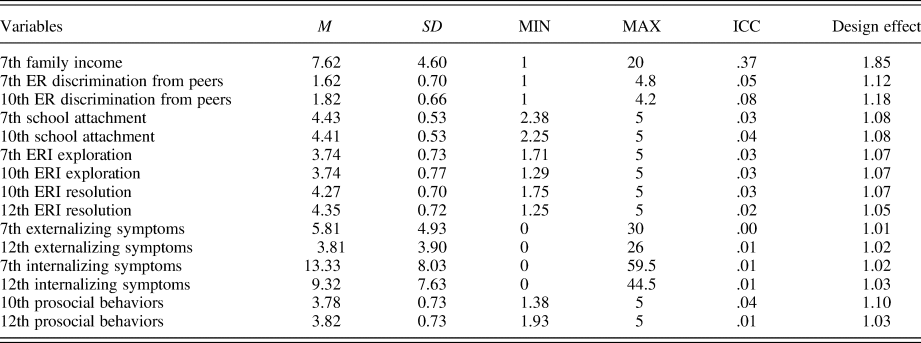
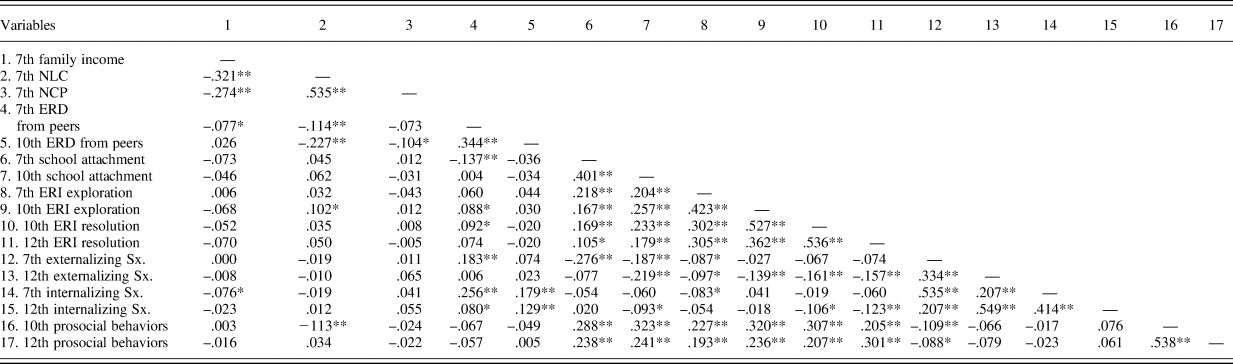
Descriptive statistics and correlations are presented in Tables 1 and 2. Neighborhood Latino concentration and concentrated poverty were positively correlated. Seventh-grade neighborhood Latino concentration was negatively associated with ethnic–racial discrimination from peers and positively associated with ethnic–racial identity exploration in 10th grade. Discrimination from peers in 10th grade was positively associated with internalizing symptoms in 12th grade. School attachment in 10th grade was positively associated with ethnic–racial identity resolution and prosocial behaviors and negatively associated with externalizing and internalizing symptoms in 12th grade. Ethnic–racial identity exploration in 10th grade was positively associated with ethnic–racial identity resolution and prosocial behaviors and negatively associated with externalizing symptoms in 12th grade.
Summary of descriptive statistics for individual-level study variables

Note: Descriptive analyses were conducted in SAS using listwise deletion. The design effect estimates the magnitude of adjustment needed to produce accurate standard errors in the presence of within-neighborhood clustering with a 1.0 corresponding to no adjustments. We also examined variable distributions and found no evidence of problematic skewness or kurtosis for the variables listed here. 7th, 7th grade. 10th, 10th grade. 12th, 12th grade. ER, ethnic–racial. ERI, ethnic–racial identity, ICC, intraclass correlation coefficient. MIN, minimum. MAX, maximum.
Summary of intercorrelations for study variables

Note: Descriptive analyses were conducted in SAS using listwise deletion. 7th, 7th grade. 10th, 10th grade. 12th, 12th grade. NLC, neighborhood Latino concentration. NCP, neighborhood concentrated poverty. ERD, ethnic–racial discrimination. ERI, ethnic–racial identity. Sx., symptoms. *p < .05. **p < .01.
Test of hypothesized model
We tested the longitudinal mediational model using path analysis in a structural equation modeling framework using Mplus 7.2 (Muthén & Muthén, Reference Muthén and Muthén2010). We examined whether neighborhood Latino concentration and concentrated poverty in 7th grade predicted ethnic–racial discrimination from peers, ethnic–racial identity exploration, and school attachment in 10th grade, controlling for prior levels (7th grade) of family income, ethnic–racial discrimination from peers, ethnic–racial identity exploration, and school attachment. We then linked 10th-grade ethnic–racial discrimination from peers, ethnic–racial identity exploration, and school attachment to adolescents’ 12th-grade externalizing and internalizing symptoms, ethnic–racial identity resolution, and prosocial behaviors. We controlled for 7th-grade levels of externalizing and internalizing symptoms, 10th-grade levels of ethnic–racial identity resolution and prosocial behaviors (given that they were not developmentally appropriate constructs nor measured at 7th grade), adolescent gender, adolescent nativity, family structure, and family income. The modicum of within-neighborhood clustering, as indicated by low numbers of adolescents within each neighborhood (mean = 3.3, median = 2.0, mode = 1.0), low intraclass correlations, and design effects less than 2.0 (Table 1), was accounted for by using the CLUSTER IS command in MPLUS. This command adjusted the standard errors for any clustering within neighborhoods. Missing data were accounted for using robust maximum likelihood, an estimation that accounts for nonnormality and nonindependence of observations (Enders, Reference Enders2010; Muthén & Muthén, Reference Muthén and Muthén2010). Fifth-grade family income, externalizing symptoms, and internalizing symptoms were included as auxiliary variables to reduce bias attributed to missingness (Enders, Reference Enders2010). MPLUS estimated path coefficients and standard errors. We then used RMediation to obtain indirect effects, standard errors of indirect effects, and confidence intervals (90% and 95% CIs) of the indirect effects (distribution-of-product method; Tofighi & MacKinnon, Reference Tofighi and MacKinnon2011). We present standardized coefficients, which can be interpreted relative to small (0.14), medium (0.39), and large (0.59) effect sizes (Fritz & MacKinnon, Reference Fritz and MacKinnon2007).
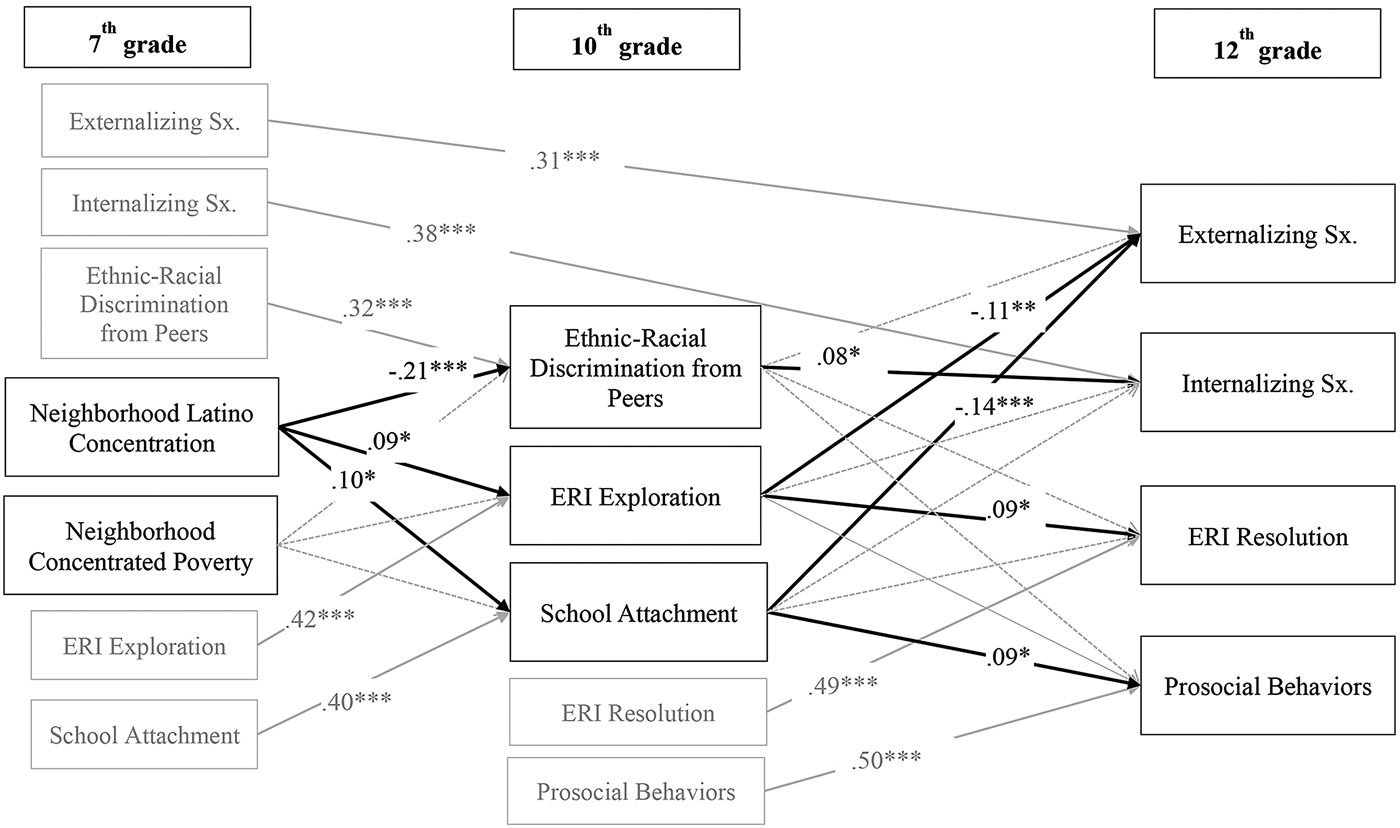
Multiple fit indices (chi-squared test, comparative fit index [CFI], root mean square error of approximation [RMSEA], and standardized root mean square residual [SRMR]) were used to assess model fit; good (acceptable) model fit is reflected by a nonsignificant chi-squared test, CFI greater than 0.95 (0.90), RMSEA less than 0.05 (0.08), and SRMR less than 0.05 (0.08; Hu & Bentler, Reference Hu and Bentler1999). Additional multigroup analyses were conducted to examine differences by adolescent gender, nativity, and family structure, given the salience of these factors vis-à-vis the costs and benefits associated with residence in segregated neighborhoods (Portes & Rumbaut, Reference Portes and Rumbaut2001). Specifically, a fully unconstrained model was compared to a partially constrained model (with mediational paths constrained) using a Satorra–Bentler scaled chi-squared difference test. A nonsignificant chi-square suggested invariance of the hypothesized paths across gender, nativity, and family structure. The test of the hypothesized model, along with model fit statistics and standardized path coefficients, is presented in Figure 2. Not shown in Figure 2, for clarity, are controls for family income effects on all endogenous variables; for gender, nativity, and family structure effects in the dependent variables; and for direct effects of neighborhood characteristics on the dependent variables. In addition, 95% CIs for the significant standardized path results are presented in text.
Test of hypothesized model linking 7th-grade neighborhood Latino concentration and neighborhood concentrated poverty to adaptive and maladaptive functioning via ethnic–racial discrimination from peers, ethnic–racial identity formation, and school attachment (n = 733). Standardized coefficients are reported. Seventh-grade family income is included as a control on all mediators and outcomes in the model. Adolescent gender, nativity, and family structure are included as controls on all outcomes in the model. For ease of presentation, controls are not included in the figure. Exogenous variables are allowed to correlate for missing data estimation. ERI, ethnic–racial identity. Sx, symptoms. Model fit: χ2 (54) = 277.77, p = .000, CFI = 0.91, RMSEA = 0.075, SRMR = 0.051. *p < .05, **p < .01. ***p < .001.

Regarding H1, and as seen in Figure 2, 7th-grade neighborhood Latino concentration predicted lower ethnic–racial discrimination from peers (95% CI [–.28, –.14]), greater ethnic–racial identity exploration (95% CI [.03, .16]), and greater school attachment (95% CI [.03, .18]) in 10th grade, accounting for prior levels of the hypothesized mediators and family income. As for the relations between 10th and 12th grades, 10th-grade ethnic–racial discrimination from peers predicted higher levels of 12th-grade internalizing symptoms (95% CI [.02, .14]); 10th-grade ethnic–racial identity exploration predicted lower levels of externalizing symptoms (95% CI [–.17, –.04]) and higher levels of ethnic–racial identity resolution (95% CI [.02, .17]) in 12th grade. Finally, 10th-grade school attachment predicted lower levels of externalizing symptoms (95% CI [–.20, –.07]) and greater prosocial behaviors (95% CI [.03, .15]) in 12th grade. These confidence intervals are consistent with small effects (Fritz & MacKinnon, Reference Fritz and MacKinnon2007). Mediational tests revealed that discrimination from peers mediated the link between 7th-grade neighborhood Latino concentration and 12th-grade internalizing symptoms (ab = –.016, SE = .009, 95% CI [–.0351, –.0005], 90% CI [–.0316, –.0029]). Ethnic–racial identity exploration and school attachment emerged as mediators of the links between 7th-grade neighborhood Latino concentration and 12th-grade externalizing symptoms (ab = –.010, SE = .006, 95% CI [–.0240, –.0007], 90% CI [–.0212, –.0017]; ab = –.014, SE = .007, 95% CI [–.0309, –.0011], CI 90% [–.0276, –.0028], respectively). There was evidence that ethnic–racial identity exploration mediated the association between 7th-grade neighborhood Latino concentration and 12th-grade ethnic–racial identity resolution (ab = .009, SE = .006, 95% CI [–.0005, .0233], 90% CI [.0005, .0203]), and school attachment mediated the link between 7th-grade neighborhood Latino concentration and 12th-grade prosocial behaviors (ab = .009, SE = .006, 95% CI [.0001, .0216], 90% CI [.0010, .0189]). Regarding H2, neighborhood concentrated poverty did not predict any of the hypothesized mediators. As a result, mediated effects from neighborhood concentrated poverty to internalizing and externalizing symptoms, ethnic–racial identity resolution, and prosocial behaviors were not evident.
Tests of model generalizability and alternative models
To examine the generalizability of our findings, we examined invariance of the hypothesized mediational model by adolescent gender, nativity, and family structure using the multigroup analyses described earlier. In these three alternative models, we dropped gender, nativity, or family structure as a control variable and used each as a grouping variable instead. Findings suggested that the mediational pathways did not differ by gender, χ2Δ (18) = 22.96, p = .19, nativity, χ2 Δ (18) = 19.47, p = .36, or family structure, χ2Δ (18) = 20.94, p = .28. Thus, the mediational pathways were an equally good fit for boys and girls, US and Mexico-born youth, and single- and two-parent families.
For a follow-up sensitivity analyses, we examined the roles of (a) 7th-grade neighborhood concentrated poverty, excluding neighborhood Latino concentration, and (b) 7th-grade neighborhood Latino concentration, excluding neighborhood concentrated poverty. In the first model, concentrated poverty predicted 10th-grade ethnic–racial discrimination from peers, B = –.08, SE = .04, p < .05, 95% CI [–.16, –.01], (in the same direction as neighborhood Latino concentration), but did not predict ethnic–racial identity exploration, B = .01, SE = .04, p = .76; 95% CI [–.06, .08], or school attachment, B = –.04, SE = .06, p = .46; 95% CI [–.15, .07]. In the second model, neighborhood Latino concentration predicted 10th-grade ethnic–racial discrimination from peers, B = –.20, SE = .04, p < .001; 95% CI [–.28, –.13], and ethnic–racial identity exploration, B = .08, SE = .04, p < .05; 95% CI [.01, .15], but did not predict school attachment, B = .05, SE = .04, p = .21; 95% CI [–.03, .13].
For additional sensitivity analyses, we explored curvilinear effects of neighborhood Latino concentration and concentrated poverty. To recognize seminal work conducted by Browning and colleagues (Browning et al., Reference Browning, Leventhal and Brooks-Gunn2005; Jackson et al., Reference Jackson, Browning, Krivo, Kwan and Washington2016), which, though not specific to Mexican-origin samples, has repeatedly documented curvilinear effects of neighborhood Latino and immigrant concentrations, we examined the possibility of a quadratic effect of neighborhood Latino concentration and neighborhood concentrated poverty on the hypothesized mediators. The inclusion of a quadratic effect would examine whether the association between neighborhood socioeconomic and ethnic–racial structural characteristics and putative mediators were nonlinear (e.g., if there were a ceiling effect). The quadratic effects of 7th-grade neighborhood Latino concentration on 10th-grade ethnic–racial discrimination from peers, B = –.01, SE = .04, p = .83; 95% CI [–.09, .08], ethnic–racial identity exploration, B = –.01, SE = .04, p = .91; 95% CI [–.09, .08], and school attachment, B = –.05, SE = .04, p = .27; 95% CI [–.13, .04], were not significant. Similarly, the quadratic effects of 7th-grade neighborhood poverty on 10th-grade ethnic–racial discrimination from peers, B = .023, SE = .032, p = .47; 95% CI [–.04, .09], ethnic–racial identity exploration, B = –.024, SE = .037, p = .52; 95% CI [–.10, .05], and school attachment, B = –.070, SE = .054, p = .20; 95% CI [–.18, .04], were not significant.
Discussion
In this study of Mexican-origin adolescents, and consistent with the conceptual model presented in Figure 1a, we examined three aspects of adolescents’ community participation and engagement via which the socioeconomic and ethnic–racial structural characteristics of residential neighborhood environments might influence both maladaptive (i.e., internalizing and externalizing symptoms) and adaptive functioning (i.e., ethnic–racial identity resolution and prosocial behaviors). Our aspects of adolescents’ community participation and engagement included ethnic–racial identity exploration, ethnic–racial discrimination from peers, and school attachment. Findings supported several mediational mechanisms that were consistent with organizing and consonant influences of neighborhood Latino concentration for Mexican-origin adolescents’ developmental outcomes. Findings empirically downplayed the role of neighborhood concentrated poverty as a factor that influences ethnic–racial identity exploration, ethnic–racial discrimination from peers, and school attachment, or the aspects of adaptive and maladaptive functioning examined herein. All findings replicated across adolescent nativity, gender, and household structure and the majority of findings replicated across critical alternative model specifications. Thus, the current study uses the roadmap for integrating culture into development and psychopathology (Causadias, Reference Causadias2013), alongside sociological perspectives relative to the organizing or disorganizing structural features of neighborhood environments (Portes & Rumbaut, Reference Portes and Rumbaut2001; Sampson et al., Reference Sampson, Raudenbush and Earls1997), to address major gaps in scientific understandings of the mechanisms via which residential socioeconomic and ethnic–racial structural characteristics impact adaptive and maladaptive functioning.
H1: Neighborhood ethnic–racial structural characteristics and adolescents’ developmental outcomes: The mediating roles of ethnic–racial identity exploration, ethnic–racial discrimination from peers, and school attachment
Our conceptual model suggested that neighborhood structural characteristics would influence developmental outcomes via adolescents’ participation and engagement with multiple cultural communities. Based on the theory and empiricism reviewed, we specifically expected early adolescent neighborhood Latino concentration to promote late adolescent ethnic–racial identity resolution and prosocial behaviors and mitigate internalizing and externalizing symptoms via middle adolescent increases in ethnic–racial identity exploration and decreases in ethnic–racial discrimination from peers (H1). Our hypotheses (H1) were partially supported. Consistent with our expectations, early adolescent neighborhood Latino concentration predicted lower levels of ethnic–racial discrimination from peers and higher levels of ethnic–racial identity exploration. Beyond our specific expectations, we also found that neighborhood Latino concentration promoted school attachment. These aspects of adolescents’ engagement in their cultural, peer, and school communities, in turn, predicted aspects of adaptive and maladaptive functioning, though the specific associations varied.
First, ethnic–racial identity exploration during middle adolescence mediated the association between early adolescent neighborhood Latino concentration and later adolescent outcomes. Specifically, higher neighborhood Latino concentration levels were associated with lower externalizing symptoms and higher ethnic–racial identity resolution via intermediate increases in ethnic–racial identity exploration. These findings offer important extensions to prior work that only examined cross-sectional or longitudinal segments of the mediational process, did not control for levels of neighborhood concentrated poverty, and did not explore multiple aspects of adolescents’ community participation and engagement and multiple indicators of adaptive and maladaptive functioning (e.g., White, Knight, et al., Reference White, Knight, Jensen and Gonzales2018).
Neighborhoods that are high on Latino concentration are likely to be socially organized (Browning et al., Reference Browning, Leventhal and Brooks-Gunn2005, Reference Browning, Burrington, Leventhal and Brooks-Gunn2008; Sampson et al., Reference Sampson, Raudenbush and Earls1997) and maintain culturally supportive institutional resources, social infrastructures, and behavioral norms (Yoshikawa, Reference Yoshikawa2011) that provide Latino adolescents with organized, supportive, and consonant (Portes & Rumbaut, Reference Portes and Rumbaut2001; Sampson et al., Reference Sampson, Raudenbush and Earls1997) opportunities to develop their cultural selves (Feinauer & Whiting, Reference Feinauer and Whiting2012; Stevenson & Arrington, Reference Stevenson and Arrington2009; White et al., Reference White, Zeiders, Knight, Roosa and Tein2014). Our current findings suggest that these neighborhood environments specifically support adolescents to engage in the process of ethnic–racial identity exploration. That is, Mexican-origin youth who are living in neighborhoods that are predominated by other (mostly Mexican) coethnic group members are seeking or being exposed to information about their ethnic–racial group through, for example, participation in events and activities (Umaña-Taylor, Reference Umaña-Taylor2016). Our findings are in contrast to those of Supple et al. (Reference Supple, Ghazarian, Frabutt, Plunkett and Sands2006), who found no association between neighborhood Latino concentration and ethnic–racial identity exploration, but their data set contained a restricted range of neighborhood Latino concentration. As noted earlier, a failure to attend to issues of sample range in research on neighborhood ethnic and racial structural characteristics can lead to inconsistent findings, as can use of other measures, others designs, and sample characteristics. Several other findings in the extant literature have focused on ethnic–racial identity attitudes (Hurd, Sellers, Cogburn, Butler-Barnes, & Zimmerman, Reference Hurd, Sellers, Cogburn, Butler-Barnes and Zimmerman2012; Oyserman & Yoon, Reference Oyserman and Yoon2009; Rivas-Drake & Witherspoon, Reference Rivas-Drake and Witherspoon2013), which were not examined in the current study, but certainly merit additional investigation in future work.
Extending further beyond the prior findings, the current study demonstrates that the benefits that neighborhood Latino concentration has for ethnic–racial identity exploration go on to predict higher ethnic–racial identity resolution and lower externalizing symptoms. The finding that Mexican-origin adolescents’ ethnic–racial identity exploration predicts higher levels of ethnic–racial identity resolution replicates and extends (across a wider developmental span and outside the constraints of experimental methods) prior experimental research with an ethnically and racially diverse sample of US adolescents (Umaña-Taylor et al., Reference Umaña-Taylor, Douglass, Updegraff and Marsiglia2017). Further, the finding that exploration predicts lower levels of externalizing symptoms is consistent with prior conclusions from systematic reviews of the literature (Rivas-Drake et al., Reference Rivas-Drake, Seaton, Markstrom, Quintana, Syed, Lee and Yip2014; Umaña-Taylor, Reference Umaña-Taylor2016) and replicates and extends prior cross-sectional work with Mexican-origin adolescents (Umaña-Taylor et al., Reference Umaña-Taylor, O'Donnell, Knight, Roosa, Berkel and Nair2013) and longitudinal work with Mexican-origin teen mothers (Umaña-Taylor, Updegraff, Jahromi, & Zeiders, Reference Umaña-Taylor, Updegraff, Jahromi and Zeiders2015). There are, however, several unique contributions of this study. To our knowledge, this is the first study that tests and documents a longitudinal mediated association from neighborhood Latino concentration to ethnic–racial identity exploration and later resolution across three times points. It also controls for family income and earlier levels of the mediators and the dependent variables. In this way, our findings suggest that living in ethnically–racially concentrated neighborhoods may provide ethnic–racial minority adolescents with important opportunities to explore their ethnic–racial group membership, develop a clearer sense of what their ethnic–racial group membership means, and, consistent with developmental theory (Erikson, Reference Erikson1968), experience related psychological benefits, including lower externalizing symptoms.
Second, perceptions of ethnic–racial discrimination in peer interactions during middle adolescence mediated the association between early adolescent neighborhood Latino concentration and later adolescent internalizing, such that higher neighborhood Latino concentration levels were associated with lower internalizing symptoms via intermediate decreases in ethnic–racial discrimination from peers. Though the link from neighborhood Latino concentration to ethnic–racial discrimination from peers is consistent with prior examinations spanning adolescents from different ethnic–racial backgrounds (Bécares et al., Reference Bécares, Cormack and Harris2013; Hurd, Stoddard, et al., Reference Hurd, Stoddard and Zimmerman2012; Martin et al., Reference Martin, McCarthy, Conger, Gibbons, Simons, Cutrona and Brody2011; Stewart et al., Reference Stewart, Baumer, Brunson and Simons2009; White, Burleson, et al., Reference White, Burleson, Knight, Crockett and Carlo2016; White, Knight, et al., Reference White, Knight, Jensen and Gonzales2018), the current study extends those observed benefits to lower internalizing symptoms three years later. Further, the current empirical findings corroborate theoretical and conceptual ideas about how ethnically and racially concentrated neighborhoods and environments can support critical access to the within-group that helps to shelter members, in this case, developing adolescents, from discrimination and marginalization in ways that have important implications for positive adjustment (García Coll et al., Reference García Coll, Crnic, Lamberty, Wasik, Jenkins, Garcia and McAdoo1996; Portes & Rumbaut, Reference Portes and Rumbaut2001). These findings conceptually replicate some of Hurd, Stoddard, et al.’s (Reference Hurd, Stoddard and Zimmerman2012) prior cross-sectional findings and extend them by use of a longitudinal design alongside exploration of additional aspects of adolescents’ community participation and engagement and adaptive and maladaptive functioning.
Generally, the costly implications of ethnic–racial discrimination vis-á-vis adaptive and maladaptive functioning are well documented, including implications for both externalizing and internalizing spectrum problems (Priest et al., Reference Priest, Paradies, Trenerry, Truong, Karlsen and Kelly2013). In the current study, however, ethnic–racial discrimination from peers only predicted declines in internalizing symptoms (not externalizing symptoms) among Mexican-origin adolescents. It is important to note that most prior work examining discrimination to externalizing symptoms has utilized cross-sectional designs and/or focused on African American youth (Priest et al., Reference Priest, Paradies, Trenerry, Truong, Karlsen and Kelly2013). In more recent work with Mexican-origin adolescents specifically, the longitudinal link between discrimination and externalizing has either not emerged (Delgado, Nair, Updegraff, & Umaña-Taylor, Reference Delgado, Nair, Updegraff and Umaña-Taylor2017), not emerged when considering other stressors (Berkel et al., Reference Berkel, Knight, Zeiders, Tein, Roosa, Gonzales and Saenz2010; Zeiders, Umaña-Taylor, Updegraff, & Jahromi, Reference Zeiders, Umaña-Taylor, Updegraff and Jahromi2015), or has been dependent upon other contextual considerations (Brittian, Toomey, Gonzales, & Dumka, Reference Brittian, Toomey, Gonzales and Dumka2013). Our findings align with these longitudinal studies, suggesting that discrimination may be most salient for long-term changes in internalizing symptoms among Mexican-origin adolescents. However, future research capturing other contextual considerations and other sources of ethnic–racial discrimination (e.g., adults) is needed to understand under which conditions discrimination predicts externalizing symptoms. Ultimately, links between the ethnic–racial structural characteristics of early-adolescents’ neighborhoods to middle adolescent ethnic–racial discrimination from peers and later adolescent internalizing suggest that residence in neighborhood predominated by the within-group may protect adolescents from ethnic–racial minority groups from marginalizing experiences during peer interactions and that such protections pay off in the form of lower internalizing symptoms.
Third, we explored whether school attachment might mediate the association between neighborhood ethnic concentration and adaptive and maladaptive functioning in beneficial or costly ways. Segmented assimilation perspectives recognize that ethnically concentrated, socially organized, and ethnoculturally consonant neighborhoods often exist alongside poorly resourced institutions and within a mainstream society that supports oppressive structures and institutions capable of promoting inequality (Portes & Rumbaut, Reference Portes and Rumbaut2001) and marginalizing and devaluing students from ethnic–racial minority groups (Guarino et al., Reference Guarino, Santibanez and Daley2006; Spencer, Reference Spencer2006). Further, segmented assimilation perspectives suggested that any costs to institutional bonding that may be associated with living in segregated neighborhood environments would be amplified for US-born youth (Kulis et al., Reference Kulis, Marsiglia, Sicotte and Nieri2007; Portes & Rumbaut, Reference Portes and Rumbaut2001). These hypotheses, however, were not supported in the current study. School attachment during middle adolescence mediated the association between early adolescents’ neighborhood Latino concentration and two later-adolescent outcomes in beneficial ways. Specifically, higher neighborhood Latino concentration levels predicted lower externalizing symptoms and higher prosocial behaviors via intermediate increases in school attachment.
Prior empirical evidence regarding the possibility of school attachment as a mediator of neighborhood ethnic–racial structural characteristic effects on adolescent development was inconclusive. Stewart et al. (Reference Stewart, Stewart and Simons2007) focused specifically on the importance of higher education among African American adolescents, finding that racially and socioeconomically segregated neighborhoods were associated with less importance of higher education. That study, however, did not separate racial from socioeconomic structural characteristics. Similarly, Oyserman and Yoon (Reference Oyserman and Yoon2009) found that relative segregation was associated with lower embedded achievement (cross-sectionally), a social identity construct that includes school and academic engagement. In the current study, however, we did not find that neighborhood Latino concentration undermined school attachment. Instead, our findings offer a better comparison to Benner and Wang's findings (Reference Benner and Wang2014). Their research highlighted the importance of having access to same-ethnic peers (in the academic environment) for school attachment. Our findings compliment and extend theirs by showing that access to same-ethnic community members in neighborhood settings helps to promote school attachment, an important component of school bonding and institutional integration during adolescence (Benner & Wang, Reference Benner and Wang2014; Catalano et al., Reference Catalano, Oesterle, Fleming and Hawkins2004; Kirk, Reference Kirk2009). Further, our community-based sample of Mexican-origin adolescents were diverse on socioeconomic and cultural backgrounds (Roosa et al., Reference Roosa, Liu, Torres, Gonzales, Knight and Saenz2008), and we were able to control for earlier levels of school attachment when examining the prospective associations, design elements in the current study that address key limitations outlined in Benner and Wang's (Reference Benner and Wang2014) study.
The benefits of school attachment, with special salience for externalizing symptoms and prosocial behaviors, were consistent with our hypotheses. Our findings replicate and extend prior work regarding the benefits of school attachment and bonding for adaptive and maladaptive functioning (Catalano et al., Reference Catalano, Oesterle, Fleming and Hawkins2004; Gonzales, Germán, et al., Reference Gonzales, Germán, Fabrett, Chang and Downey2012). New to this study, however, we found that middle adolescent school attachment levels mediated the association between early adolescents’ neighborhood Latino concentration and late adolescent externalizing and prosocial behaviors. The developmental benefits of high neighborhood Latino concentration for dire, emotional, and compliant prosocial behaviors addresses prior calls for such research (Carlo, Reference Carlo, Killen and Smetana2014) and substantially extends prior cross-sectional work (mostly outside the United States) linking organized neighborhood environments to general prosocial behaviors (Lenzi et al., Reference Lenzi, Vieno, Perkins, Pastore, Santinello and Mazzardis2012; Romano et al., Reference Romano, Tremblay, Boulerice and Swisher2005; Wilson et al., Reference Wilson, O'Brien and Sesma2009). Having higher access to coethnic community members in predominantly Latino neighborhoods may offer an important ethnocultural match for Mexican-origin adolescents that meets normative developmental needs for organized, consonant, and supportive settings (Benner & Wang, Reference Benner and Wang2014; Bronfenbrenner & Morris, Reference Bronfenbrenner, Morris and Lerner2006; Wachs, Reference Wachs1979). In addition, shared norms and community socialization around parental authority and familial obligations (Gonzales et al., Reference Gonzales, Coxe, Roosa, White, Knight, Zeiders and Saenz2011; Martinez et al., Reference Martinez, Lee and Nielsen2004), alongside socialization that emphasizes the student role as an important component of adolescents’ community participation and engagement (Flores-González, Reference Flores-González2002), may facilitate adolescents’ ability to bond to the institution of school and schooling and, by facilitating conformity (Hirshi, 2002), promote prosocial behaviors.
Our findings contrast some prior work and perspectives, raising important considerations. First, some perspectives and work highlight problems that schools in lower resourced, segregated neighborhoods have with teacher qualifications and how such characteristics can undermine children's school bonding and attachment (Catalano et al., Reference Catalano, Oesterle, Fleming and Hawkins2004; Guarino et al., Reference Guarino, Santibanez and Daley2006; Spencer, Reference Spencer2006). Though we did not assess teacher qualifications, we did not find evidence that school attachment was lower among adolescents living in more Latino segregated neighborhoods. One important consideration is that the geographic area in which the current study took place has a long history of Mexican and Mexican-origin settlement. It is important to consider that our school attachment findings may not generalize to geographic areas with more emerging settlement patterns, where institutional adaptations supporting inclusion are restricted or delayed. A second important consideration is that the positive association between neighborhood Latino concentration and school attachment did not generalize in alternative models where we did not control for neighborhood concentrated poverty. Thus, only when partialing out the effects of neighborhood concentrated poverty did we observe this association. Contrary to some prior work in this area (e.g., Oyserman & Yoon, Reference Oyserman and Yoon2009; Stewart et al., Reference Stewart, Stewart and Simons2007), future work may consider examining hypotheses related to neighborhood concentrated poverty and ethnic–racial concentrations in samples of neighborhoods that vary on both characteristics.
H2: Neighborhood concentrated poverty, and adolescents’ developmental outcomes: The mediating roles of ethnic–racial identity exploration, ethnic–racial discrimination from peers, and school attachment
Based on our conceptual model, we examined whether neighborhood concentrated poverty would influence developmental outcomes via adolescents’ participation and engagement with multiple cultural communities. Though the patterns of our theoretical (Portes & Rumbaut, Reference Portes and Rumbaut2001) and empirical review downplayed the salience of concentrated poverty for Mexican-origin adolescents’ discrimination from peers and ethnic–racial identity exploration, we hypothesized that lower levels of school attachment would mediate the effects of neighborhood concentrated poverty on internalizing and externalizing symptoms and prosocial behaviors. Consistent with our expectations, neighborhood concentrated poverty did not emerge as a salient predictor of adolescents’ adaptive and maladaptive functioning via the intermediate ethnic–racial identity exploration and ethnic–racial discrimination from peers. Contrary to our hypotheses (H2), however, neighborhood concentrated poverty also did not have implications for adaptive and maladaptive functioning via adolescents’ school attachment. This finding held when neighborhood concentrated poverty was considered alongside neighborhood Latino concentration, and in alternative model specifications when it was considered alone.
Consistent with segmented assimilation's de-emphasis on the socioeconomic structural characteristics of ethnically concentrated communities (Burchfield & Silver, Reference Burchfield and Silver2013), the current longitudinal findings also de-emphasize the salience of neighborhood concentrated poverty for Mexican-origin adolescents’ ethnic–racial identity exploration, ethnic–racial discrimination from peers, and school attachment, as well as for internalizing and externalizing symptoms, ethnic–racial identity resolution, and prosocial behaviors. Several prior investigations with Mexican-origin and Latino populations, including youth and adults, have also demonstrated few or inconsistent effects of neighborhood concentrated poverty on development, health, and well-being (Eschbach, Ostir, Patel, Markides, & Goodwin, Reference Eschbach, Ostir, Patel, Markides and Goodwin2004; Frank et al., Reference Frank, Cerda and Rendon2007; Gonzales et al., Reference Gonzales, Coxe, Roosa, White, Knight, Zeiders and Saenz2011; Pearl, Braveman, & Abrams, Reference Pearl, Braveman and Abrams2001). Such findings do not rule out other aspects of socioeconomic inequality as important for Mexican-origin adolescents’ development. Further, neighborhood concentrated poverty may matter for other aspects of adolescents’ community participation and engagement, or other aspects of adaptive and maladaptive functioning. Recent frameworks highlighting the ways that communities’ adapting cultural systems calibrate and respond to environmental circumstances (White, Nair, et al., Reference White, Nair and Bradley2018) may help to support critically needed research in this area.
Conclusions and future directions
In the current study, we sought to address gaps in scholarship related to how the socioeconomic and ethnic–racial structural characteristics of neighborhood environments, which are reflections of broader sociocultural processes related to residential segregation (Macartney et al., Reference Macartney, Bishaw and Fontenot2013; Reardon et al., in press), relate to both adaptive and maladaptive functioning among Mexican-origin adolescents. We drew from both sociological perspectives (Portes & Rumbaut, Reference Portes and Rumbaut2001; Sampson et al., Reference Sampson, Raudenbush and Earls1997) and culture, development, and psychopathology perspectives (Causadias, Reference Causadias2013) to advance a series of hypotheses about how different developmentally and culturally salient aspects of adolescents’ community participation and engagement explain how neighborhood structural characteristics influence adolescents’ adaptive and maladaptive functioning. We found that living in neighborhoods predominated by within-group members promoted more positive and less negative forms of adolescents’ community participation and engagement. We found that, via higher cultural promoting factors (Causadias, Reference Causadias2013), including ethnic–racial identity exploration and school attachment, and lower cultural risk factors (Causadias, Reference Causadias2013), including ethnic–racial discrimination from peers, these neighborhoods also promoted greater adaptive and less maladaptive functioning.
Several limitations exist alongside study strengths. First, though we drew from multiple data sources, reporters, and waves, a few of the longitudinal associations tested involved single reporters (i.e., adolescent-only reports on all mediators and adolescent-only reports on ethnic–racial identity resolution and prosocial behaviors). Fortunately, in all of these cases we were able to control for earlier assessments of the same-reporter variables, a design element that would substantially reduce, but perhaps not eliminate, the influence of shared method variance. Second, though we included several covariates commonly used to reduce the impact of neighborhood selection effects (i.e., family income, nativity, family structure, and earlier scores on the mediators and the developmental outcomes), only true experimental designs can eliminate the neighborhood selection confound (Dupere et al., Reference Dupere, Leventhal, Crosnoe and Dion2010). Third, although we capitalized on direct assessment (Causadias, Reference Causadias2013) of three aspects of adolescents’ community participation and engagement relative to multiple cultural communities that exist within the adolescent ecology (ethnic–racial cultural community, peer cultural community, and school cultural community), we were not able to explore neighborhood-level social processes that may also serve as intervening mechanisms. Future work should consider such mechanisms. Fourth and finally, we did not focus on the family-level mediators in the current study because our prior work with these data suggests that parenting and family mediators do not explain the benefits of culturally consonant neighborhoods for Mexican-origin adolescent development (Gonzales et al., Reference Gonzales, Coxe, Roosa, White, Knight, Zeiders and Saenz2011). Further, our prior work also shows that many of the associations between neighborhood context and the mediators in the current study hold above and beyond parents’ ethnic–racial socialization (White, Knight, et al., Reference White, Knight, Jensen and Gonzales2018) and parents’ ethnic and heritage cultural orientations (White et al., Reference White, Updegraff, Umaña-Taylor, Zeiders, Perez-Brena and Burleson2017). Still, future work should examine important intersections between families and neighborhoods more directly (see Noah, Reference Noah2016, for suggestions).
We measured neighborhood Latino concentration in a sample of neighborhoods in a Southwestern city and state that was predominated by non-Latino Whites and Latinos of Mexican descent (Diaz McConnell & Skeen, Reference Diaz McConnell and Skeen2009). In this sample, high scores on neighborhood Latino concentration corresponded to ethnically concentrated Latino neighborhoods and low scores frequently corresponded to predominantly non-Latino White neighborhoods. On the one end of the continuum, predominantly Latino neighborhoods may be important places in which Mexican-origin youth can participate and engage in their ethnic–-racial communities, their peer communities, and the school communities in positive ways (García Coll et al., Reference García Coll, Crnic, Lamberty, Wasik, Jenkins, Garcia and McAdoo1996). On the other end, predominantly non-Latino White neighborhoods may be inhibiting (García Coll et al., Reference García Coll, Crnic, Lamberty, Wasik, Jenkins, Garcia and McAdoo1996) if they erode the content and quality of adolescents’ experiences in these communities. Thus, it is likely that both access to the within-group and shelter from marginalizing experiences in non-Latino White neighborhoods are dual underlying mechanisms. Understanding both sides of this continuum will be critical to supporting meaningful policy and program efforts to address residential segregation. Continuation of policies that promote ethnic–racial and socioeconomic segregation remain indefensible. We encourage thoughtful policies and programs that expand beyond a deficit view of minority neighborhoods. Programs that focus on investing resources (institutional and socioeconomic) in existing neighborhoods may be needed. Similarly, it may be important to extend beyond a strengths-based view of non-Latino White neighborhoods to consider more nuanced perspectives. For example, practitioners working with adolescents of color living in predominantly White neighborhoods may need to consider that such neighborhoods may provide the ecological structures within which youth of color are more likely to experience discrimination from peers and less likely to explore their ethnic–racial identities and form positive school attachments. As a result, programs to combat residential segregation will likely need to address diversity and inclusion in neighborhoods predominated by non-Latino Whites.
Consistent with our overarching aim to theorize the interplay of culture, development, and psychopathology in neighborhood contexts, the current study addressed three of the four major guidelines for integrating culture into development and psychopathology (Causadias, Reference Causadias2013). First, we considered cultural processes at multiple layers of the nested ecological system, including aspects of adolescents’ participation and engagement with the ethnic–racial cultural community (ethnic–racial identity exploration), the peer cultural community (ethnic–racial discrimination from peers) and the school cultural community (school attachment). We also considered neighborhood structural characteristics (concentrated poverty and Latino concentration) that are, in part, a reflection of societal-level cultural processes related to residential segregation. Second, we drew from culturally informed understandings about how such processes work at each layer of the ecology and offered direct assessment of them. Third, we examined cultural development, including the development of a cultural self (ethnic–racial identity resolution) and development of prosocial behaviors (i.e., dire, emotional, and compliant) consistent with heritage cultural scripts and notions of competence (e.g., Fuller & García Coll, Reference Fuller and García Coll2010; White, Nair, et al., Reference White, Nair and Bradley2018). In future work researchers may wish to explore other sociocultural mechanisms, including those that take place in the family and those that are operationalized at diverse levels (e.g., the neighborhood level), and to explore other indicators of adaptive and maladaptive functioning. Finally, neighborhood effects research may benefit from incorporating the fourth major guideline, namely, examining the interplay of biology (Causadias, Reference Causadias2013). Consistent with broad notions about the benefits of socially organized, consonant, and supportive environments for development (Bronfenbrenner & Morris, Reference Bronfenbrenner, Morris and Lerner2006), alongside models that recognize how adapting cultural systems of socialization work to promote development vis-à-vis opportunities and constraints encountered by bounded groups and communities (White, Nair, et al., Reference White, Nair and Bradley2018), we found substantial evidence that predominantly Latino neighborhoods help to structure Mexican-origin adolescents’ community participation and engagement in ways that promote adaptive and mitigate maladaptive functioning.