1. Introduction
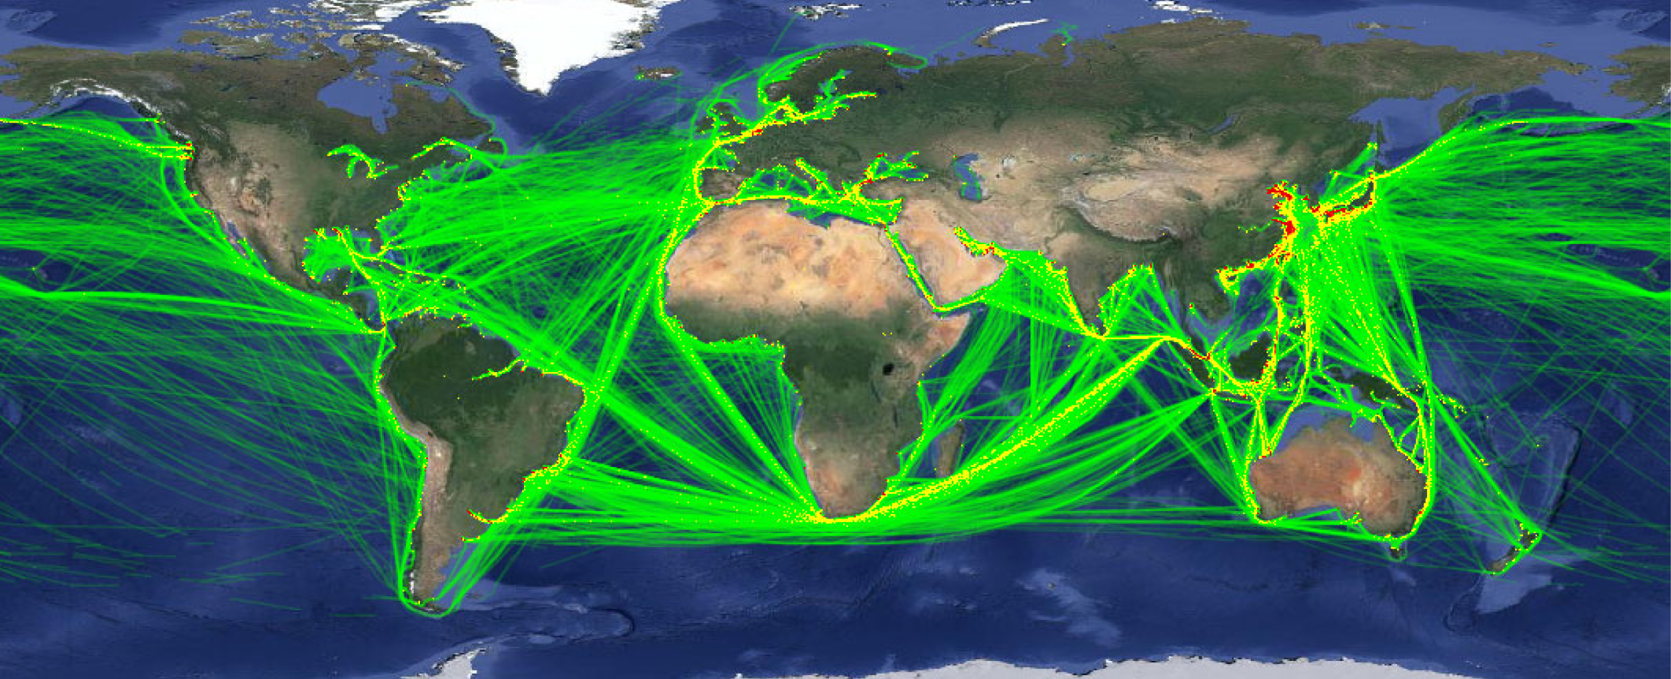
According to the SOLAS (International Convention for Safety of Life at Sea) convention, since 2002 an increasing number of ships have been required to install automatic identification system (AIS) equipment onboard. A large volume of data provides new ideas and methods for the application of AIS trajectory data to guarantee the safety and efficiency of maritime transportation, which has become an active research topic with the development of big data analysis techniques. With the growing maturity of the AIS system, the universality and availability of AIS data are well ensured. A huge amount of ship AIS track data has been accumulated (Figure 1 from www.hifleet.com). In 2018, HiFleet received a total of 838,044 (MSSI numbers between 200,000,000–899,999,999) ships from around the world on an average day using its more than 3,000 shore-based AIS stations and 58 AIS satellites. It is possible to get AIS data worldwide with 150,000,000 vessel positions reported.
Bulk carriers AIS heat map in January 2017

Ship AIS trajectory data can describe the spatial position and attributes of a ship over time, which contains a large amount of information, such as human factors of the ship officer, manoeuvrability of the ship, geographical characteristics, International Regulations for Preventing Collisions at Sea (COLREGS), good seamanship, common practices at sea and personal driving preferences of the ship officer. It is possible to obtain potential information via analysing the ship trajectory that reflects the regularity of the ship and to identify the ship's handling behaviour and navigation characteristics. Therefore, the biggest challenge in the current research process based on the massive amount of ship AIS data is not the lack of research data but the fact that no method has yet been found to properly handle and effectively apply these massive data.
Big data are a new stage in modern information technology development. With the exponential growth of global ship data, many countries consider big data as a type of economic digitisation that forms an important measure to achieve innovative development. Currently, the development of world science and technology has progressed from the previous information technology (IT) era to the data processing technology era (data technology, DT). The advent of the DT era also highlights higher requirements for data usage. According to McKinsey Global Institute (James et al., Reference James, Michael, Brad, Jacques, Richard, Charles and Angela2011), big data is a large-scale data collection that greatly exceeds the capabilities of traditional database software tools in terms of the acquisition, storage, management and analysis, with four characteristics of big data being processing massive scales of data, fast data transfer, diverse data types and low-value density. Thus, significant requirements are highlighted for the extraction ability of potential knowledge in data, and data mining efficiency is now of significant concern to researchers (Yang, Reference Yang2016).
Knowledge extraction and mining are not only a summary of previous regular knowledge but also a process for researchers to better understand the laws of things and improve the accuracy of learning new knowledge. There is an urgent problem in data research concerning how to mine and extract useful knowledge from massive data. Because of the widespread application of automatic identification system (AIS) technology, it has become easier to obtain ship information that was previously difficult to obtain. There used to be a significant distinction between maritime navigation and land transportation. The route in land transportation is surrounded by clear obstacles, and there are obvious roads; however, there is no clear path at sea. In many cases, although there are no obstacles between two locations, it is still possible that the ships do not pass right through anticipated paths. Thus, there exists an invisible network of paths at sea, a framework similar to customary routes produced by crews navigating according to their own experience as well as their piloting habits.
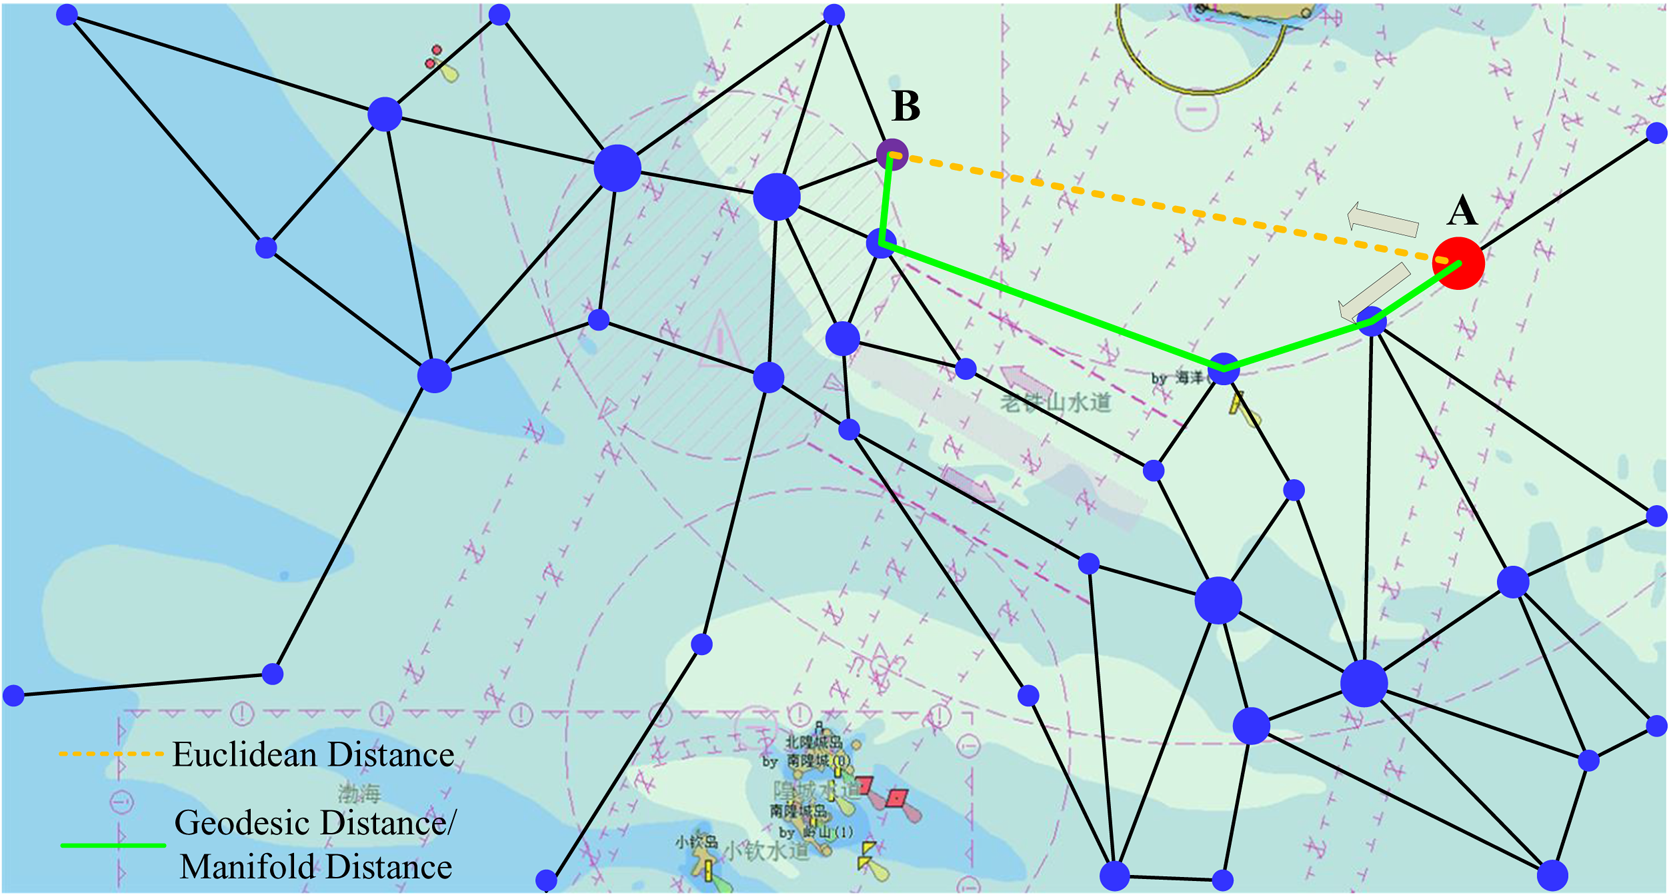
Previously, ship route planning and sailing distance calculations were based on the geographic straight-line distance and did not consider the ship actual navigation tendencies. Thus, in many cases, the planned route significantly differs from the actual sailing route, and the route's navigability was not carefully considered. Therefore, this study conducts a high-density path search based on AIS data, constructs a maritime traffic flow based on ship AIS data to extract the ship navigable route framework (SNRF), and obtains a new method for measuring the navigable manifold distance (MD) at sea. Figure 2 shows that it is more reasonable to conduct several follow-up studies based on the extracted framework, which is closer to the actual sailing application scenarios.
Comparison of geodesic/manifold distance and Euclidean distance

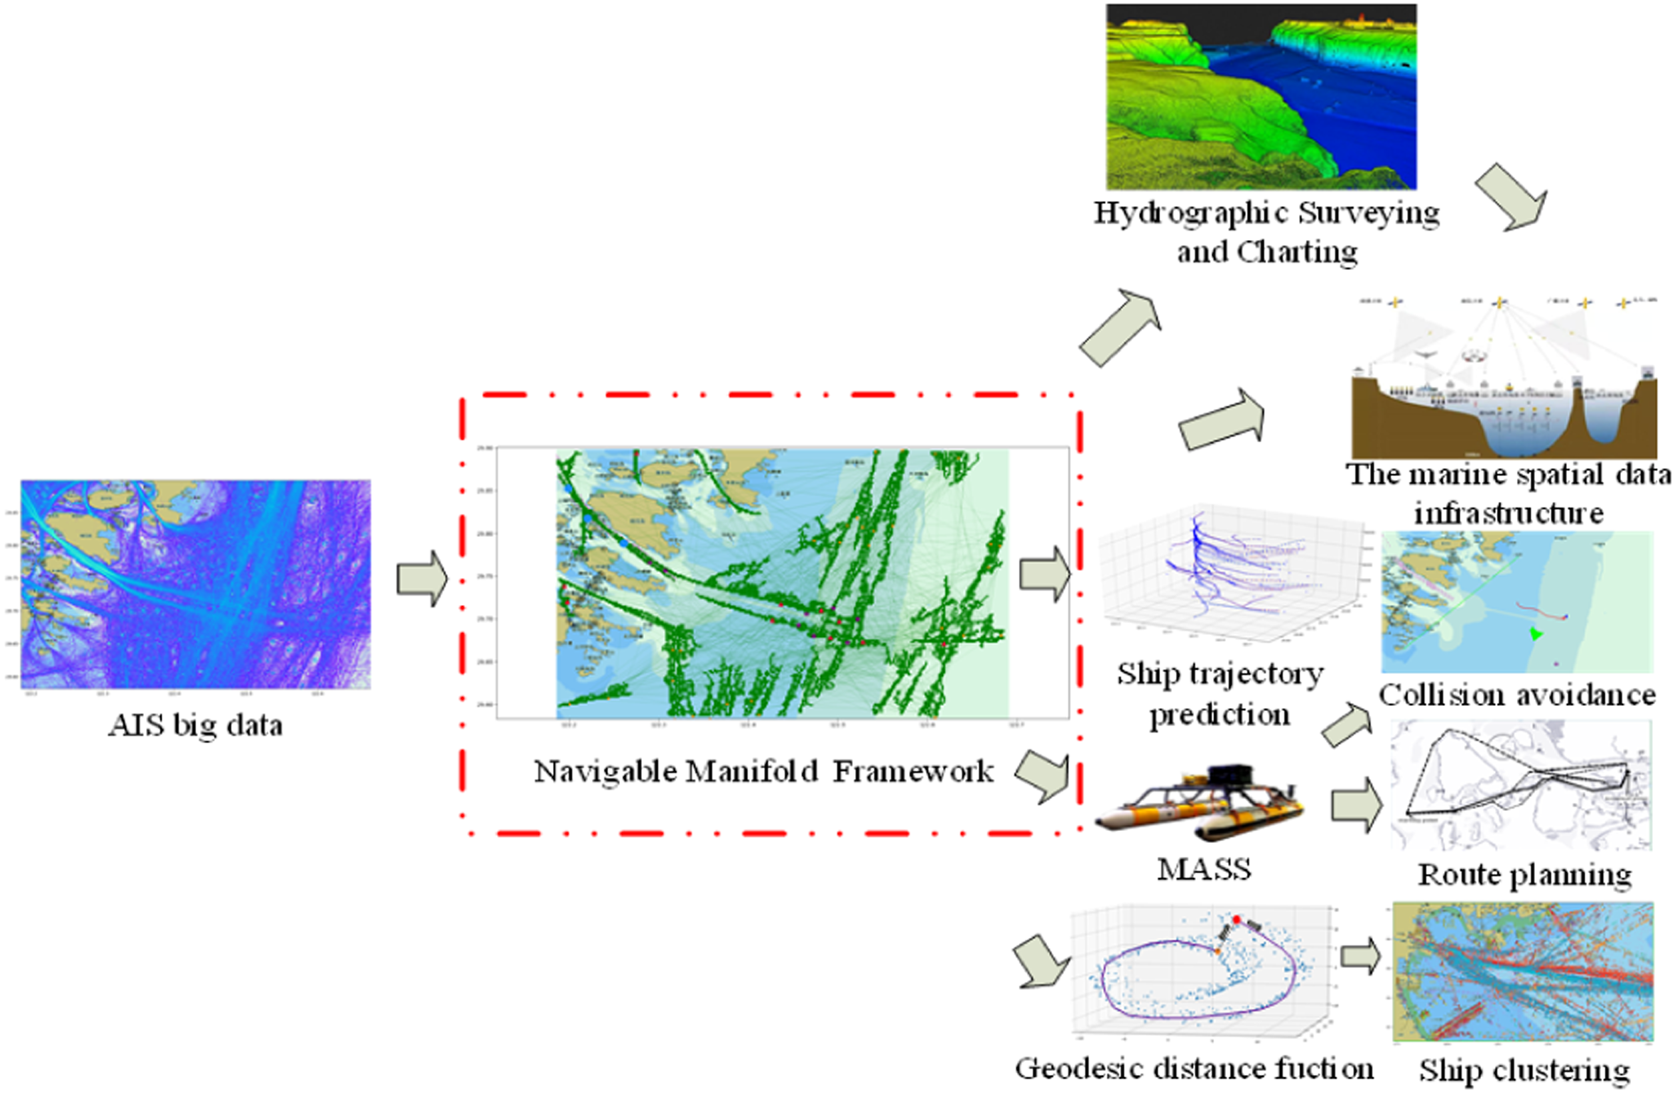
The SNRF extracted from a trajectory plays an extremely important role in the study of navigation safety guarantee. Most of the research on AIS big data is performed using a SNRF, such as ship trajectory prediction (Gao et al., Reference Gao, Shi and Li2018; Jiang et al., Reference Jiang, Duan, Huang, Han and Ma2020; Liu et al., Reference Liu, Duan, Huang, Duan and Ma2020), ship clustering (Gao et al., Reference Gao and Shi2020b), route planning (Lee et al., Reference Lee, Roh, Kim, Jung and Park2018; Zhang et al., Reference Zhang, Zhang, Zhang and Mao2019), Maritime Autonomous Surface Ships (MASS) collision avoidance (Gao et al., Reference Gao and Shi2020a; Wang et al., Reference Wang, Zhang and Li2020), data mining (Zhu, Reference Zhu2011; Gao and Shi, Reference Gao and Shi2019), hydrographic surveying and charting (Azuike et al., Reference Azuike, Pe'Eri, Alexander, Parrish and Armstrong2012; Chang, Reference Chang2014), and construction of marine spatial data infrastructure (Gillespie, Reference Gillespie2001; Çetin et al., Reference Çetin, Halil, Necati and Özgül2008) (Figure 3). In this study, the SNRF obtained from mining AIS data can objectively reflect the habits of ships in the water area and good navigation conditions near the route, and can provide navigation safety for ships sailing in the water area. The SNRF also accurately represents the accessibility between route nodes and provides safe and reliable route planning for navigating ships. In addition, it has an important reference value for relevant maritime authorities to conduct supervision and set up the recommended waterways.
Multiple applications for navigable geodesic/manifold distance framework

2. Related work
Some researchers have studied the traffic flow of ships for the navigation field. Liu et al. (Reference Liu, Liang, Nie, Garg, Zhang and Xiong2021) generated the maritime traffic networks using trajectory simplification and density clustering algorithms, extracting the hottest shipping routes through a sliding-windows algorithm performed on the shipping route heatmap. Vettor and Guedes Soares (Reference Vettor and Guedes Soares2015) studied the intensity of the geographical distribution of the voluntary detection and analysis of the main routes in the North Atlantic. Pallotta et al. (Reference Pallotta, Vespe and Bryan2013) proposed a traffic route extraction and anomaly detection to extract the maritime movement patterns for maritime situational awareness. Chen et al. (Reference Chen, Lu and Peng2015) presented a space-use method found in habitat evaluation of wildlife applied to extract principal fairways of ship passages through a strait. Loic & Ray (Reference Loic and Cyril2017) designed principles of a hybrid approach combining both online and offline approaches to process maritime traffic data. De Vries and Van Someren (Reference De Vries and Van Someren2012) proposed a piecewise linear system (PLS) algorithm which can be retained recursively. The point where the maximum error is higher than a fixed threshold is compressed into a linear segment. Fu et al. (Reference Fu, Wang, Liu, Hu and Zhang2017) built a compression method based on routing and motion characteristics using reference points and PLS. Dutta et al. (Reference Dutta, Bhattacherjee and Narang2011) proposed a layer-sampling data compression algorithm. It ignores the importance of time sequence, spatial sequence, or other factors, resulting in a high compression error rate. Yang et al. (Reference Yang, Yang, Yin and Xiao2013) proposed an ROI extraction method. Shao and Fang (Reference Shao and Fang2002) used analytical techniques to investigate the mechanism of traffic and the law of traffic flow, and presented a fluid model of ship traffic flow based on the traffic flow theory of fluid dynamics. Wan (Reference Wan2010) established a traffic flow model by analysing ship traffic flow distribution in the Laotieshan Waterway, revealing its characteristics and potential hazards. Zhou and Xiong (Reference Zhou and Xiong2019) used the AIS shore-based system to obtain the position data of ships passing through the Chengshanjiao waters traffic separation system, and calculated the local density of each ship's location point based on the neighbouring information of these location data points, and extracted the ship's traffic separation system at Chengshanjiao's navigation hot spots in the water. Hu et al. (Reference Hu, Liu, Liu, Li and Liu2019) systematically examined the morphological characteristics of ship traffic flow and proposed that regional ship traffic flow exhibits uneven distribution characteristics in spatial distribution, and qualitatively analysed the influencing factors and evolution mechanism of regional ship traffic flow's spatial distribution. A measurement model of the uneven regional ship traffic flow's spatial distribution was established, and a case study was conducted with the Yangtze River Estuary's entry and exit channel and the main channel of Yantai West Port as examples.
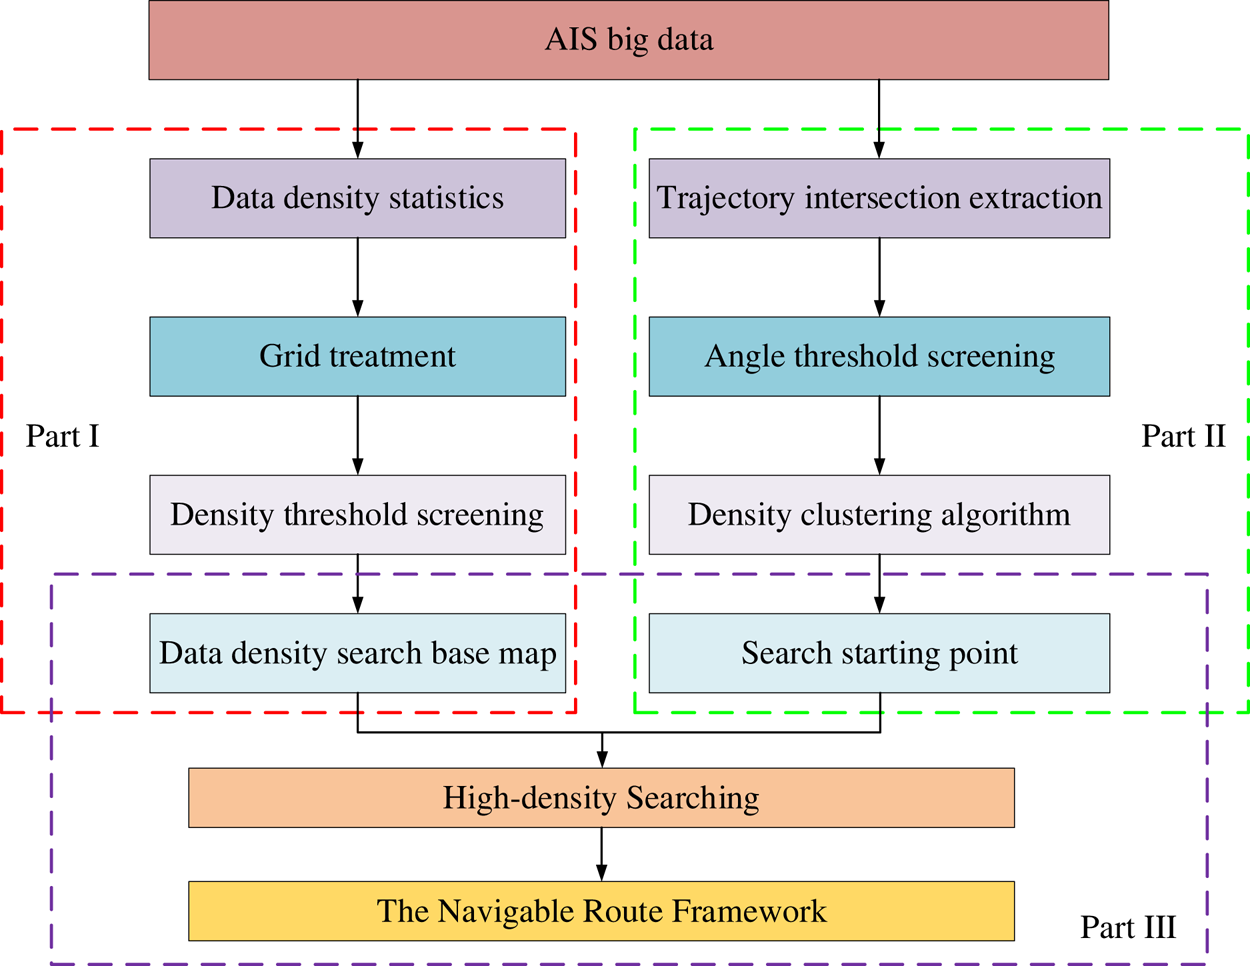
This study comprehensively considers the ship position density map of the ship AIS data as the search basis for the SNRF. Moreover, the intersection of ship trajectories after ship clustering is considered as the initial search point to obtain the SNRF; Figure 4 shows the technical roadmap of this paper. The SNRF was extracted into three parts in this study.
Framework mining technology roadmap

Part I: Based on AIS big data, perform density statistics on the data in the area to obtain a complete ship density map, and then perform grid processing to determine the corresponding density threshold, filter out part of the low-density data and finally obtain the data density search base map.
Part II: Based on AIS big data, identify and extract the ship trajectory intersection points, followed by the determining the corresponding trajectory intersection angle thresholds and additional screening of the intersection points. The selected points are density clustered, and the corresponding weights are attached. Finally, obtain the initial search points.
Part III: Starting with the intersection of trajectories of various levels, eventually achieve the SNRF by adopting the idea of manifold learning and using the data density search base map as the foundation of the search.
In this study, based on the characteristics of a large volume and a rich data content of AIS data, existing big data resources are improved and valuable information hidden in the data is further mined. We can extract the SNRF that can reflect the ship navigation rules and geo-information, which can be characterised using the AIS big data. Massive AIS data provides new ideas and methods for the study of navigation behaviour and ship officer sailing habits, improving the safety and efficiency of maritime traffic.
3. Extracting data density search base map
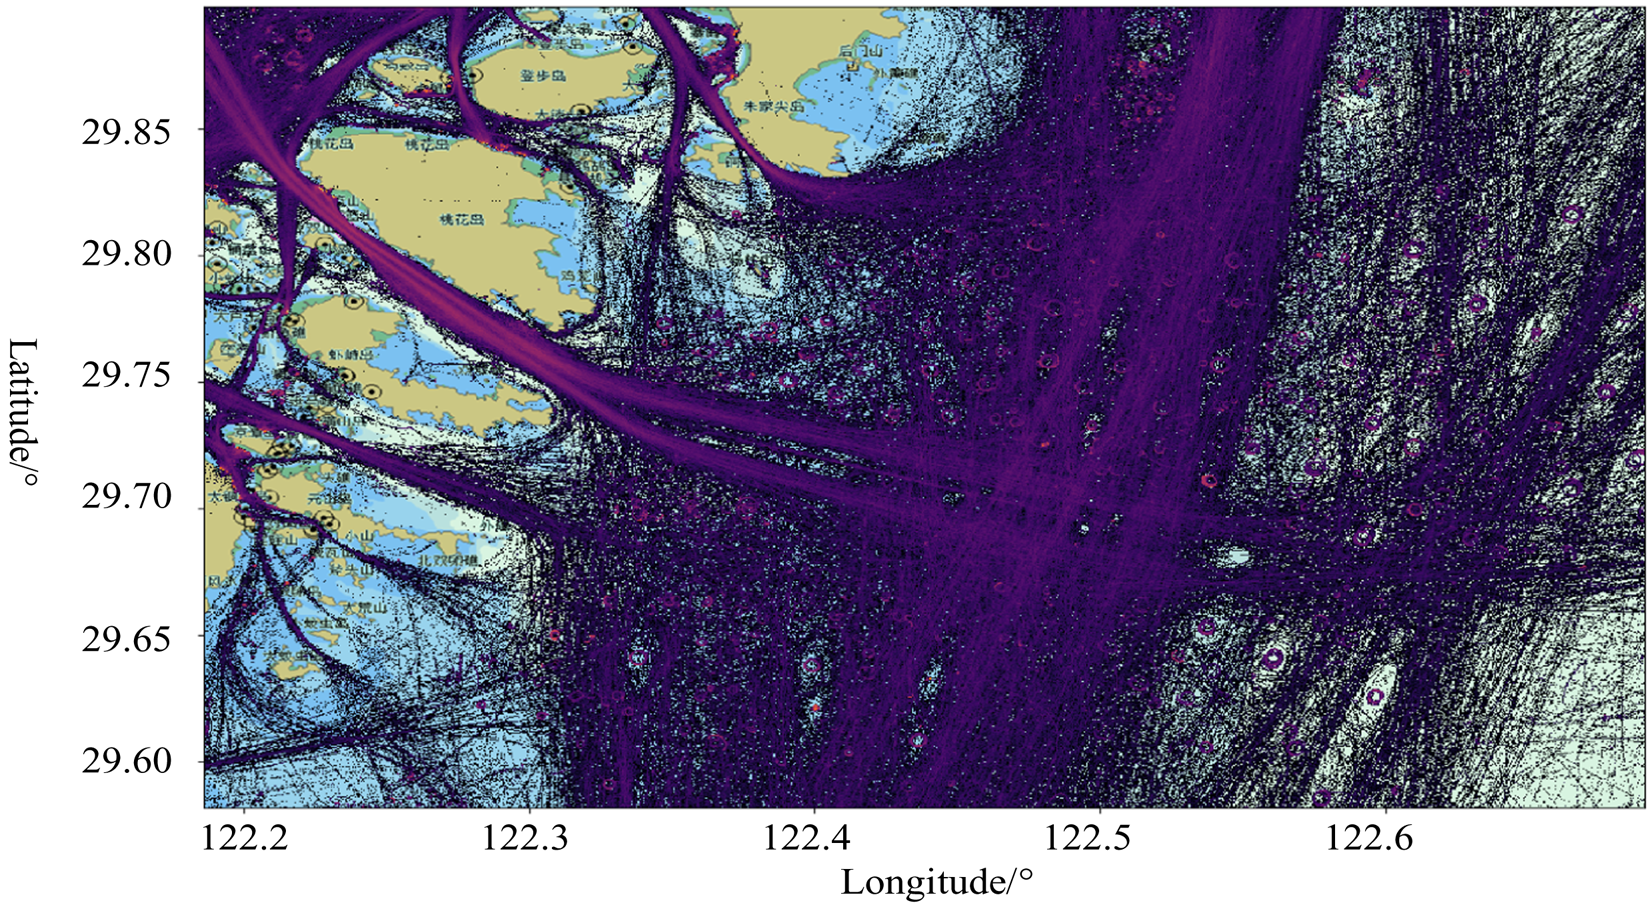
The AIS data for seven days in 2018 near the Ningbo–Zhoushan Port, yielding a total of 2,093,780 AIS data bits (Figure 5) was selected for mining experiments to extract the SNRF. The geographic area range is E 122°11′8 ⋅ 94″–E 122°41′28 ⋅ 32″ and N 29°34′54 ⋅ 36″–N 29°53′53 ⋅ 4012″.
AIS data of Ningbo–Zhoushan Port

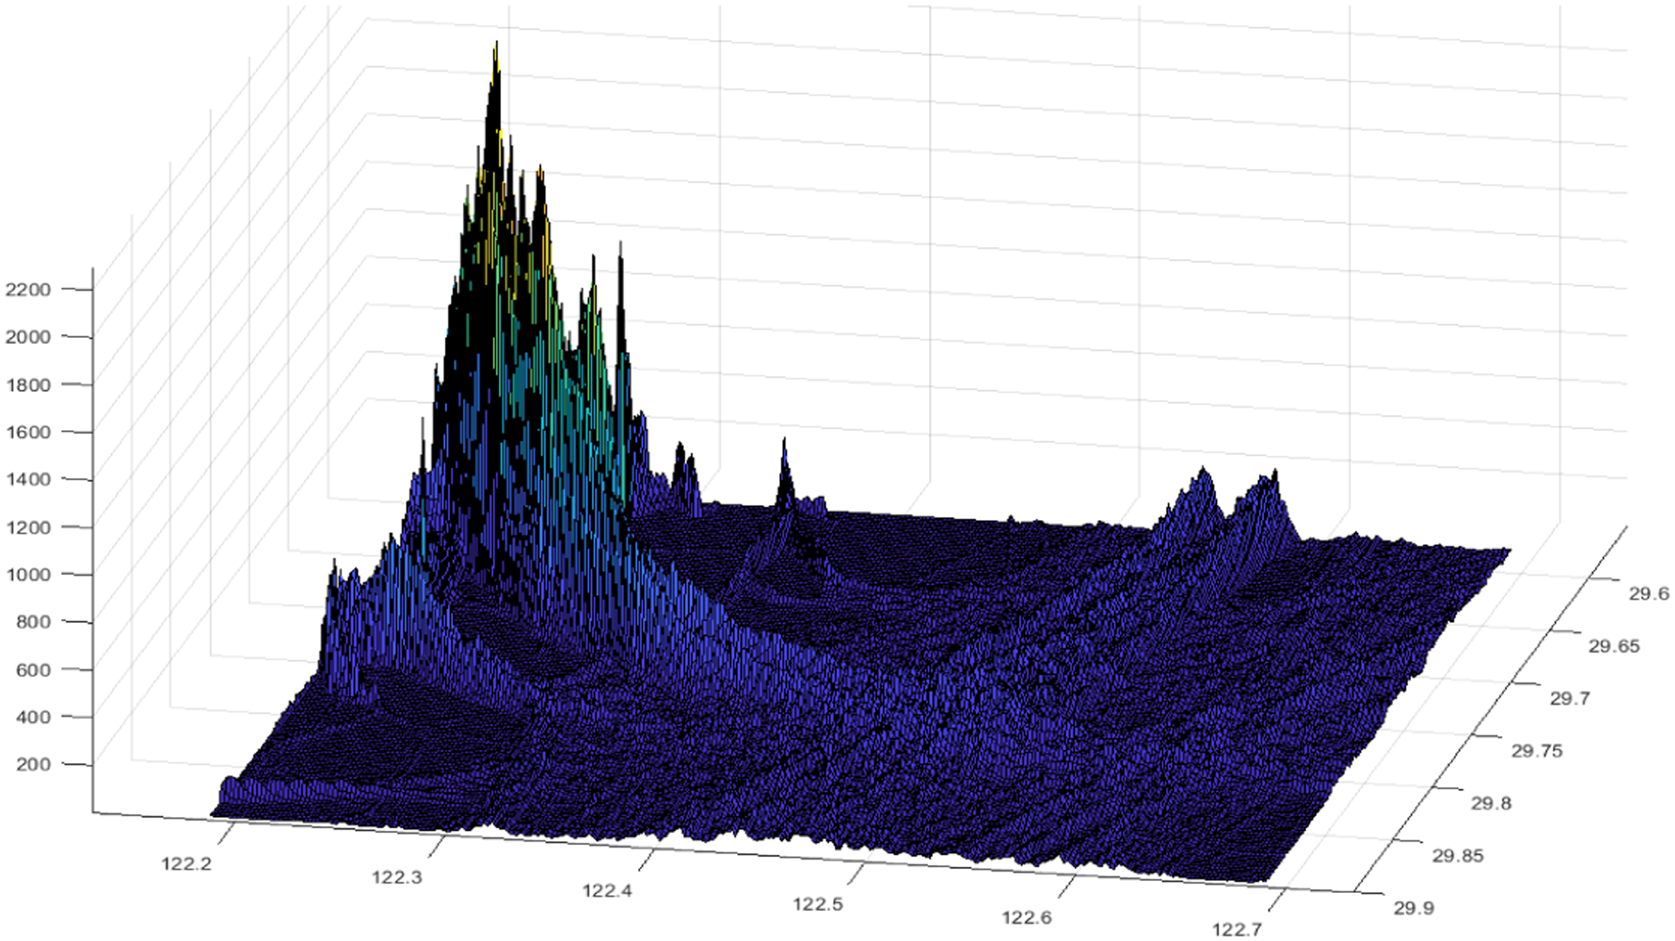
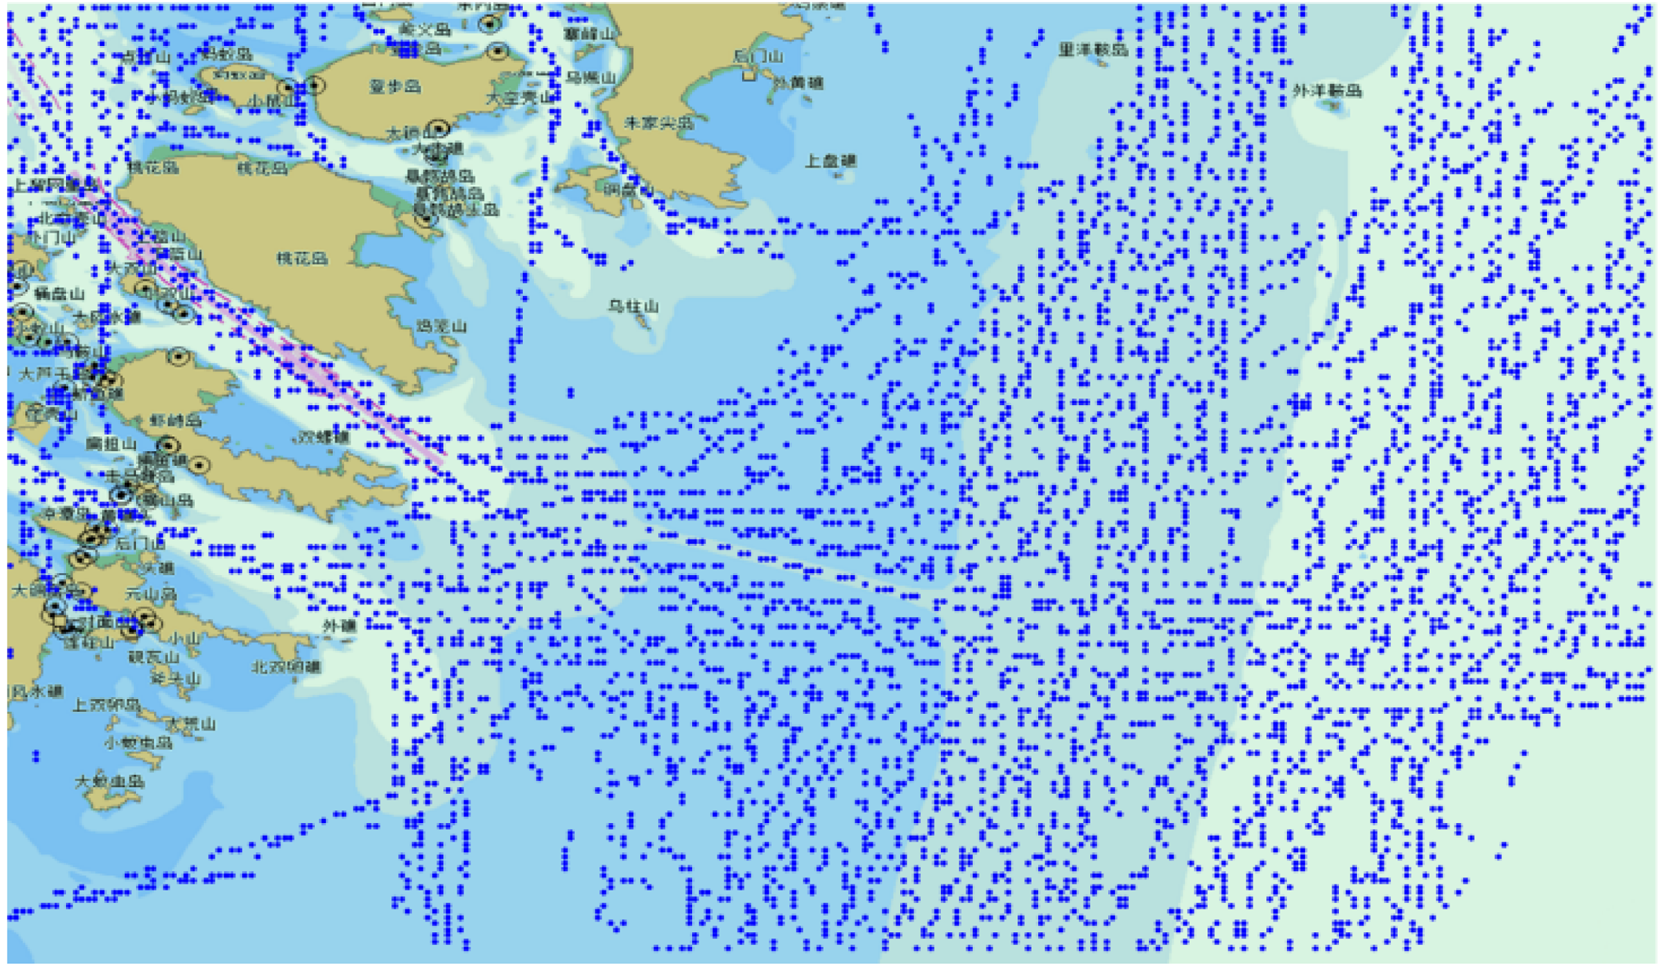
First, the entire area was gridded by 0 ⋅ 0002° intervals to discretise the data to obtain the AIS data density statistics (Figures 6 and 7).
Grid AIS data of Ningbo–Zhoushan Port

Data density statistics 3D graph

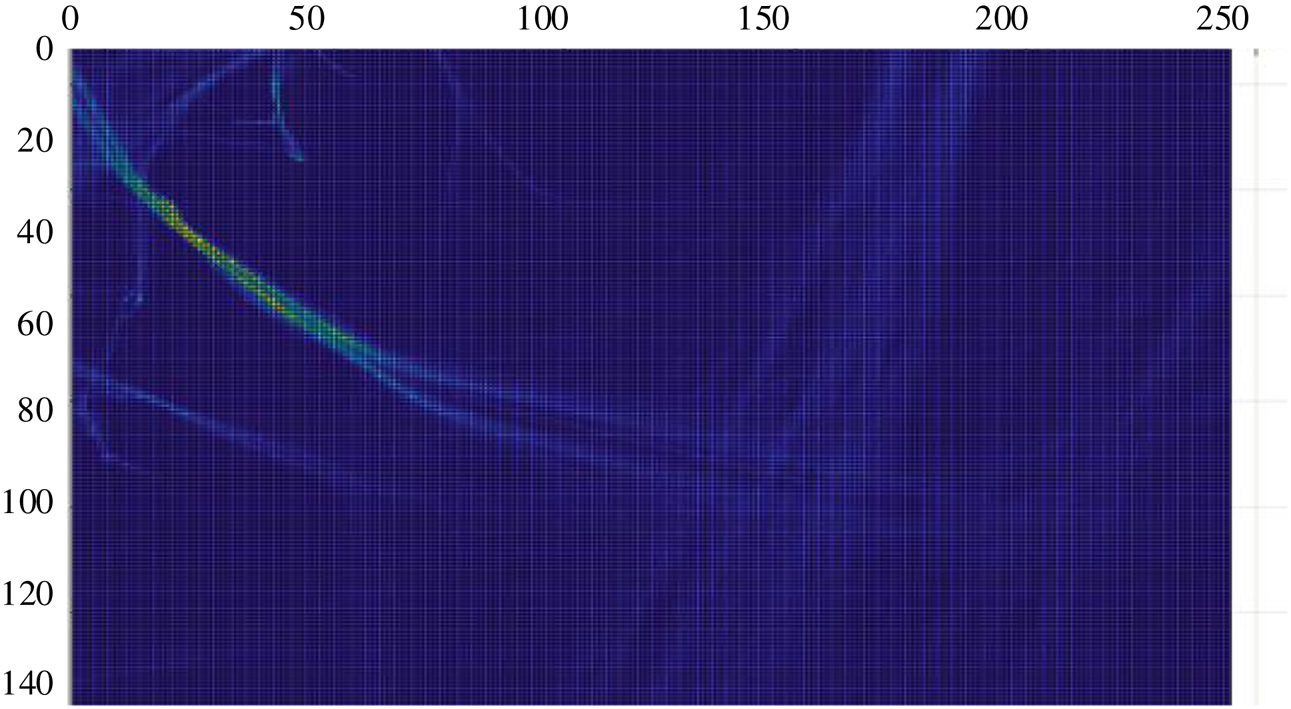
By filtering the data density in the grid, the density value of higher than 20 are retained and the high-density value is obtained as the base map for subsequent density search (Figure 8).
Data density search base map

4. Extracting ship trajectory intersection
4.1 Trajectory intersection extraction
The initial search points should be provided after obtaining the high-density search base map. Meanwhile, the AIS can supply the trajectory intersection. In route planning, the dense intersection of the trajectory lines is a place with high ship density. In this area, the course and speed of each ship are often different, and the navigation situation is complicated. Thus, the route intersection point is also an important ship traffic flow feature.
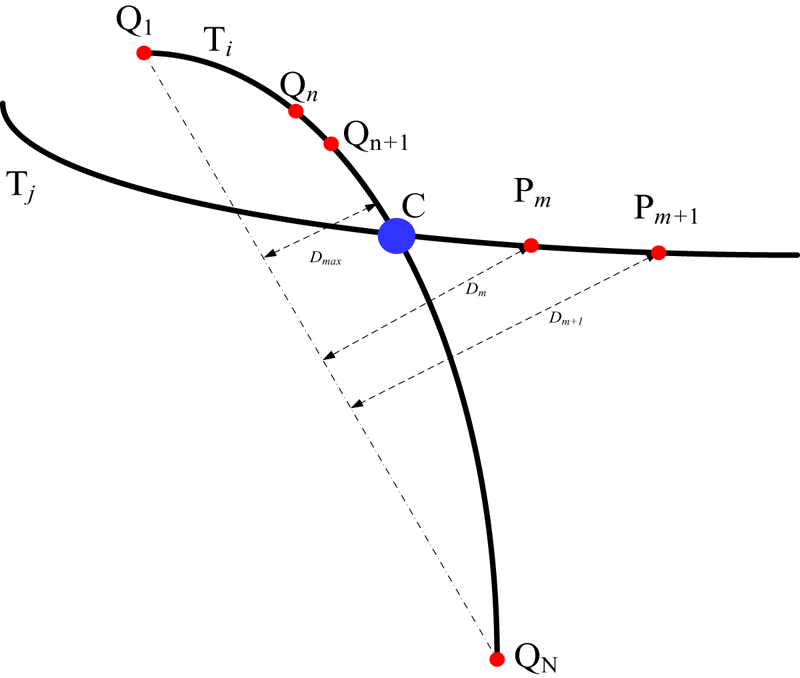
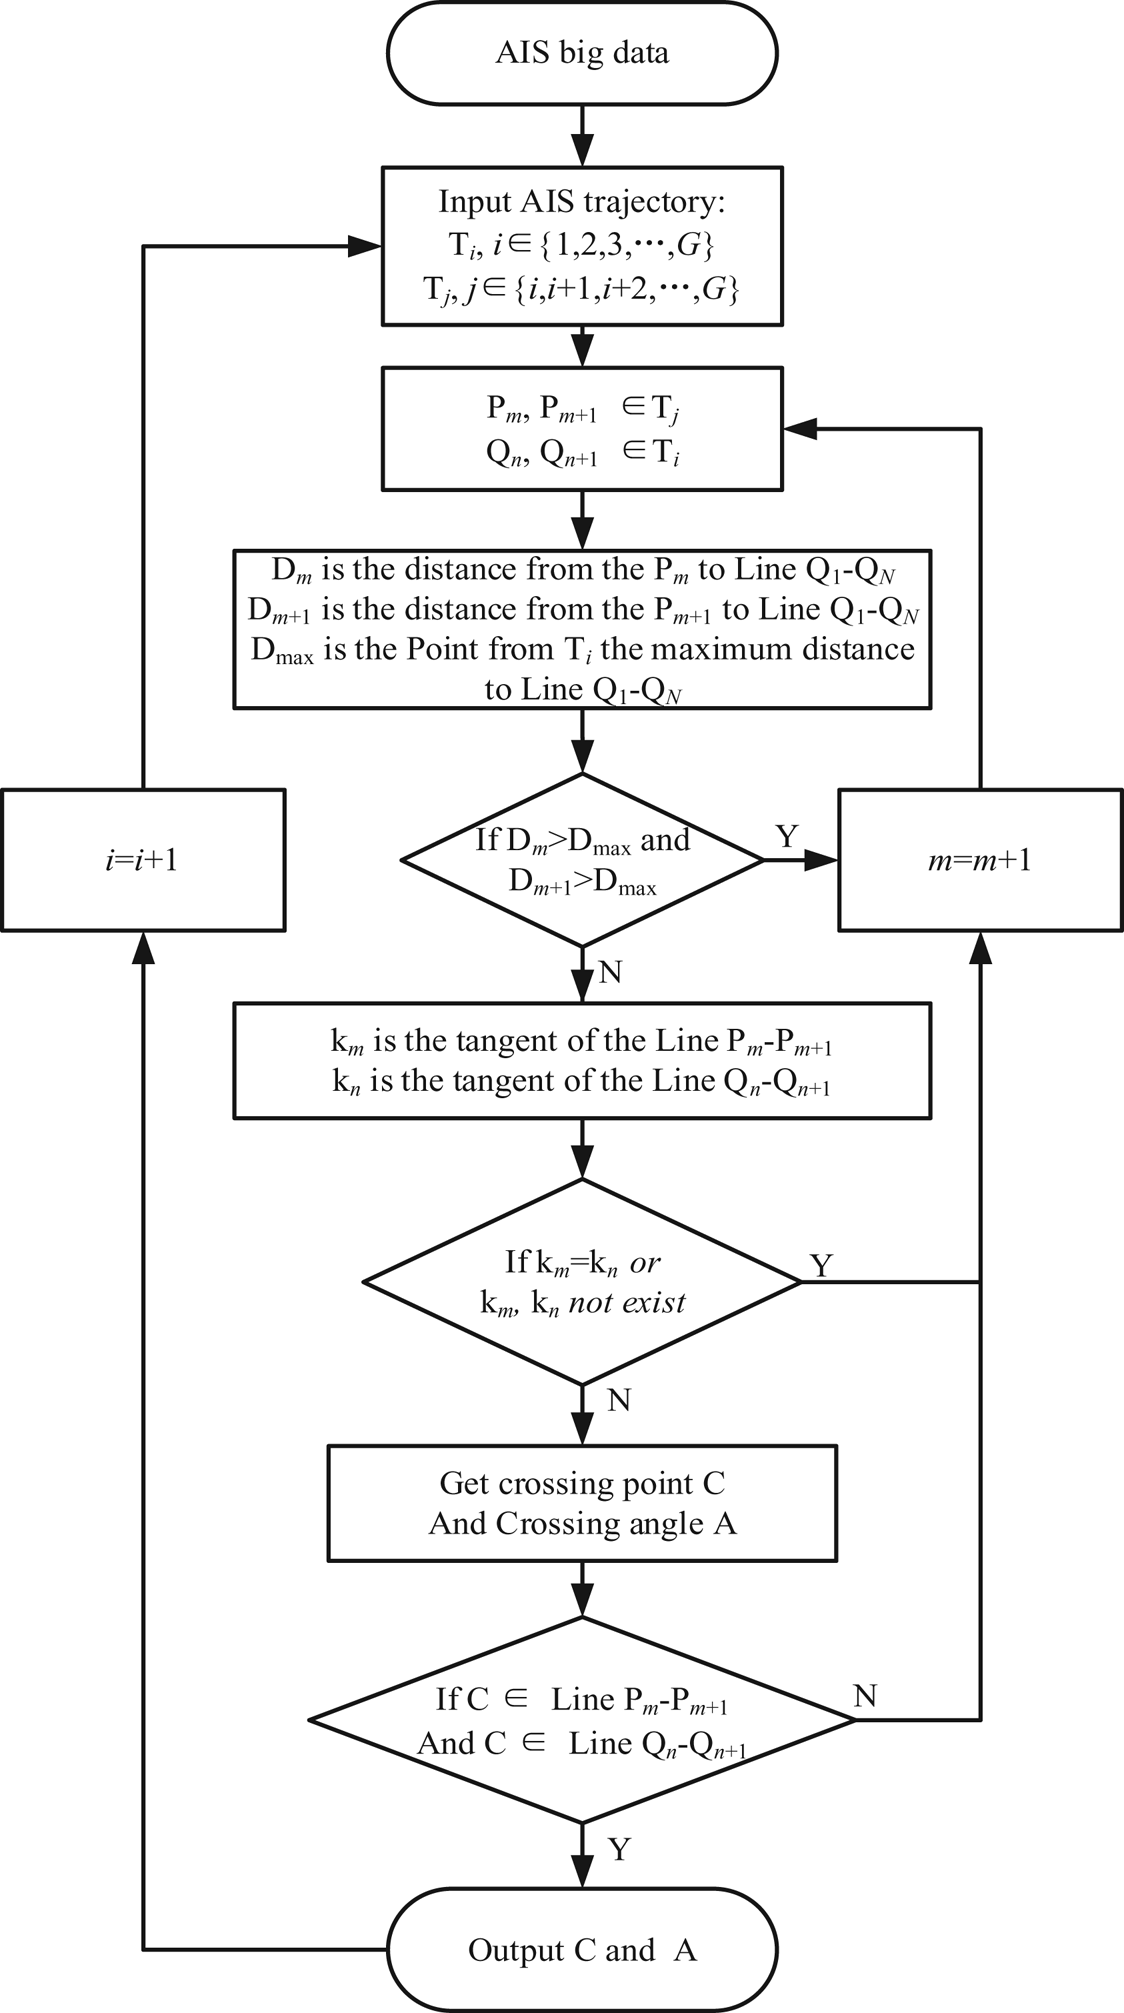
The intersection point extraction step: Take two adjacent points on the trajectory lines, Ti and Tj, of the two ships, Pm, Pm + 1 and Qn, Qn + 1, connect Pm and Pm + 1 to obtain line segment Lm, and connect Qn and Qn + 1 to obtain line segment Ln. If km and kn do not exist, the two straight lines are vertically parallel; if km = kn = 0, the two straight lines are horizontally parallel (Figure 9). The intersection point does not exist if the two straight lines are parallel. If km ≠ 0 or kn ≠ 0, the two straight lines must intersect in a two-dimensional plane. For separable conditions, obtain the intersection point, C, of the two straight lines first, and then decide if the intersection point is on the two-line segments, m and n; it is the desired route-meeting point if it is. Figure 10 shows the flow chart of the trajectory intersection extraction.
Diagram of the trajectory intersection extraction process

Trajectory intersection extracted flow chart

The line segment between two adjacent points on each ship's trajectory must be assessed against the line segments on the trajectory of all other ships to determine whether there is an intersection point. The group of AIS data can be obtained by traversing all ships one by one using the aforementioned method. The intersection of all trajectories is the route convergence point.
4.2 Angle threshold screening
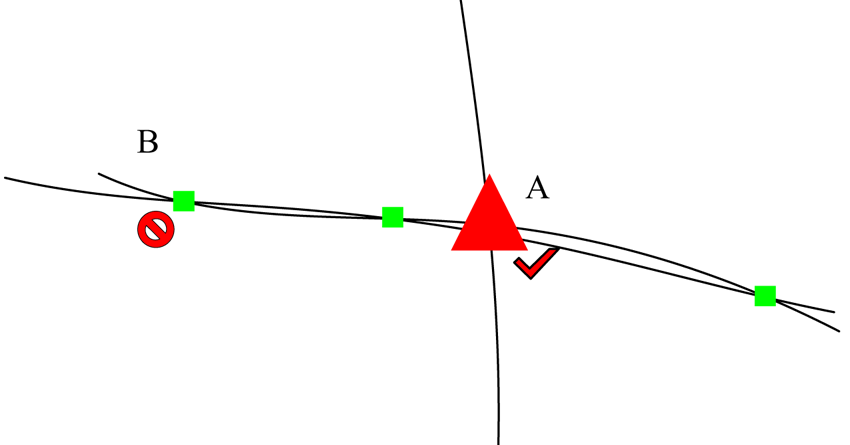
Because the ship was sailing through a viscous liquid, its trajectory will show an irregular oscillating path. When determining the region of intersection of ship trajectories, ships travelling in the same or opposite direction often cross on the trajectory. Figure 11 shows that Point A is the intersection point we expect to identify, whereas Point B is the intersection point caused by the ship trajectory turbulence. If type B points are included in subsequent data analysis, the overall analysis results will be severely impacted.
Diagram of ship trajectory intersection

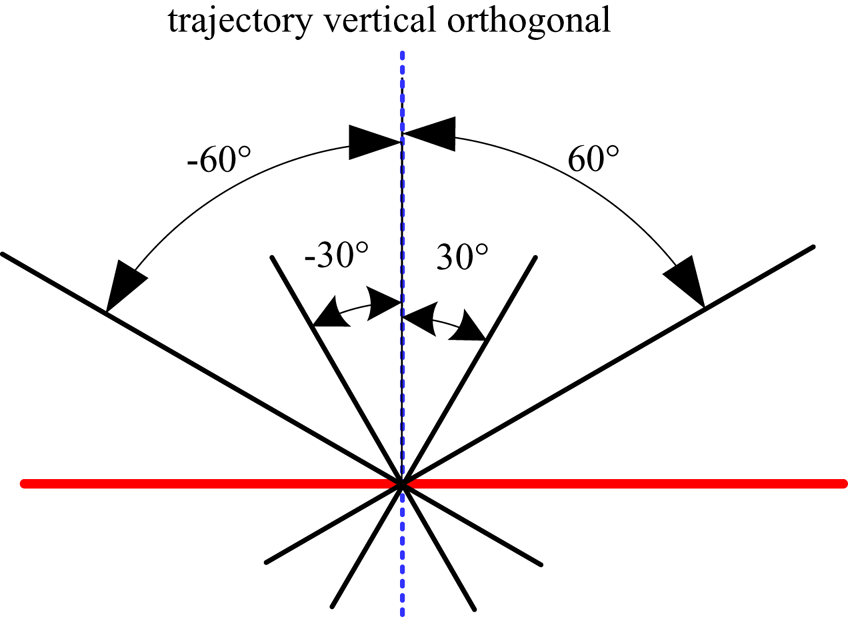
This study uses 90° (trajectory vertical orthogonal) as the basic boundary (0°–90°) as the screening range to identify and extract the intersection of ship AIS trajectories (Figure 12).
Diagram of trajectory crossing-angle deletion

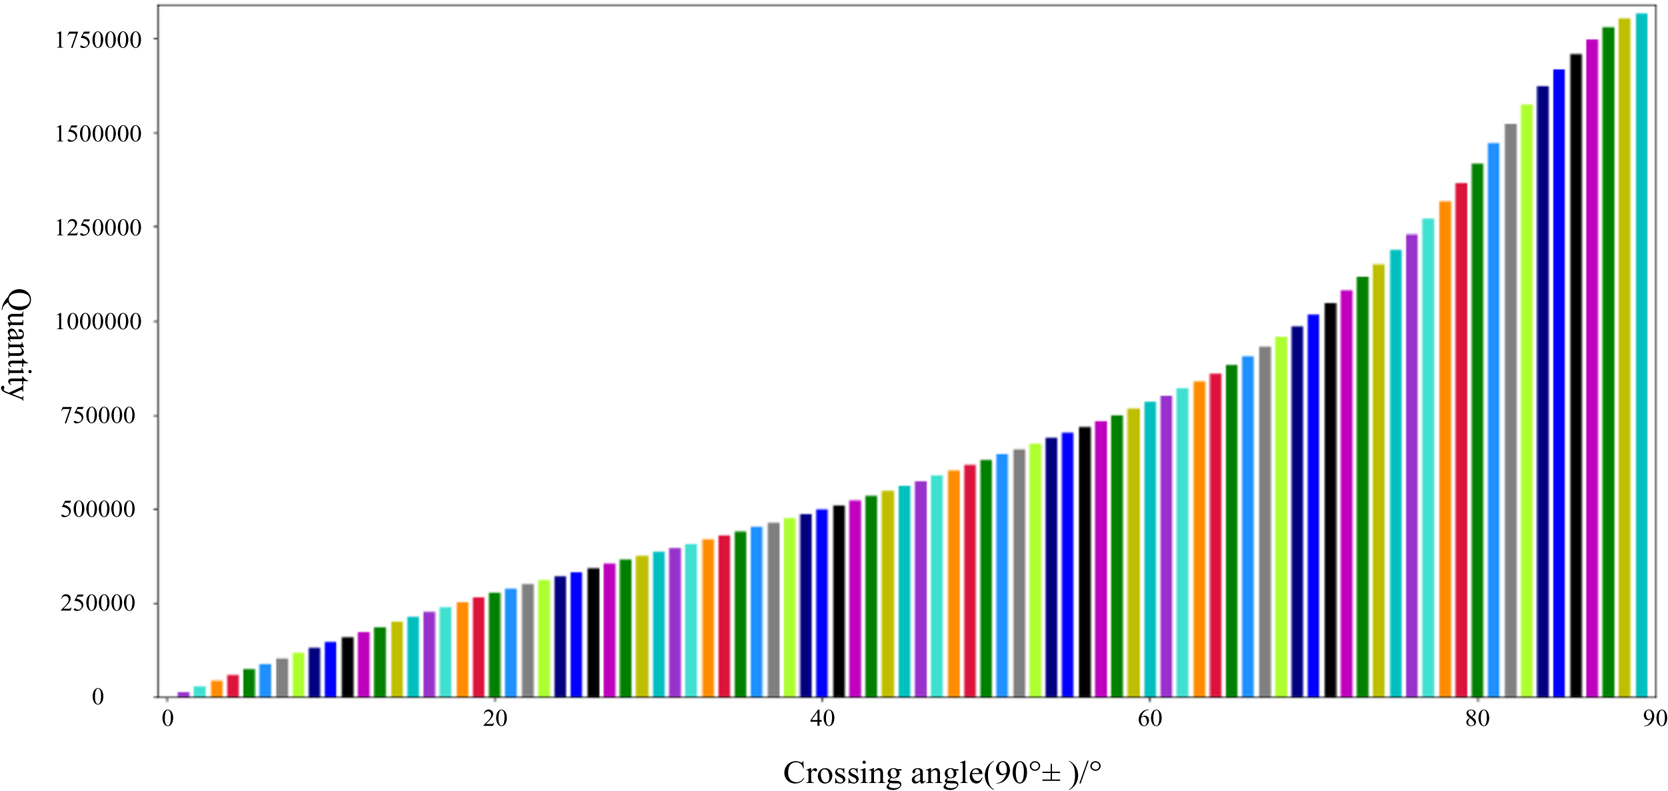
Figure 13 shows the quantity of ship trajectory intersections in different crossing-angle ranges. With the continuous expansion of the angle range, a large number of intersections were saved. Based on Figure 13, the increment in intersections were calculated as the angle increases.
Data quantity of ship trajectory intersection

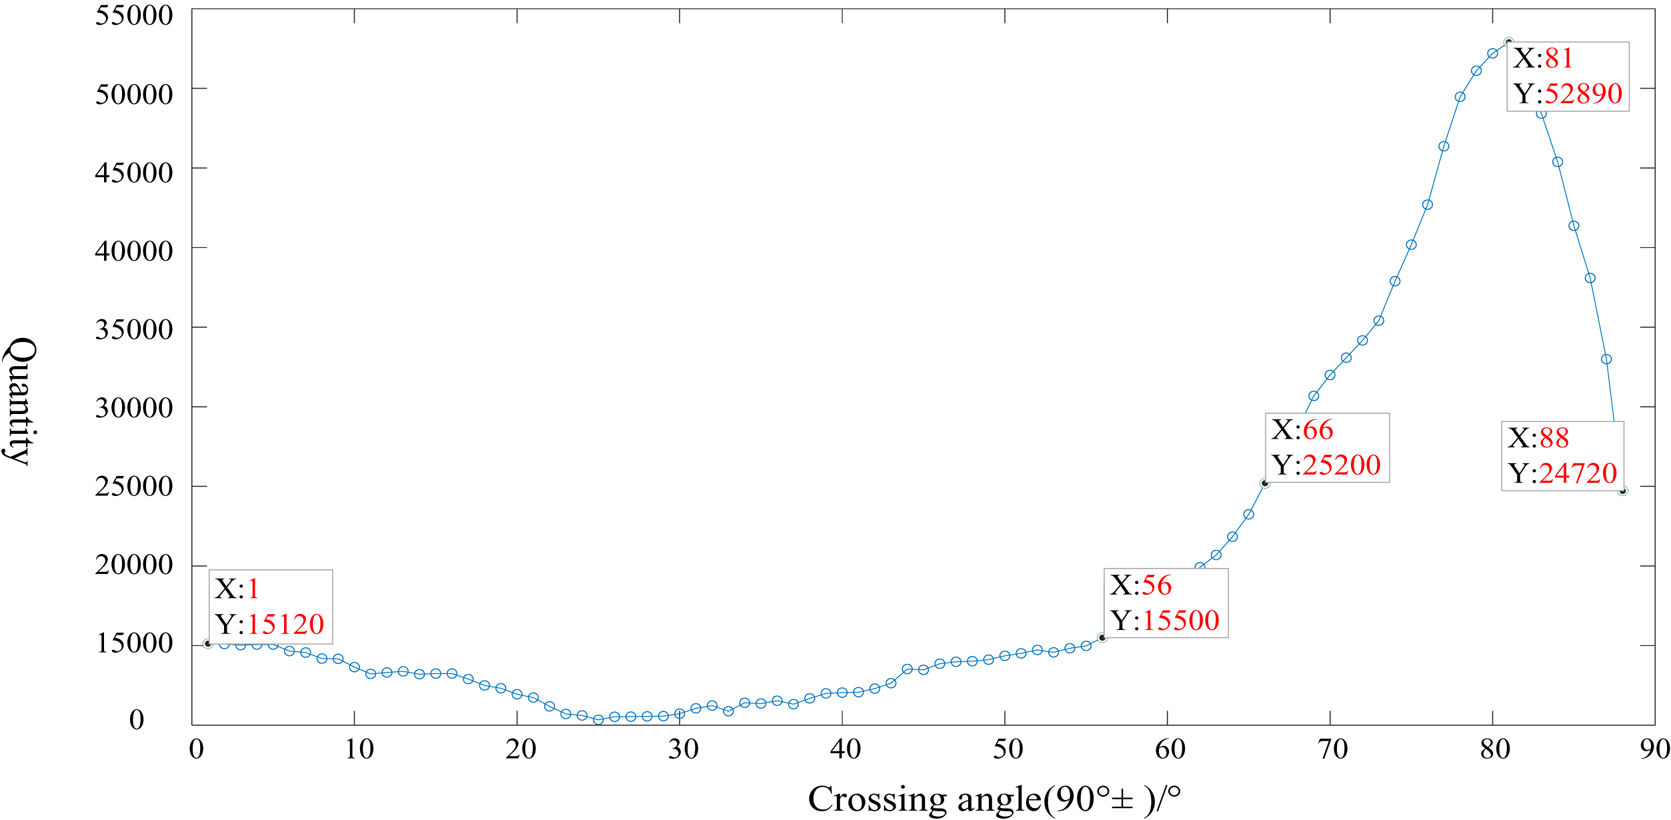
To further delete the intersection angle range and further study the law that the number of intersections increases with the angle, as shown in Figure 13, the change diagram of each interval increment was obtained based on Figure 14.
Diagram of data change of ship trajectory intersection

4.3 Density clustering algorithm
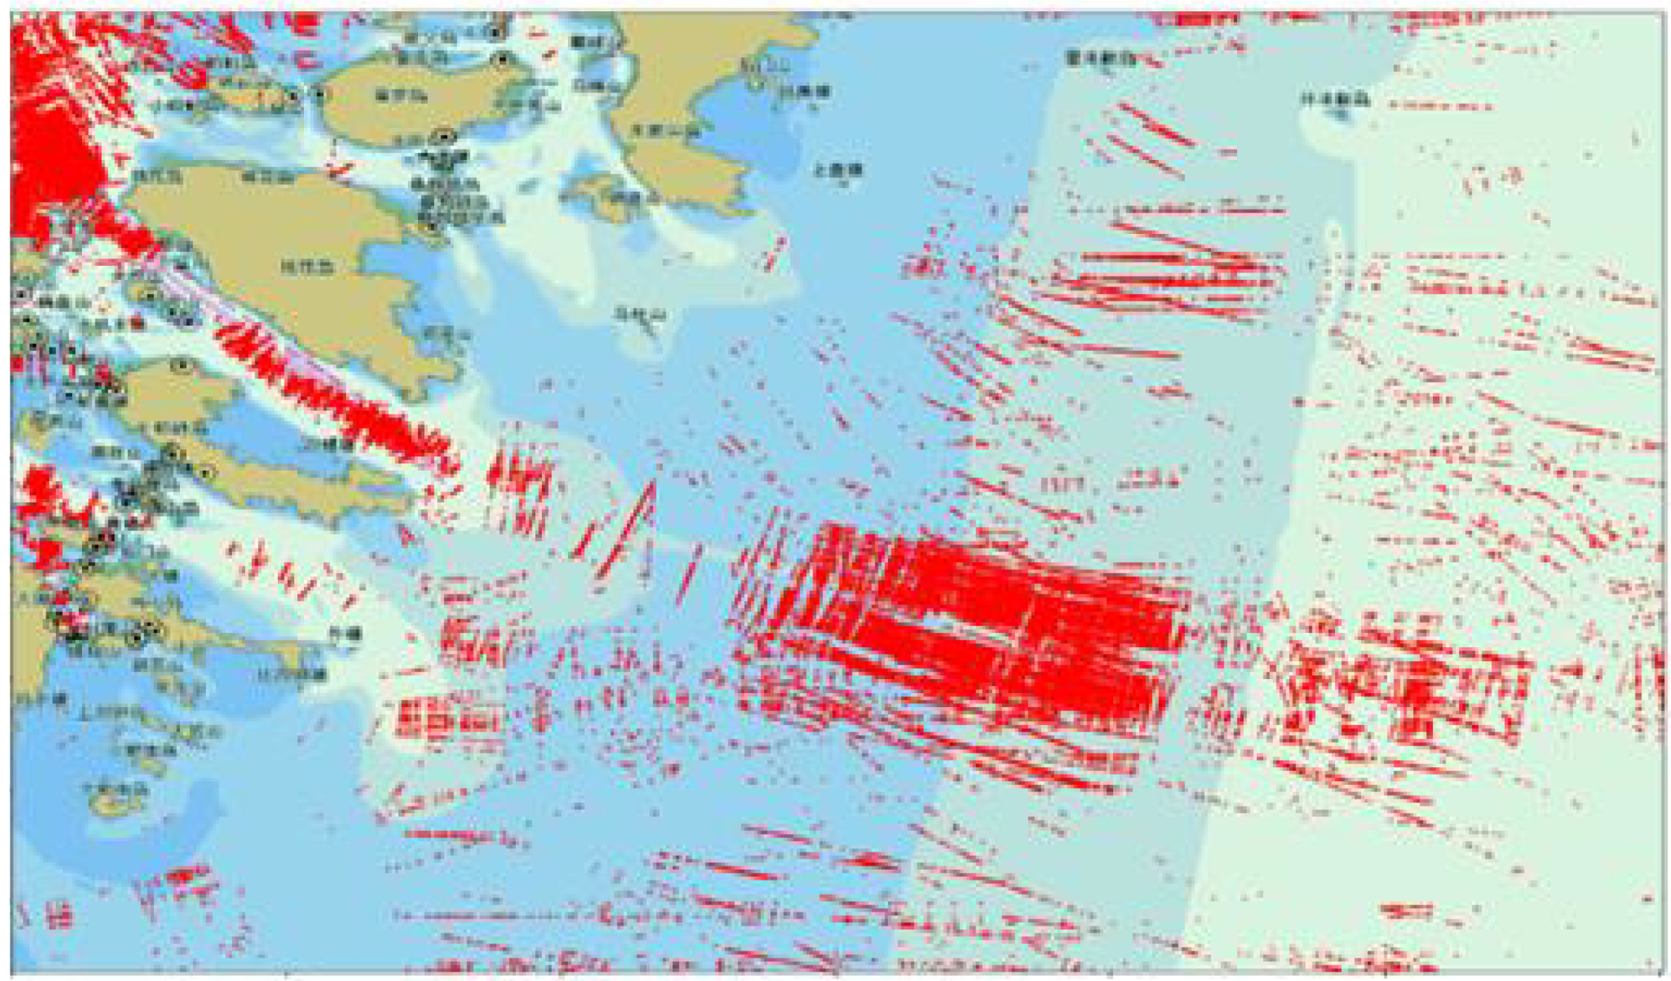
The crossing angle in the navigation convergence area is 60°–120° (90 ± 30), marked in red, which is identified as an obvious trajectory crossing, and any crossing angle more than 30° is considered an insignificant crossing (Figure 15).
Ship trajectory intersection

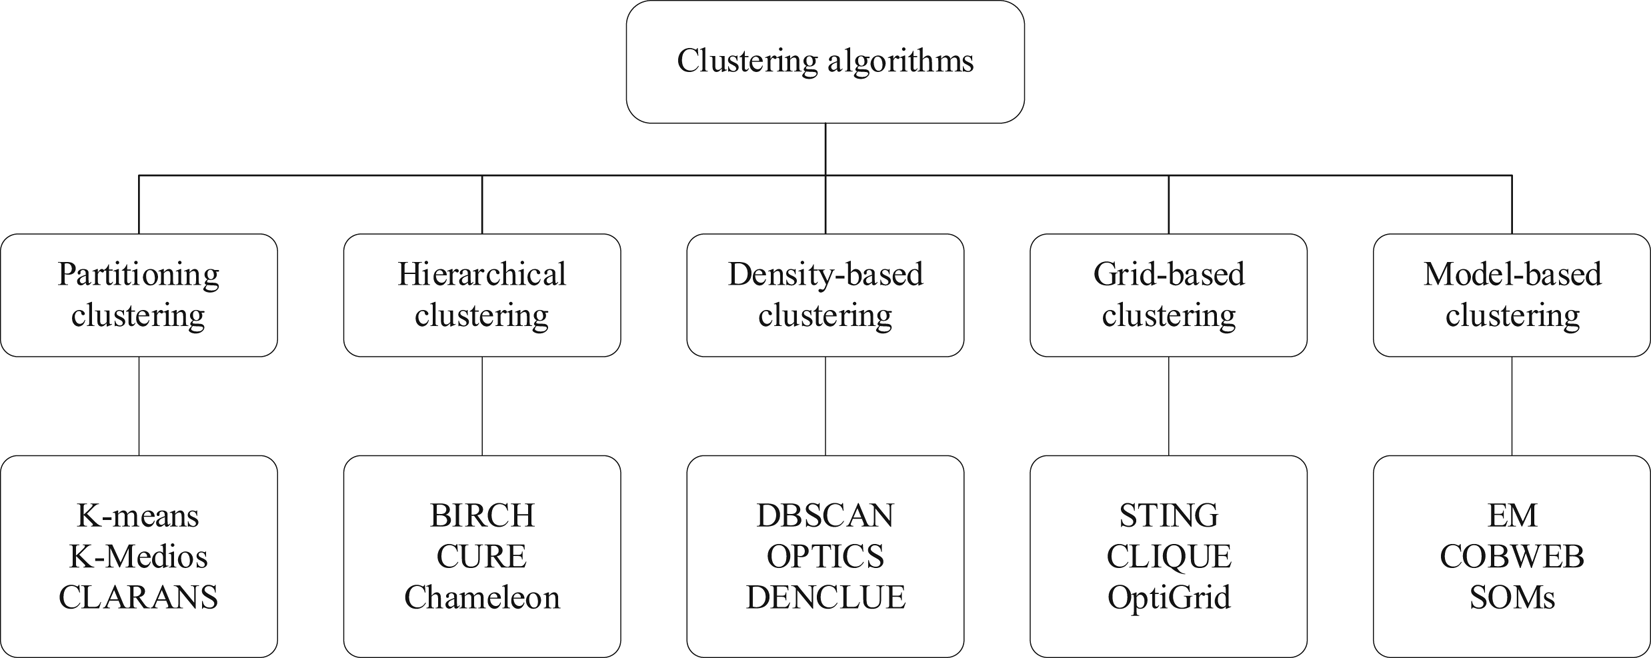
There are different taxonomies of clustering methods. The clustering methods are generally divided into five major categories (Idrissi et al., Reference Idrissi, Rehioui and Laghrissi2015, Figure 16).
Clustering taxonomy

In this paper, aims to merge the similar points based on data density for finding the initial search points, thus further analysis the density-based clustering algorithms, such as DBSCAN, OPTICS or DENCLUE, are used to classify objects of different shapes. We compared the time complexity of the density-based clustering algorithms. The time complexity of DENCLUE is O (N*lgN), the time complexity of DBSCAN is O (N*lgN to N2), and the time complexity of OPTICS is O (N2), which indicated the DENCLUE algorithm was faster than the other algorithms presented previously, DBSCAN and OPTICS.
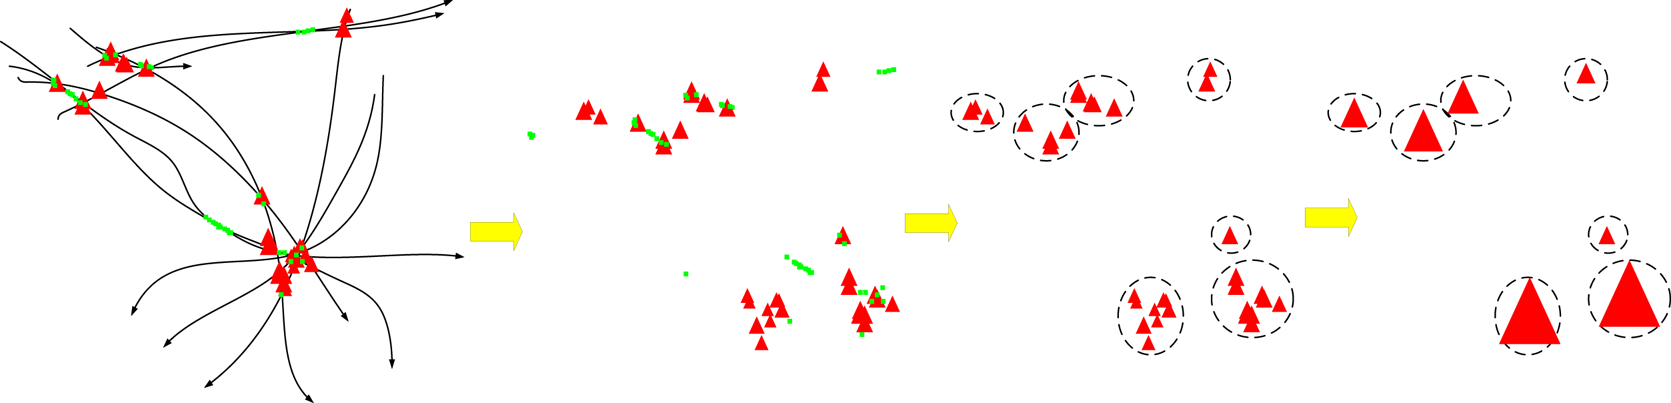
According to the characteristics of the distribution of AIS trajectories at sea (Figure 7), as well as the results of the statistics, not all the nodes of the global framework are very high density, but in the local area, they relatively form a high-density region, so in the clustering of the data nodes need to choose the algorithm that is more sensitive to the parameter of the local maximum value. DENCLUE (Hinneburg and Keim, Reference Hinneburg and Keim1998) was intended for large multimedia databases, since this type of database contains large amounts of noise and requires clustering high-dimensional feature vectors. In this paper, the DENCLUE algorithm was applied to cluster the intersection. With each intersection as the centre, additional intersections are included in its neighbourhood, affecting the neighbourhood size of each intersection with different thresholds. In the region formed by the centre point and the neighbourhood of each point, the density attraction point is the point with the most points in the neighbourhood. It absorbs all points in the neighbourhood and replaces each intersection point in the neighbourhood with the original coordinates of the density attraction point, completing a clustering. With an increase in the threshold value, the trajectories of various ships in the traffic flow are connected by a common density attraction point, forming a dense point network of the traffic flow in the water area (Liu et al., Reference Liu, Ren and Fu2016).
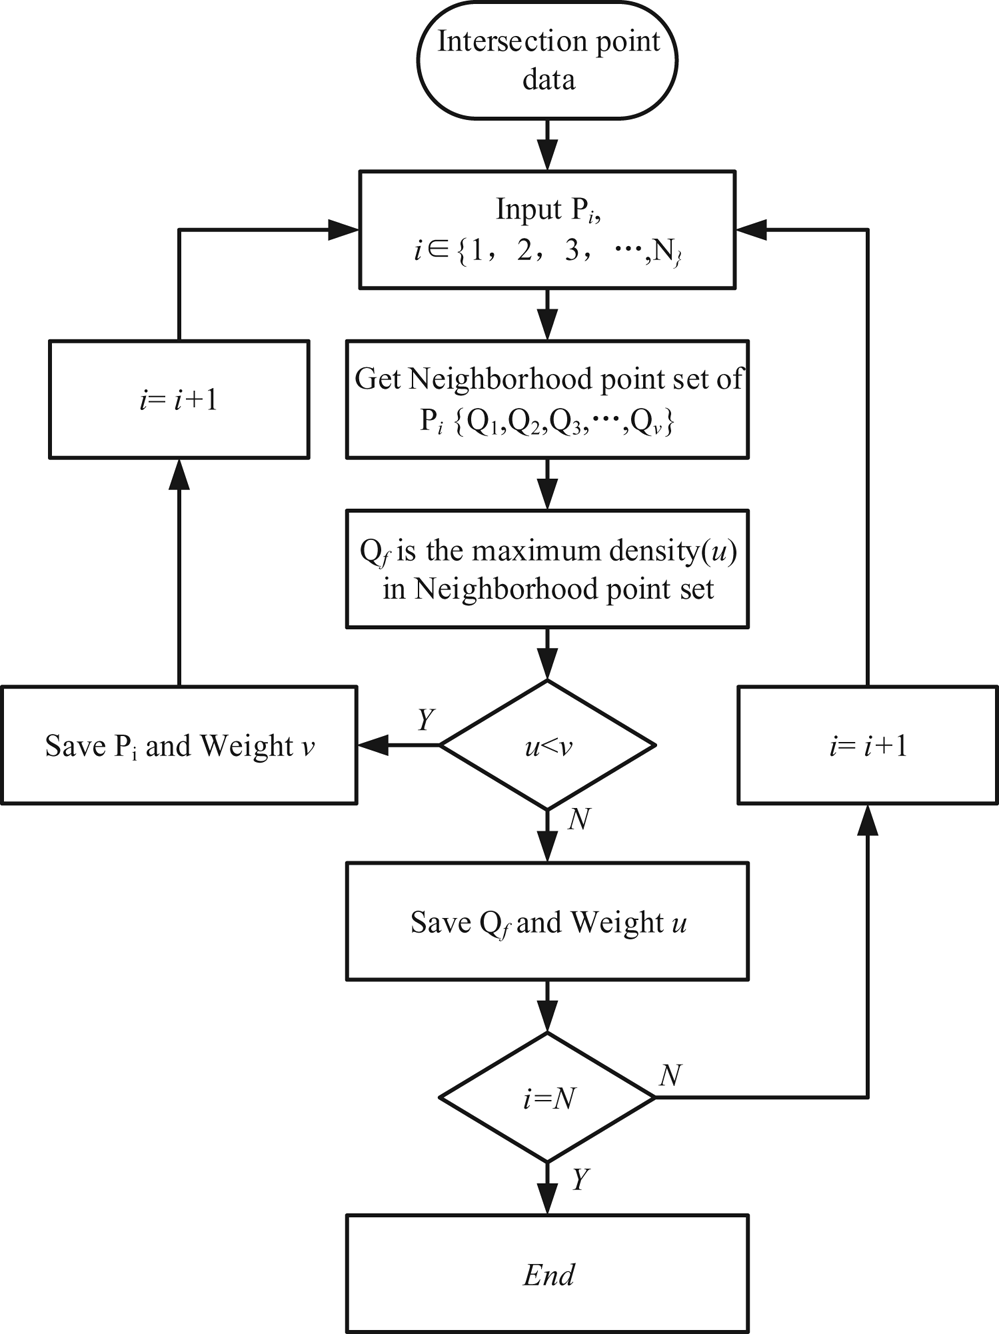
The trajectory intersection coordinates on each route can be obtained using pre-processed AIS data. Figure 17 presents the flow chart of density clustering, such as Point Pi (x 1,y 1). If the distance between the two intersections is d, the set range is ε, and if d ≤ ε, then the two points are within a clustering range. Taking Pi as the centre and ε as the radius, the number of ship position points, u, in the neighbourhood circle is counted; each point in the neighbourhood of Pi is the centre, and the number of points in the neighbourhood of each point is counted. Set the maximum value, v, to correspond to the point, Qm (x 2,y 2). If u > v, then it is near Point Pi, and the density in its neighbourhood is the largest; thus, it is considered the density attraction point of the area, and the Pi point is saved; however, if u ≤ v, then it is near Point Pi and in the neighbourhood of Qm with the highest density, which is the density attraction point, and all ship position points in the neighbourhood of Qm, including Point Pi, will cluster to the Point Qm, and the Point Qm is saved. To prevent sequential clustering of coordinates of a certain point, the original coordinates of the cluster and the two points to be clustered must be in an interactive range, that is, d ≤ ε. Then, intersections are traversed in turn to complete clustering. Further, increase the threshold by arithmetic based on the clustering points in the aforementioned layer, and then perform clustering; when the clustering effect is not obvious, the original threshold difference no longer satisfies the requirements; thus, the threshold difference should be increased for clustering to be performed and realise better results. With more intersection point clusters, the density attraction point progressively reaches the local maximum of the global density (Figure 18). It stops when the required number of density points is reached and the intersection point density clustering is completed (Zhao et al., Reference Zhao, Shi and Yang2018).
Flow chart of density clustering

Intersection selection and clustering process

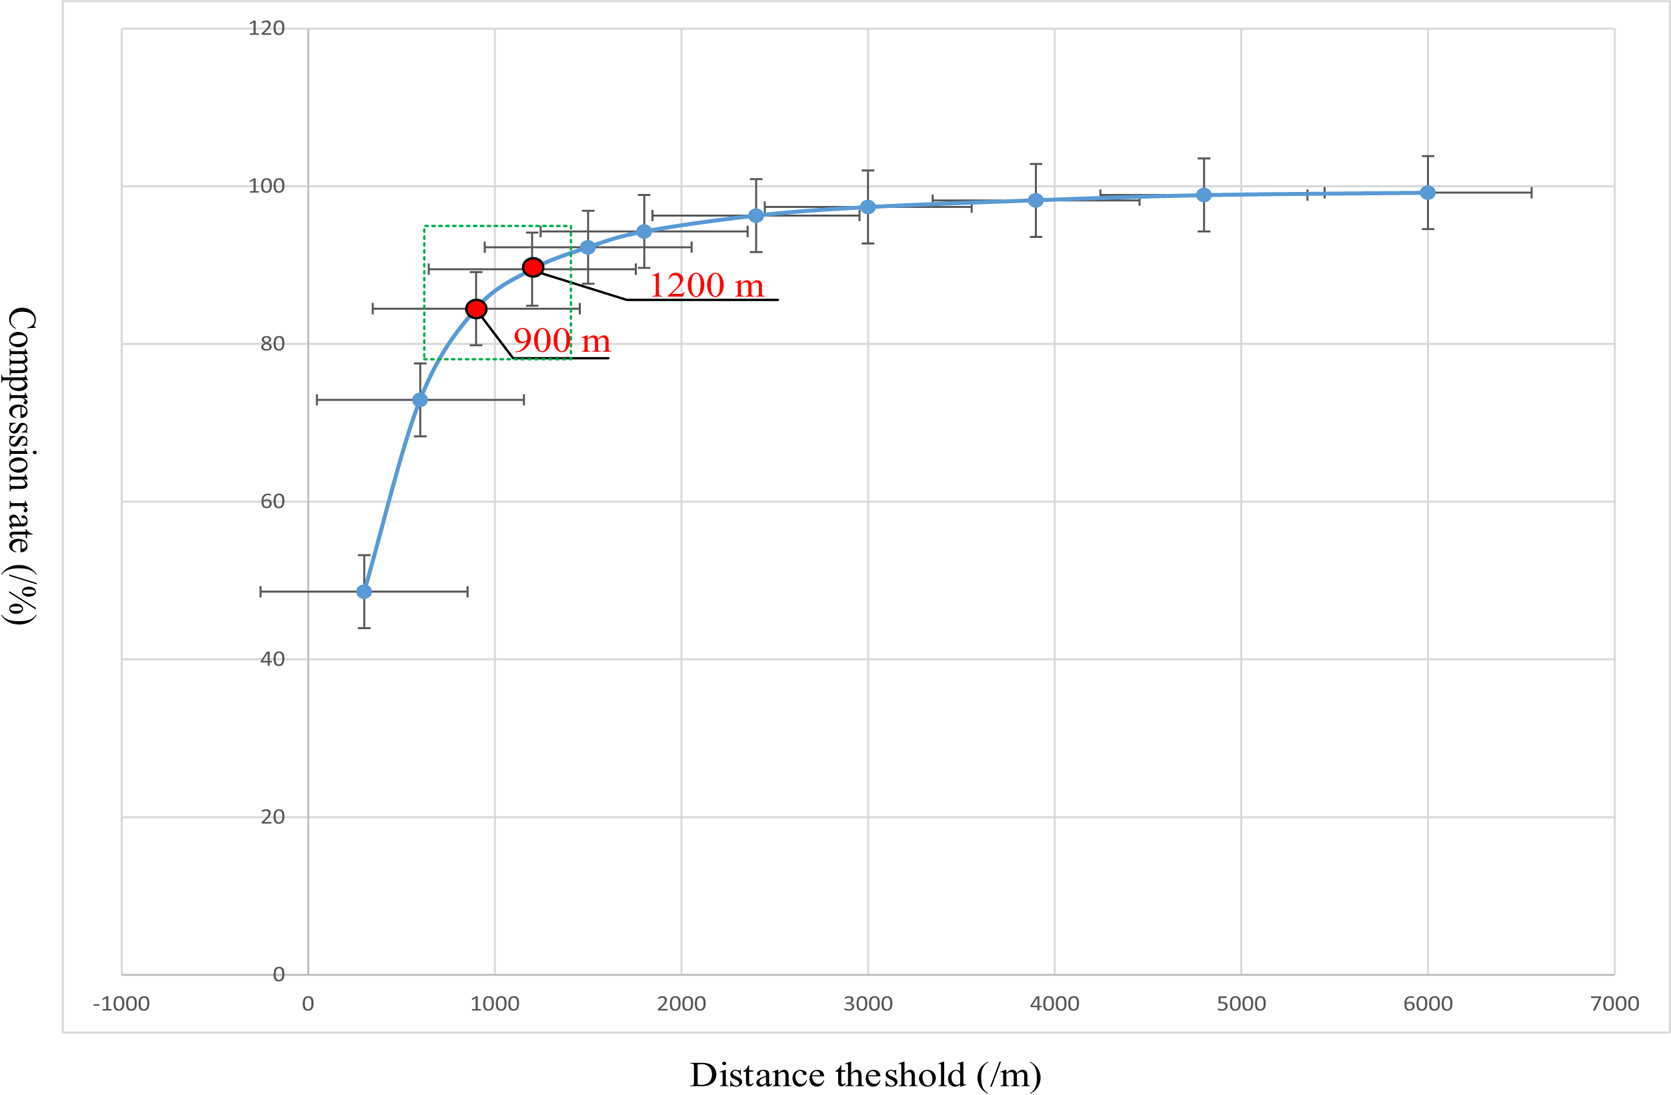
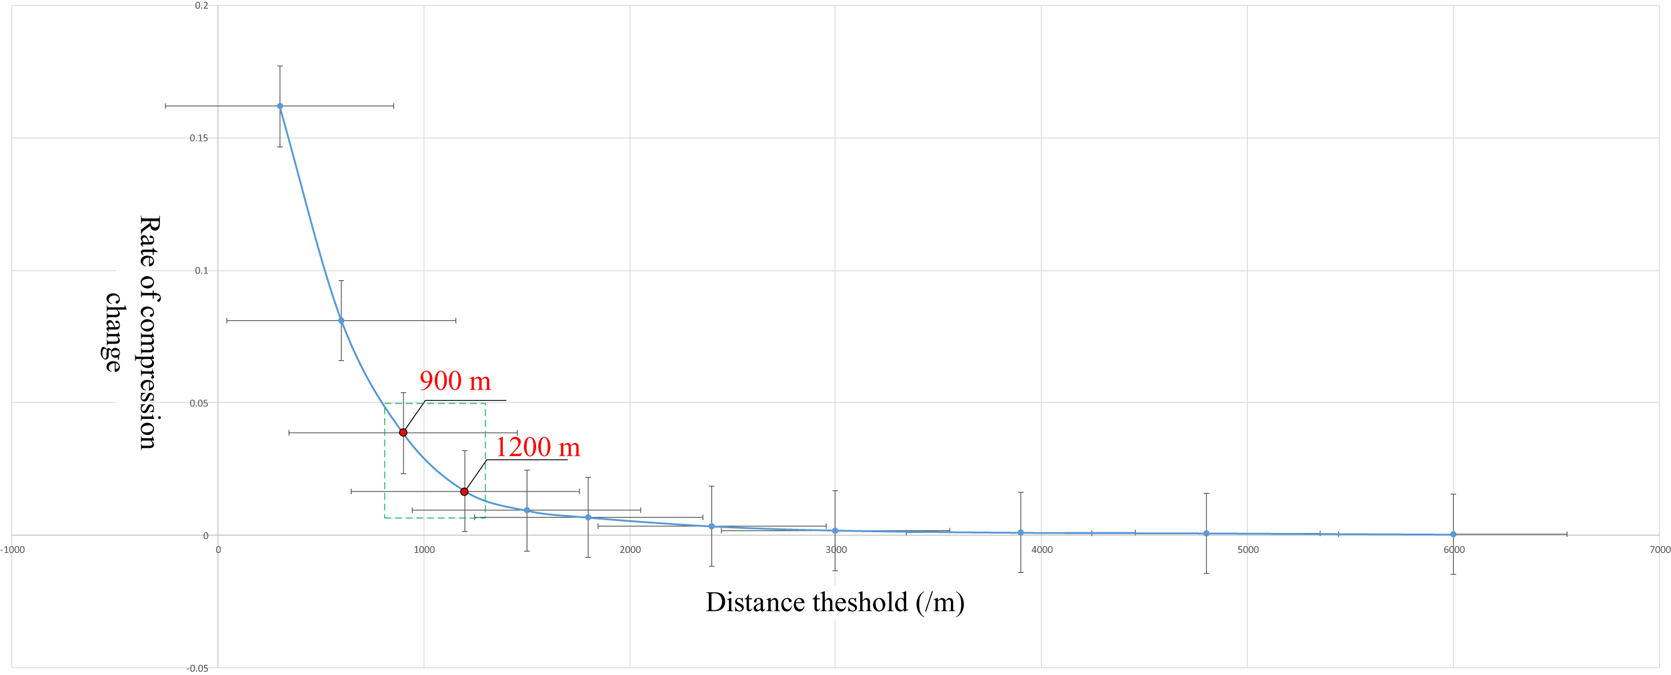
Different distance thresholds produce different point clustering results. Thus, the selection of a suitable distance threshold ensures that SNRF was extracted effectively. To determine the influence of the distance threshold to the clustering result, we set the distance threshold value from 300 m–6000 m to analyse the relationship between the data compression rate and distance threshold.
As shown in Figures 19 and 20, We determined the recommended distance thresholds for clustering the ship trajectory intersection points (900 m–1200 m) to assist in the selection of the distance when applying the proposed DENCLUE algorithm. The distance threshold must be re-established for different applications. A suitable value range was obtained as the recommended initial distance threshold.
Relationship between the distance threshold and the information compression rate

Relationship between the distance threshold and rate of change in compression rate

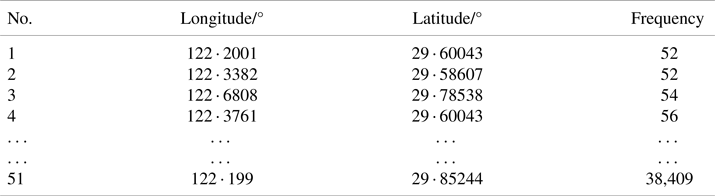
The weight of the density attraction point is expressed by the number of absorbed trajectory intersection points, and the size of the point is determined by the weight, which indicates the density attraction point's importance. Table 1 shows the frequency table of intersection points obtained after clustering. (Distance threshold was set 1200 m.)
Intersection data frequency

5. Navigable route framework search based on manifold learning
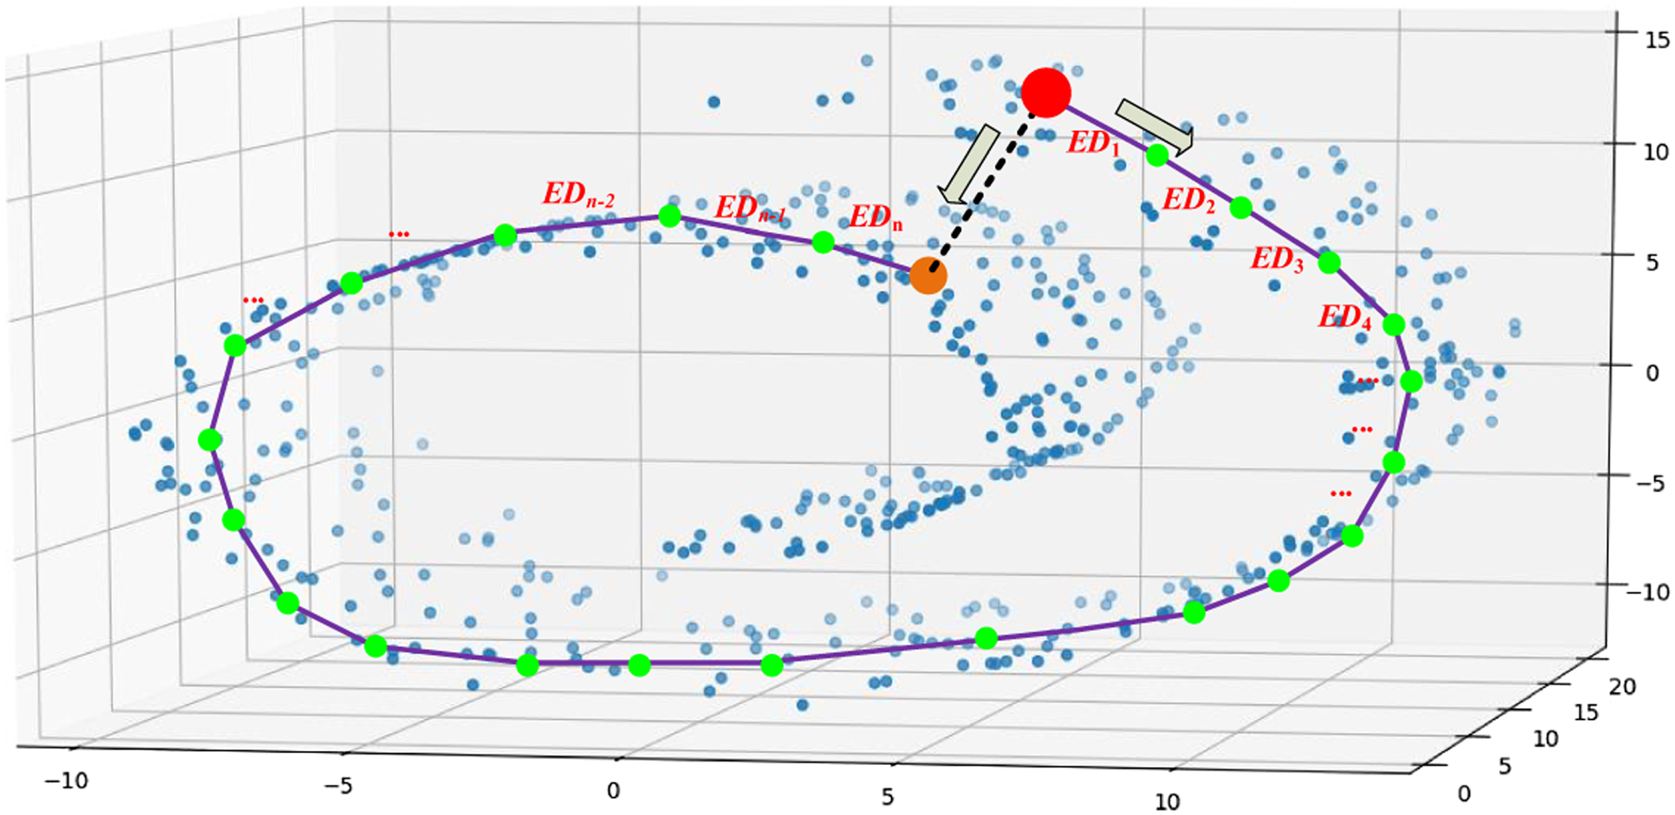
The distribution of a significant volume of AIS data in data space constitutes a potential data fluid field, with movement between data points following a specific flow direction rather than a two-point straight line in the actual 3D space (Figure 21). The marine MD can be obtained by cumulative superposition of multiple local Euclidean distances (EDs):

Diagram of high-density search navigable manifold distance

The idea of manifold learning assumes that the processed data points are distributed on a potential manifold embedded in the outer-dimensional Euclidean space, or that these data points potentially form such a potential manifold. In this study, the SNRF was derived from this potential manifold using high-density data searching.
First, the ship trajectory intersection point obtained by clustering was used as the initial search point of the clustering search. Further, the local high-density nodes were searched along the high-density direction of the data using the local flow characteristics of the manifold to obtain the SNRF. Based on the SNRF, it serves as the basis for calculating the distance of navigable manifolds at sea.
5.1 Search initial point level classification
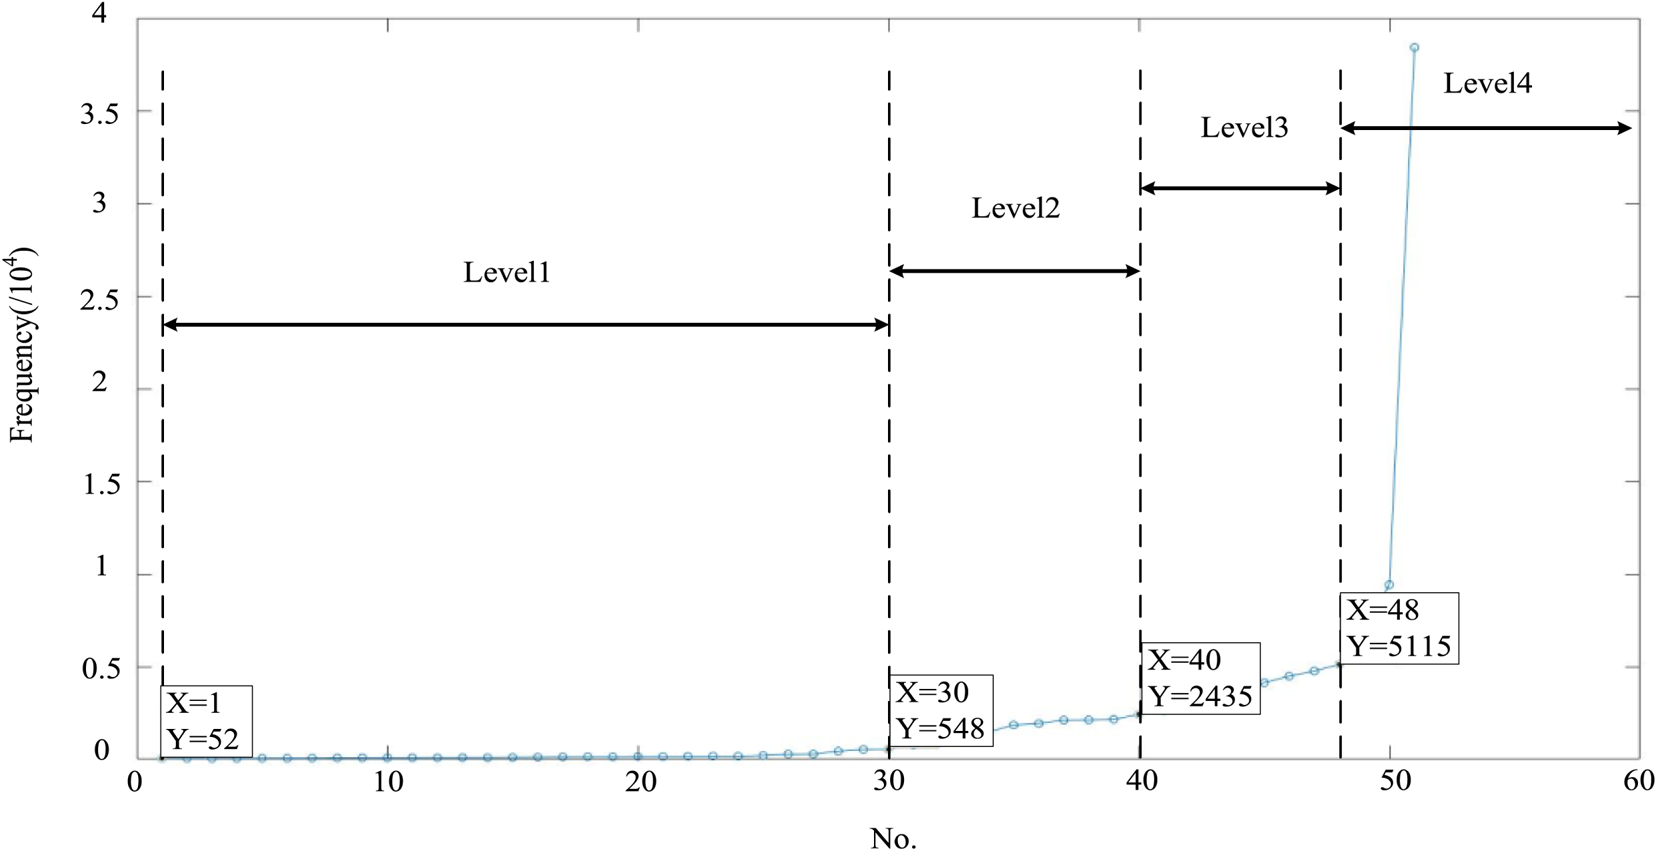
Because many clustering points are obtained after clustering, the weights after clustering are different, such that the degree of importance is different. The number of initial search points in the actual search should be determined based on the size of the weight value. This study classifies the initial search points based on the size and distribution of the intersection point weights after clustering (Figure 22).
Diagram of intersection density weight classification

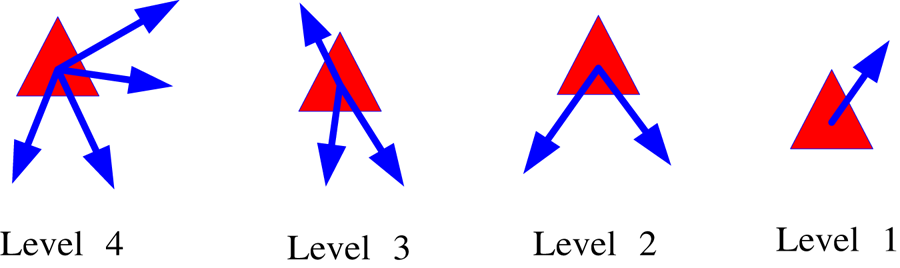
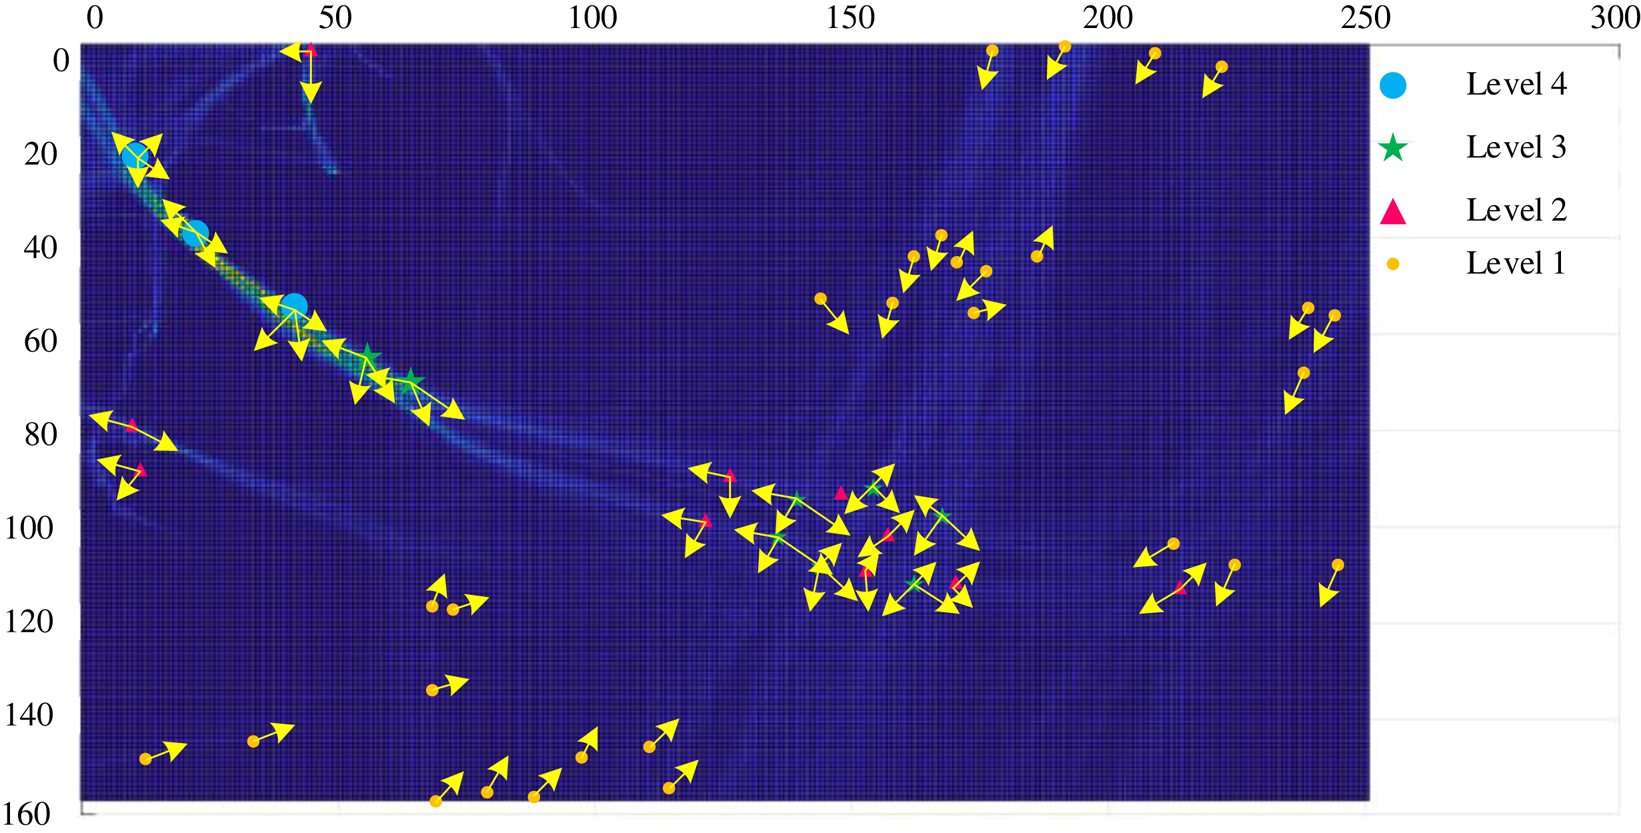
Figure 23 shows that the higher the cluster weight of the intersection, the higher the level. Level 4 can simultaneously search in four directions, Level 3 in three, Level 2 in two and Level 1 in one direction. Figure 24 shows the position distribution of the intersection points after clustering and merging.
Diagram of search levels for different intersection

Diagram of intersection-searching level

5.2 Ship navigable route framework search based on sliding-window algorithm
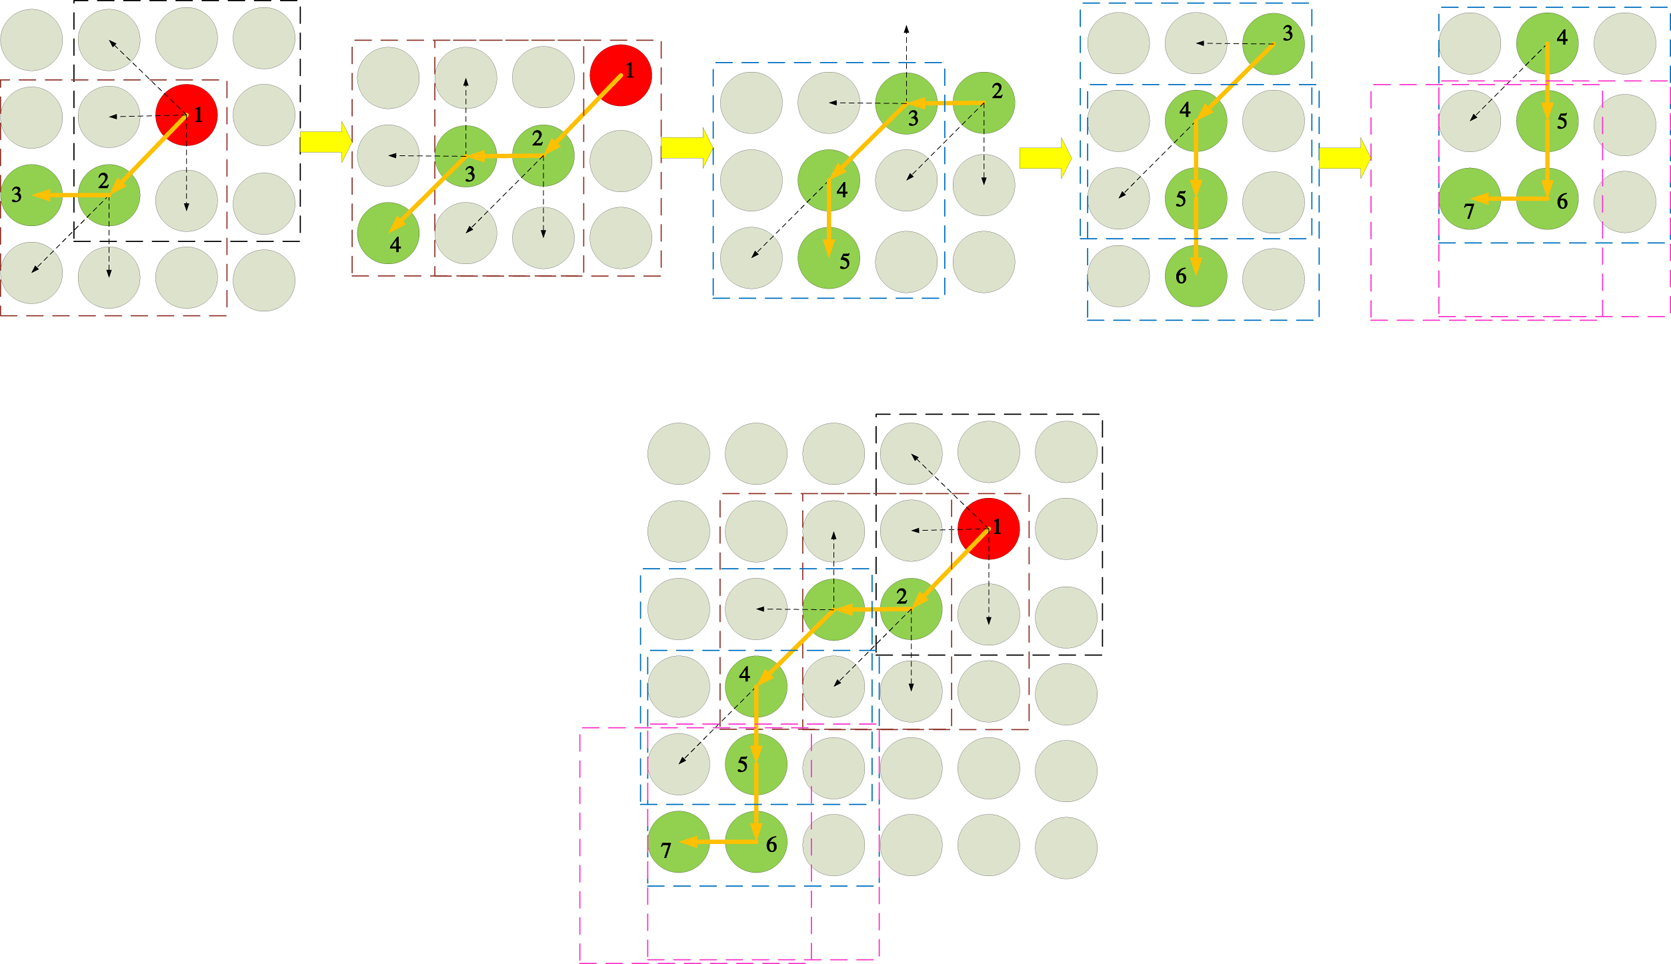
The initial search point is Point 1 and the level is 4 (Figure 25). One can search in all directions simultaneously, and discover the local density peak as Point 2, and then move the window, confirm again; the level is reduced, and the search is gradually performed to obtain the SNRF.
Traffic flow framework search strategy

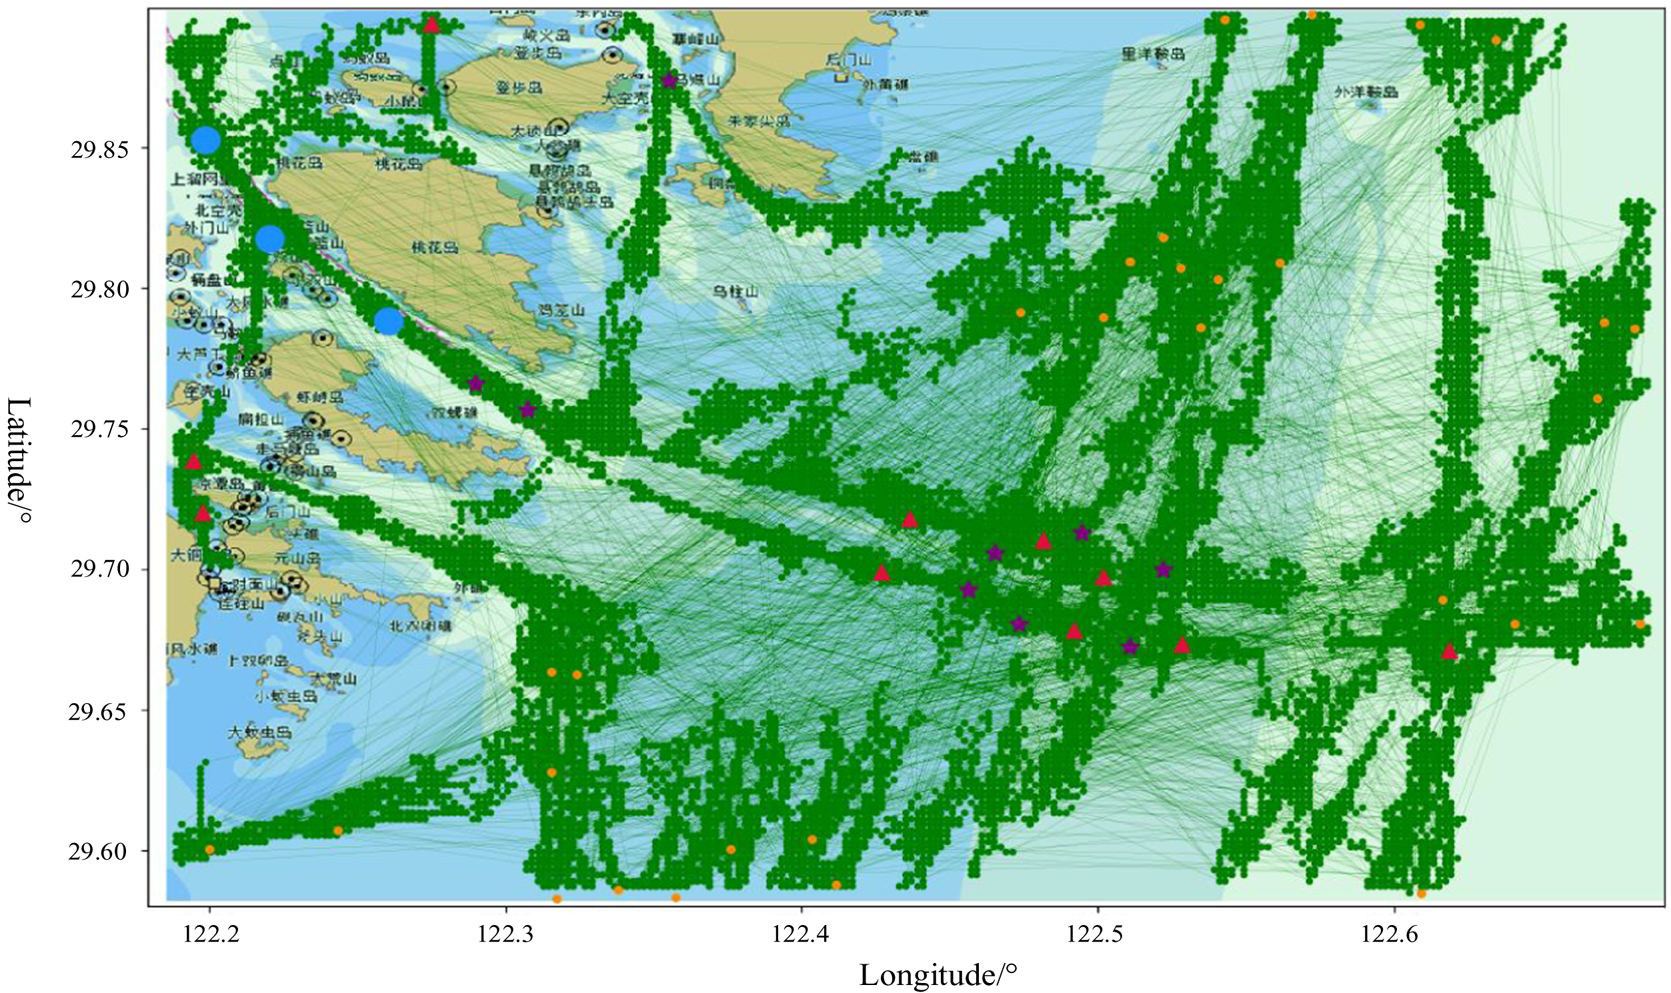
Finally, the SNRF for ship sailing based on the AIS big data is generated by continuously adding new initial search points (Figure 26), until the increment of AIS big data reaches the threshold condition, which is also the prototype of the future establishment of maritime highways.
Diagram of traffic flow framework

6. Conclusions and future work
An important aspect of the development of maritime shipping is accessibility, which is the result of the cooperative efforts of maritime transportation networks and ship activities. The accessibility and navigability at sea are the first features of the SNRF. Ship AIS big data can describe the spatial position and attributes of a ship over time, which contains a large amount of information, such as human factors of the ship's pilot, manoeuvrability of the ship, geographical characteristics, International Regulations for Preventing Collisions at Sea (COLREGS), good seamanship, common practices at sea and personal driving preferences of the ship's pilot. This study uses AIS big data to build a SNRF using the high-density search method, which serves as the basic theoretical support for actual voyage distance calculation, route planning and route accessibility inspection in the future. This method can compensate for the shortcomings of the single information previously displayed by the ship traffic flow network.
Future research could focus on: (1) Port channel digital twin; this paper was based on the AIS data extracted from the SNRF, and follow-on research can be combined with real-time detection of wind, wave and current data at sea, adaptive adjustment of the SNRF, to realise the real-time detection of all the elements in the port channel to construct the port channel digital twin system; (2) Intelligent scheduling of ships inbounding and departure, based on the SNRF, can provide more candidates for ships inbounding and departure ports, the entry and exit interfaces and paths in and out of the waterway, and can be more flexible for the path planning of ships inbounding and departure ports and time optimisation; (3) Marine route planning, which can be based on the SNRF for route planning and voyage calculation.
Acknowledgements
This project was supported partially by National Natural Science Foundation of China (52201414), Young Elite Scientists Sponsorship Program by China Institute of Navigation (No.YESSCIN2023002), National Key R&D Program of China (2022YFC3006003, 2022YFB3207400), Natural Science Foundation of Tianjin (22JCQNJC00290) and Fundamental Research Funds for the Central Public Welfare Research Institutes (TKS20240305) and Tianjin Transportation Technology Development Plan Project (2023-47), and supported by School of Marine Science and Technology of Tianjin University.
Conflicts of interest
The authors declare no conflict of interest.